Getting Started with OpenObserve
OpenObserve vs SigNoz compared in detail: architecture (object storage vs ClickHouse), pricing, self-hosting overhead, RUM and session replay, query language, and migration. A full feature-by-feature breakdown for teams choosing an open-source, OpenTelemetry-native observability platform.
A complete OpenTelemetry overview: architecture, components, OTLP, and the Collector, plus what its 2026 CNCF graduation means.
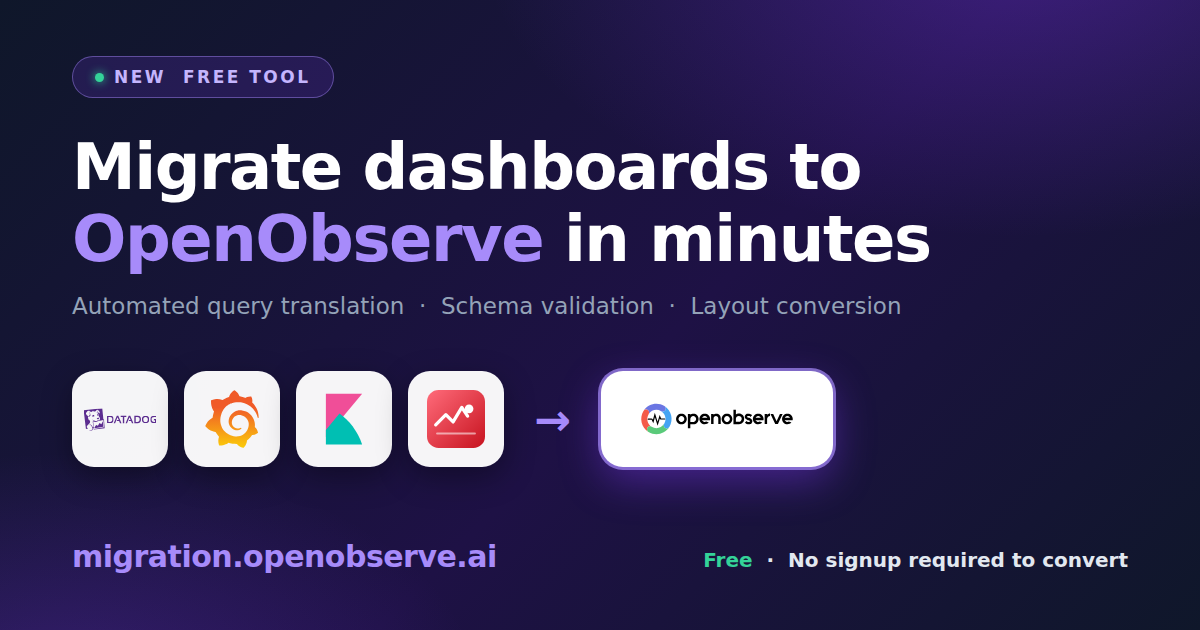
Free tool that converts Datadog, Grafana, Kibana, and CloudWatch dashboards to OpenObserve. Queries translated, layouts preserved, no signup required.
Helicone entered maintenance mode after Mintlify's March 2026 acquisition, with new signups closed and the roadmap frozen. Here's how to move LLM observability off Helicone's proxy and onto OpenObserve: replace the base-URL proxy with OpenTelemetry instrumentation, map Properties, Users, and Sessions to gen_ai attributes, and get infra correlation in the same backend.
We optimized OpenObserve for speed and cost and let the UI take a backseat. You told us. Here is what we changed, and why we are not done.
You asked, we shipped: make one dashboard the org-wide landing view in OpenObserve. Pin it from the dashboard list or the dashboard header, and everyone on the team sees the same Home tab, server-side and across devices.
Twelve config-level tactics for observability cost optimization, sampling, pipeline filtering, retention tiers, and cardinality control, with before/after numbers and real config examples for logs, metrics, and traces.
OpenObserve vs Langfuse in 2026: unified infra+LLM observability vs a dedicated LLM platform. Feature matrix, pricing, and when to use each (or both).
Compare the top 10 AIOps platforms in 2026 — features, pricing, and use cases for autonomous operations, alert correlation, root cause analysis, and intelligent incident response.
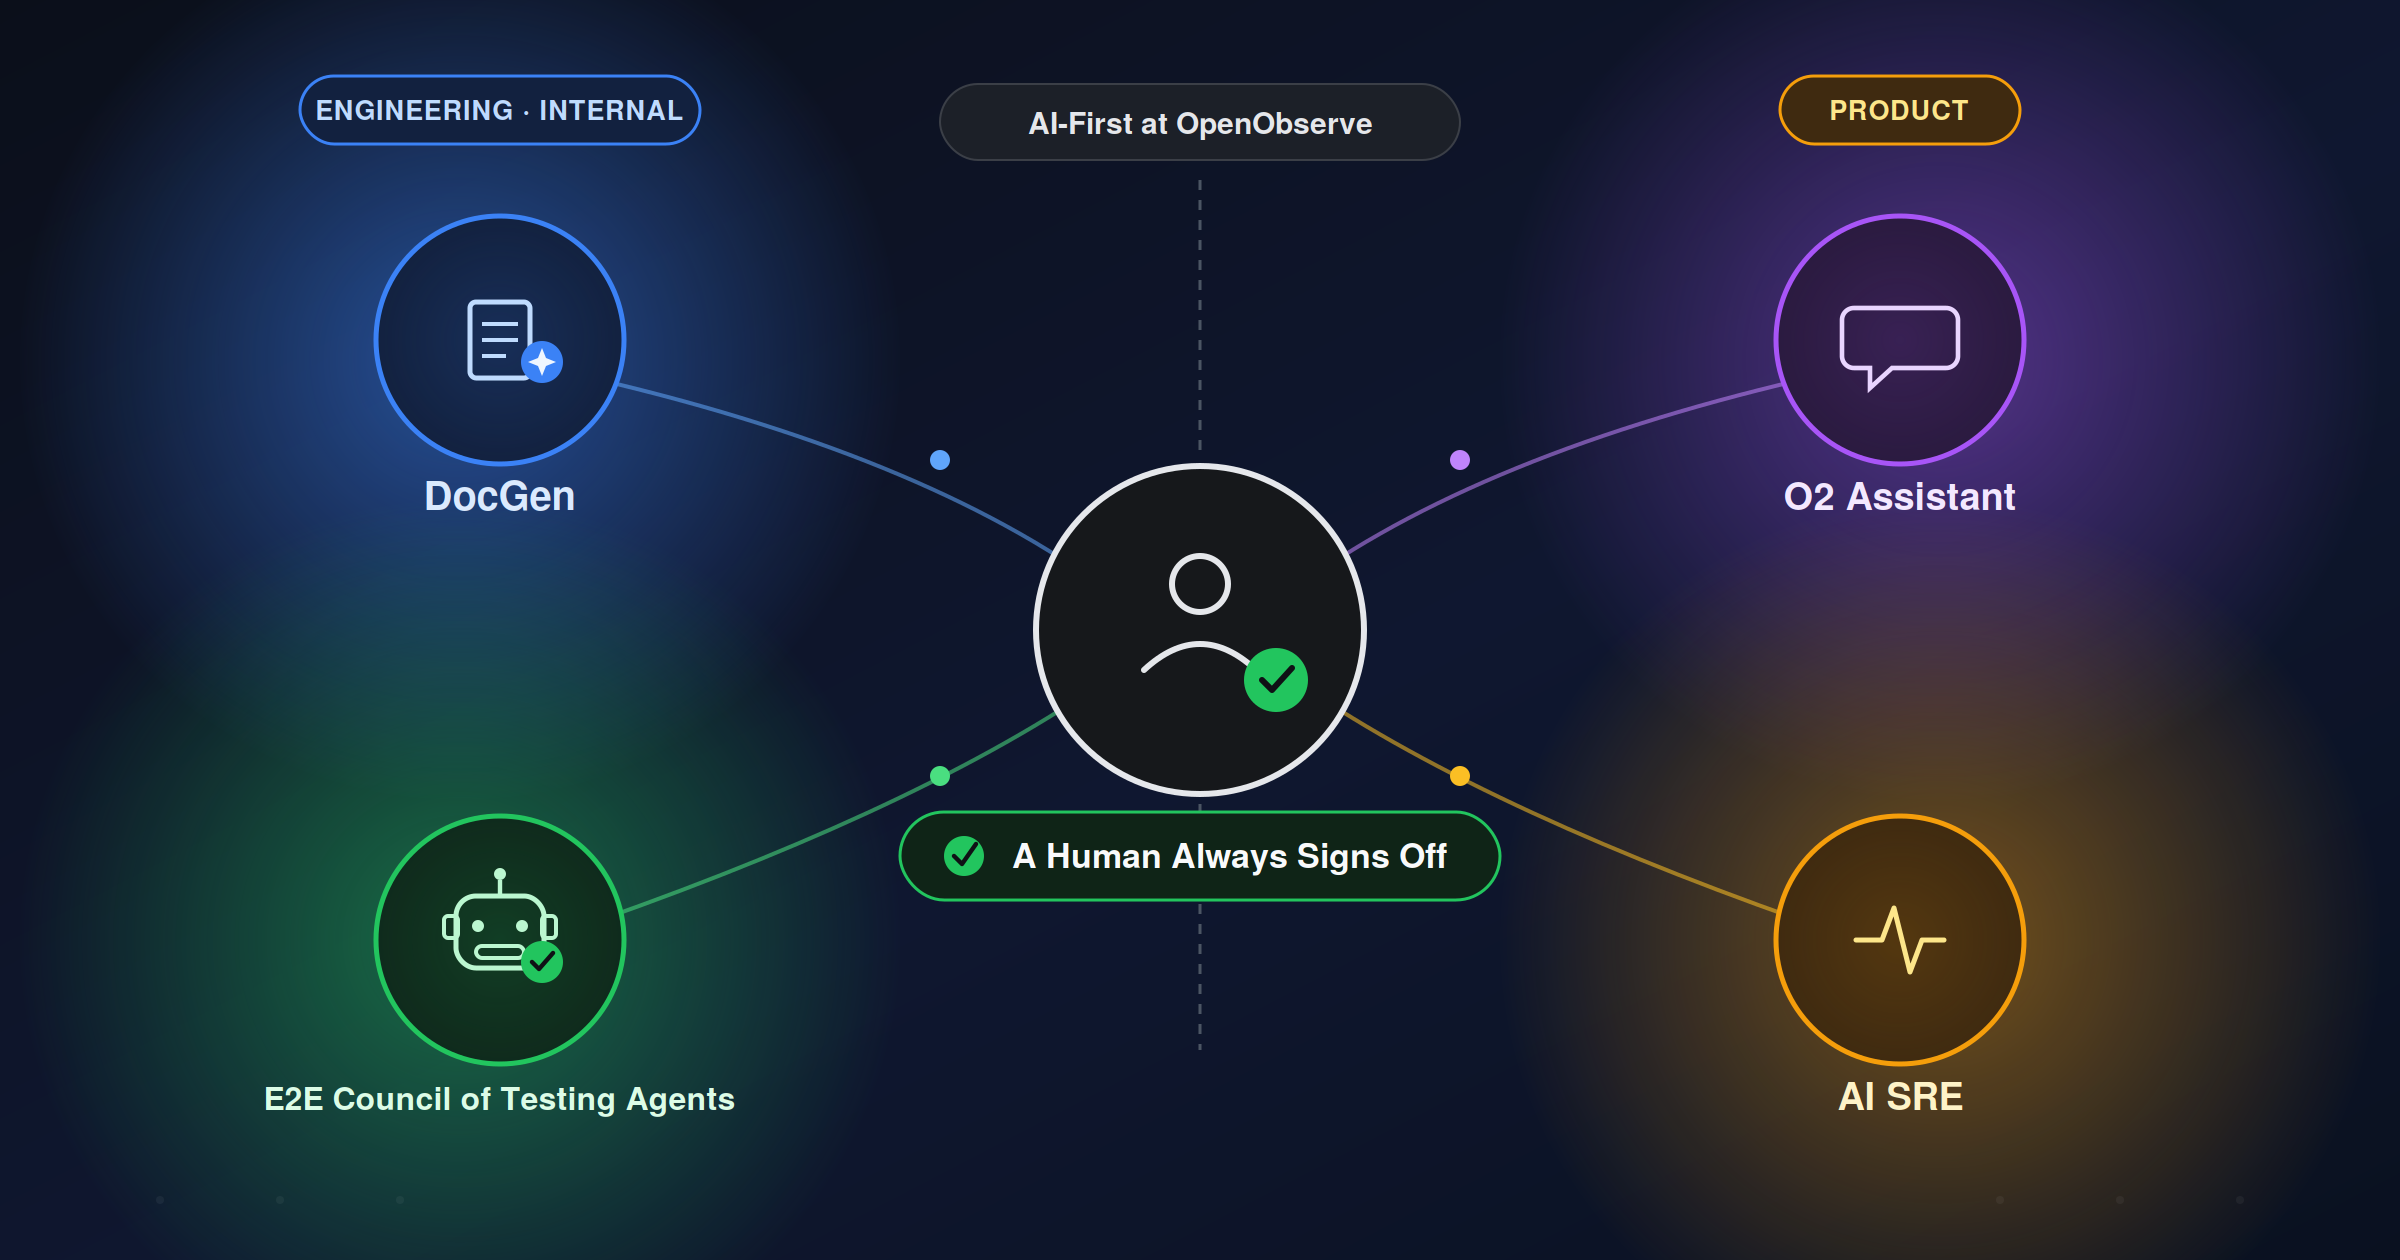
"AI-first" is easy to say and hard to prove. At OpenObserve we ship two AI features to users - O2 Assistant and the AI SRE - and run our own engineering shop the same way, with DocGen writing our docs and the Council of Agents writing and healing our end-to-end tests. This is the story of moving both out of "a human runs this locally" and into CI, where they now fire on their own: giving agents a browser, an ingestion API, and a real running instance so they can build, seed, click, and verify the tedious work instead of asking a person to grind through it.
A practical engineering runbook for getting the most out of OpenObserve Real User Monitoring control ingestion volume and cost, protect the page load, mask PII, enrich sessions with business context, and stitch frontend events to backend traces.
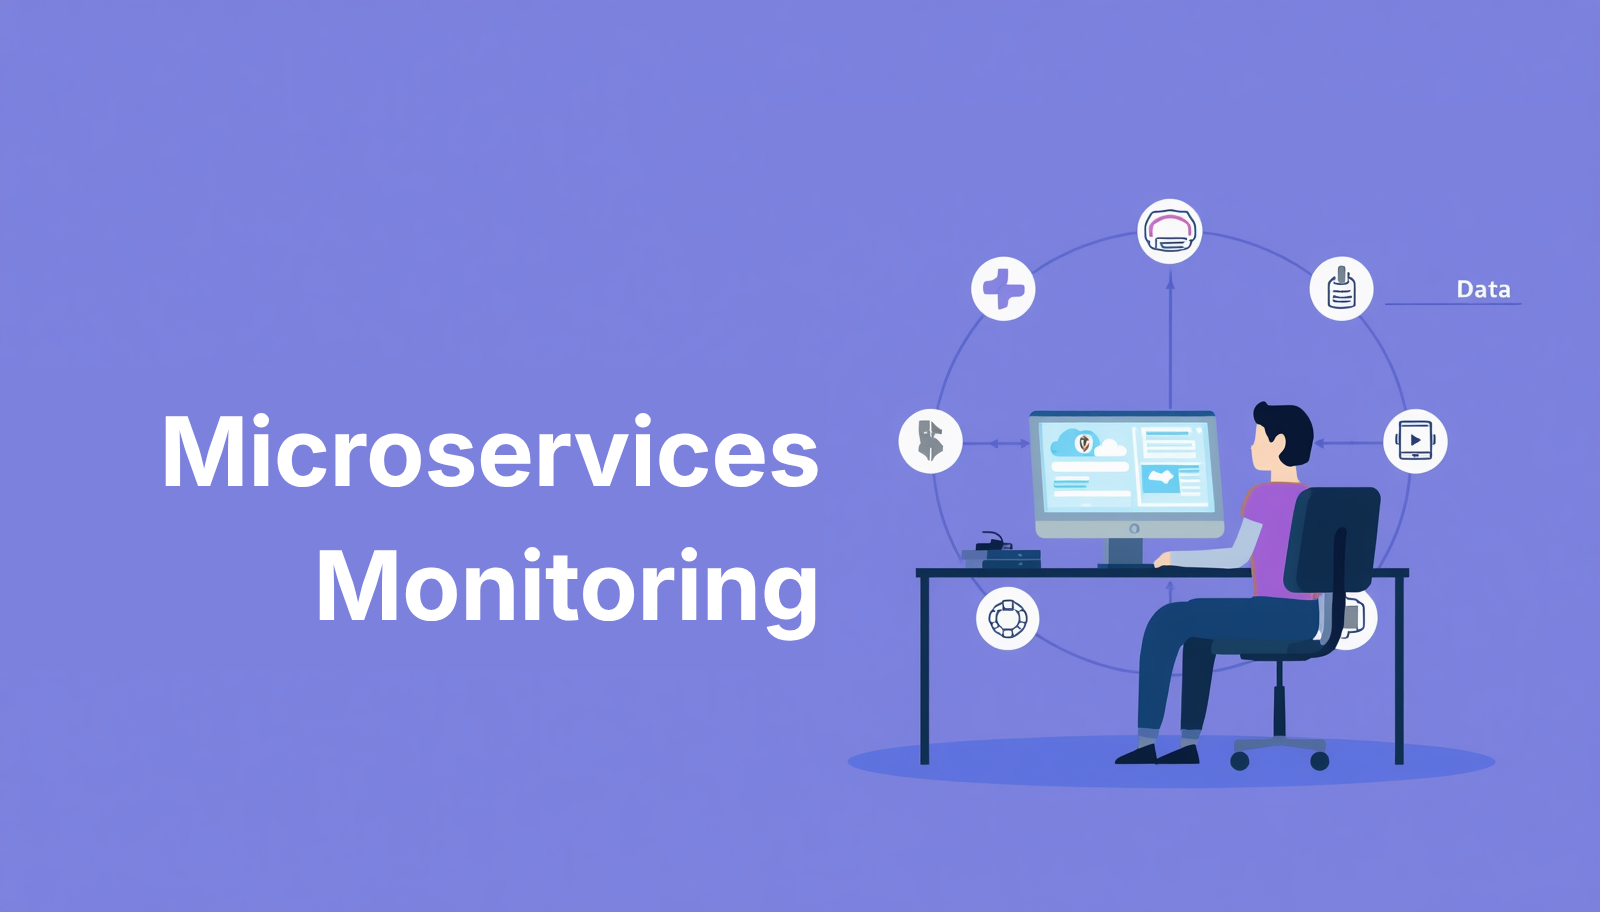
Learn what microservices monitoring is, the 3 pillars of observability, and why OpenObserve is the best open-source tool for monitoring microservices in 2026. 140x lower storage costs, unified logs, metrics, and traces.
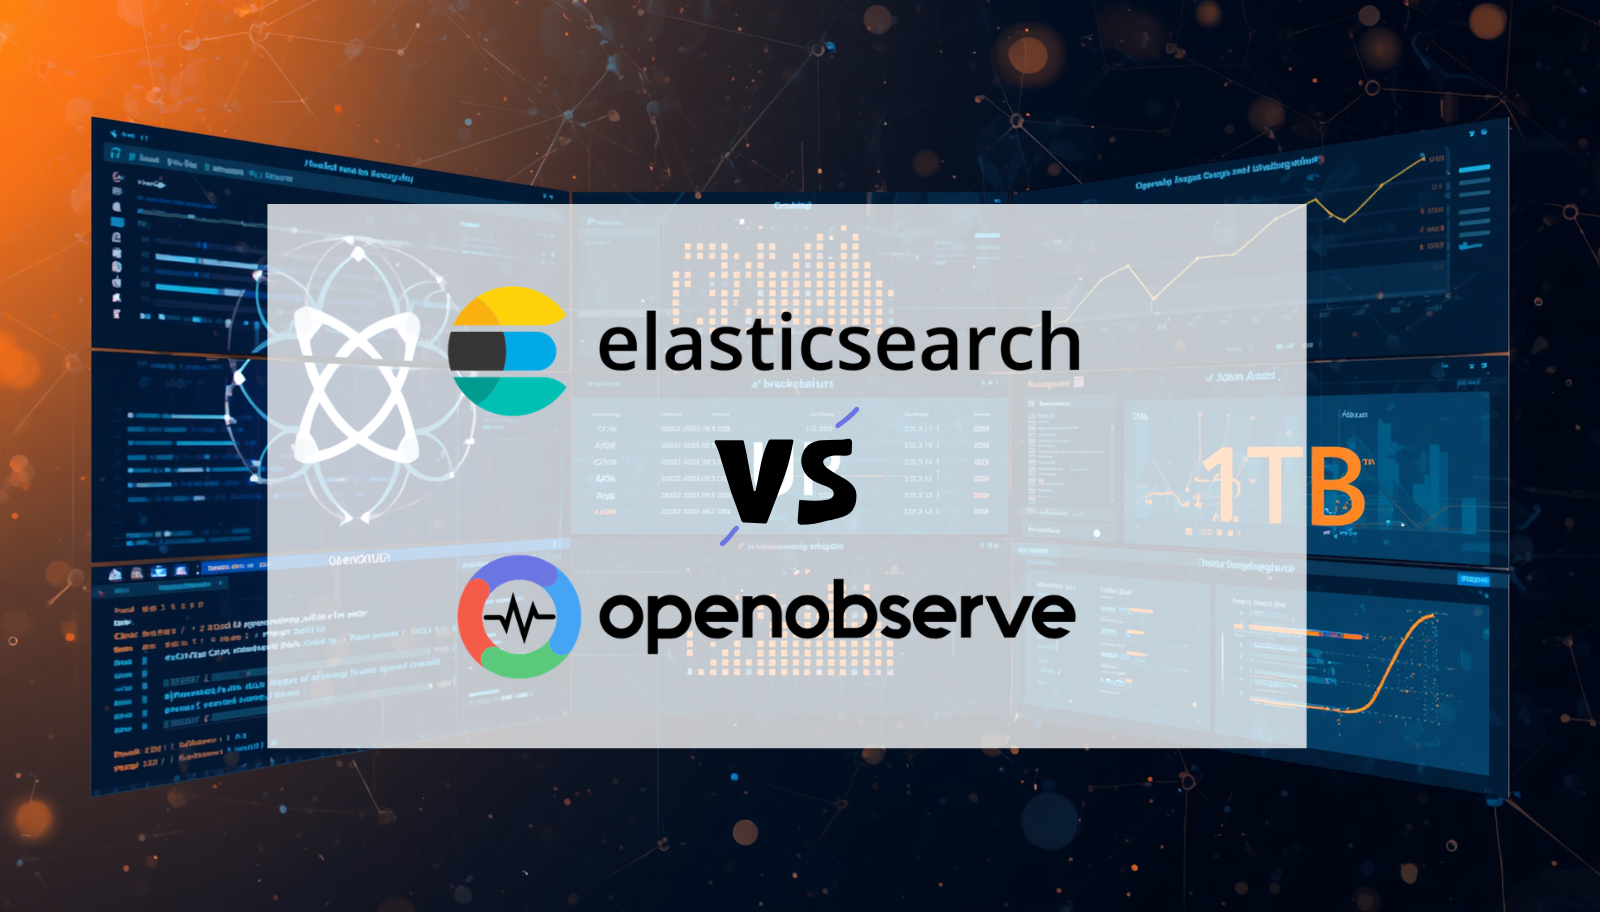
We streamed 1.1 TB of Kubernetes-format log data to both Elasticsearch and OpenObserve simultaneously on identical AWS hardware. A detailed performance benchmarking and comparison of storage, CPU, RAM, and query performance.
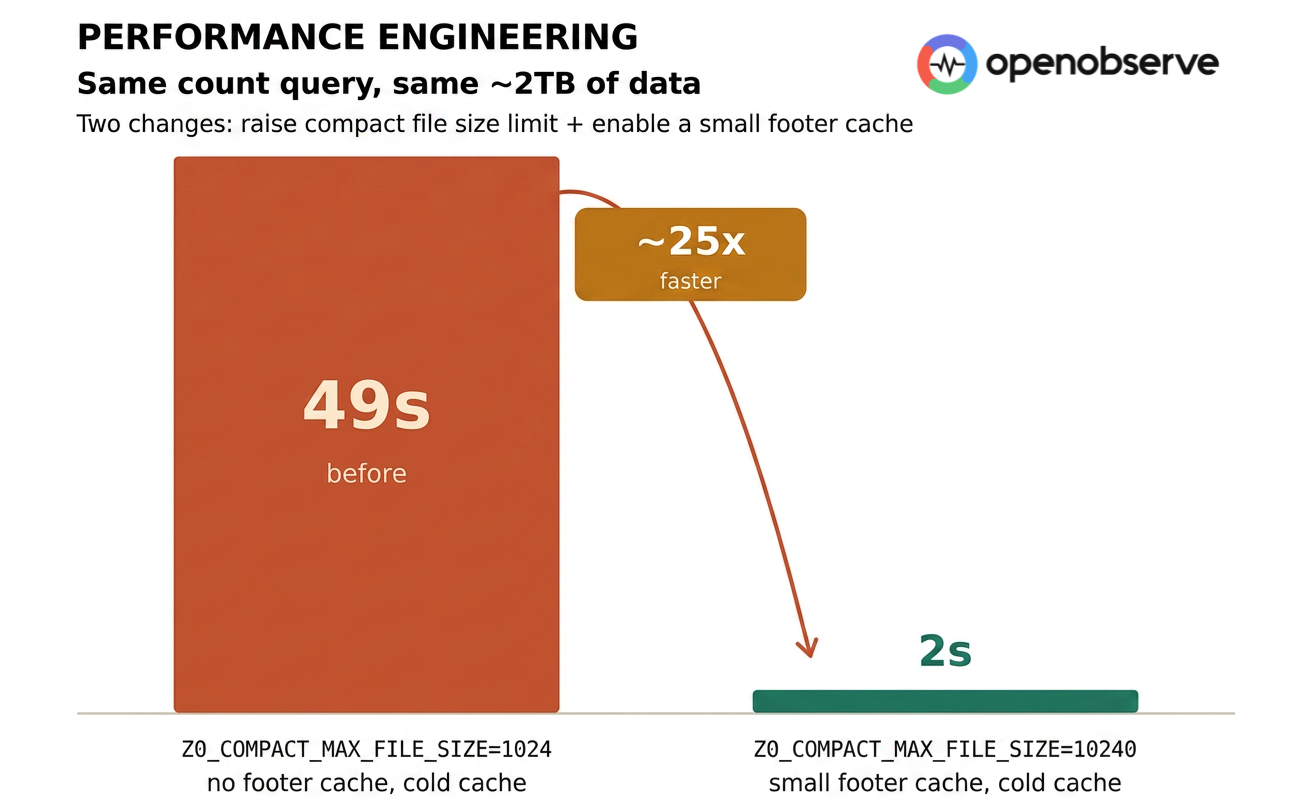
Same ~2TB of data, same count query, same querier config — two parameter changes took a Tantivy query from 49 seconds to 2 seconds. Learn how raising compact file size and enabling footer cache drove a 25× speedup by slashing S3 requests from 10,000+ to ~600.
OpenObserve now supports Terraform for infrastructure-as-code deployments, Bring Your Own Bucket for full control over your data storage, and ships targeted UX improvements across the service catalog, traces view, and log correlation.
Learn how to use OpenObserve's RUM source map feature to transform cryptic minified stack traces into readable, debuggable code with original filenames, line numbers, and function names. Covers setup, CI/CD integration, and troubleshooting.
A practical on-call runbook template built for SREs and on-call engineers. Includes a 5-phase response framework, first-5-minutes checklist, and AI-assisted debugging with OpenObserve MCP.
How to monitor n8n workflows with Prometheus metrics and OpenTelemetry tracing using OpenObserve. Covers self-hosted n8n and instrumenting services that call n8n webhooks.
OpenObserve raises $10M Series A to launch Observability 3.0. Discover our AI-native platform featuring an autonomous AI SRE, LLM observability, and anomaly detection.
Learn what MCP servers are available for observability and how to connect AI assistants to logs, metrics, and traces. Includes platform comparison, real use cases, and a 2-minute setup guide.
Datadog bills surprising you? OpenObserve is a free, open source observability platform replacing Datadog for logs, metrics, traces, dashboards, alerts, and RUM with 60–98% lower costs.