Best Synthetic Monitoring Tools in 2026: Top 9 Compared




Ready to get started?
Try OpenObserve Cloud today for more efficient and performant observability.
A system that's down can't tell you it's down. Logs, metrics, and traces only speak once traffic arrives, so a checkout API that started failing TLS handshakes at 3 a.m. stays silent until the first support ticket lands, sometimes hours later. Synthetic monitoring closes that gap: scheduled, outside-in checks that run independently of the system they watch, so you find out first instead of last.
This guide ranks the top synthetic monitoring tools in 2026, what they check, how they alert, and where each one fits, for engineering, SRE, and platform teams choosing a tool for the first time or replacing one that's outgrown its usefulness.
For related reading, see Synthetic Monitoring vs. RUM for how the two disciplines differ, and Synthetic Monitoring Comes to OpenObserve for what shipped in OpenObserve's beta.
TL;DR: Key Takeaways
OpenObserve is the strongest synthetic monitoring platform in 2026: HTTP, TCP, TLS, and SSH checks with per-type assertions, full @playwright/test browser checks from a no-code recorder or your own scripts, and Private Locations for internal endpoints, all landing in the same SQL-queryable platform as your logs, metrics, and traces, no second tool, no manual correlation.
Try Synthetic Monitoring free →
- Best overall: OpenObserve: unifies synthetic checks with RUM, logs, metrics, and traces in one platform, so a failing check is already sitting next to the telemetry that explains why.
- Best for internal or firewalled endpoints: OpenObserve: Private Locations run an outbound-only agent inside your network, no inbound port opened, no credentials shipped to a third party.
- Best for browser journey testing without lock-in: OpenObserve: full
@playwright/testscripts, not a proprietary DSL, plus a no-code recorder for teams who'd rather not start from code. - Best for cost-conscious teams: OpenObserve: usage-based platform pricing, without a separate per-test-run charge stacked on top of everything else.
- Best for reducing alert fatigue: OpenObserve: classifies flaky failures separately from genuinely degraded checks, with cooldown controls so one bad minute doesn't turn into forty pages.
- Best for teams already on OpenObserve: synthetics live in the same Experience section as RUM, so investigation starts in the same query layer as everything else.
Top Synthetic Monitoring Tools at a Glance
| Rank | Tool | Best Known For |
|---|---|---|
| 1 | OpenObserve | Unified with logs, metrics, traces, and RUM; Playwright checks; Private Locations |
| 2 | Datadog Synthetic Monitoring | Deep APM/RUM integration, broad protocol coverage |
| 3 | Checkly | Playwright-native, monitoring-as-code |
| 4 | Grafana Cloud Synthetic Monitoring (k6) | Native fit for Grafana/Prometheus/Loki stacks |
| 5 | Catchpoint | Enterprise-grade global network diagnostics |
| 6 | Dynatrace Synthetic Monitoring | AI-assisted root cause via Davis AI |
| 7 | New Relic Synthetics | Generous free tier, NRQL correlation |
| 8 | Pingdom | Simple setup, established uptime checks |
| 9 | UptimeRobot | Free tier for small projects and solo devs |
Full breakdown of each tool's pros, cons, and where it fits is below.
What Is Synthetic Monitoring?
Synthetic monitoring runs scheduled, scripted checks against your systems, HTTP requests, TCP and TLS handshakes, SSH connections, or full browser journeys, independent of whether a real user happens to be visiting at the time. Because checks run on a fixed schedule from external (or internal) locations, synthetic monitoring catches an outage, a broken deploy, or an expiring TLS certificate before a single customer hits the failure.
Core capabilities to expect from a modern synthetic monitoring tool:
- Protocol checks: HTTP/HTTPS, TCP port, TLS certificate expiry, SSH connectivity, DNS, and similar low-level checks with configurable assertions
- Browser / journey checks: Full multi-step user flows (log in, add to cart, check out) run in a real browser, not just a single request
- Multi-location probing: Running the same check from several geographic locations to distinguish a global outage from a regional network issue
- Private/internal checks: Reaching endpoints behind a firewall (staging, internal admin tools) without opening inbound ports
- Alerting with noise control: Distinguishing a single flaky failure from a genuinely degraded service, so on-call isn't paged for a blip
- Result storage and correlation: Where check results live, and how easily they connect to the rest of your observability data
For how this differs from Real User Monitoring, and why most mature setups need both, see Synthetic Monitoring vs. RUM.
Why Synthetic Monitoring Matters in 2026
1. It catches what real users can't report. Overnight windows, low-traffic staging environments, and pre-launch validation all have zero real visitors to trigger a RUM alert. Synthetic checks run whether anyone is looking or not.
2. It's proactive, not reactive. A TLS certificate expiring in six hours, a DNS misconfiguration after a deploy, a broken checkout flow, synthetic checks catch these before they become customer-facing incidents, not after.
3. It validates critical paths on a schedule. Login, checkout, search, whatever your business depends on, a browser check exercises that exact path every few minutes, regardless of organic traffic patterns.
4. It reduces mean time to detection. The gap between a failure starting and someone noticing is often the largest component of an incident's total duration. A check that fails on its next scheduled run, sometimes under a minute after the failure begins, closes most of that gap automatically.
5. It supports SLA and uptime reporting. Contractual uptime commitments need independent, third-party-style verification; internal metrics dashboards alone don't satisfy that requirement the way an external check history does.
What to Look for in a Synthetic Monitoring Tool
| Feature | Why It Matters |
| Check Types | HTTP, TCP, TLS, SSH, DNS coverage determines what parts of your stack you can actually validate |
| Browser / Journey Testing | Whether multi-step user flows run in a real browser, and whether scripts are portable (Playwright) or locked to a proprietary format |
| No-Code Option | A recorder for non-engineers to build checks without writing scripts, ideally one that can be refined into code later |
| Private Locations | Ability to check internal, firewalled endpoints without opening an inbound port or sharing credentials externally |
| Global Probe Network | Number and distribution of public check locations, to distinguish regional network issues from a true outage |
| Alert Noise Control | Flaky-vs-degraded classification and cooldown logic, so a single bad probe run doesn't page on-call |
| Evidence on Failure | Screenshots, step-level detail, and request/response bodies captured at the moment of failure, not just a pass/fail status |
| Correlation with Other Telemetry | Whether check results live in the same queryable platform as your logs, metrics, and traces, or in a separate silo |
| Deployment Model | SaaS-only, self-hosted, or hybrid; affects data residency and whether you can run your own private probes |
| Pricing Model | Per-test-run, per-check, per-host, or bundled into a platform; shapes total cost as check frequency and locations grow |
Best Synthetic Monitoring Tools in 2026: Detailed Comparison
1. OpenObserve
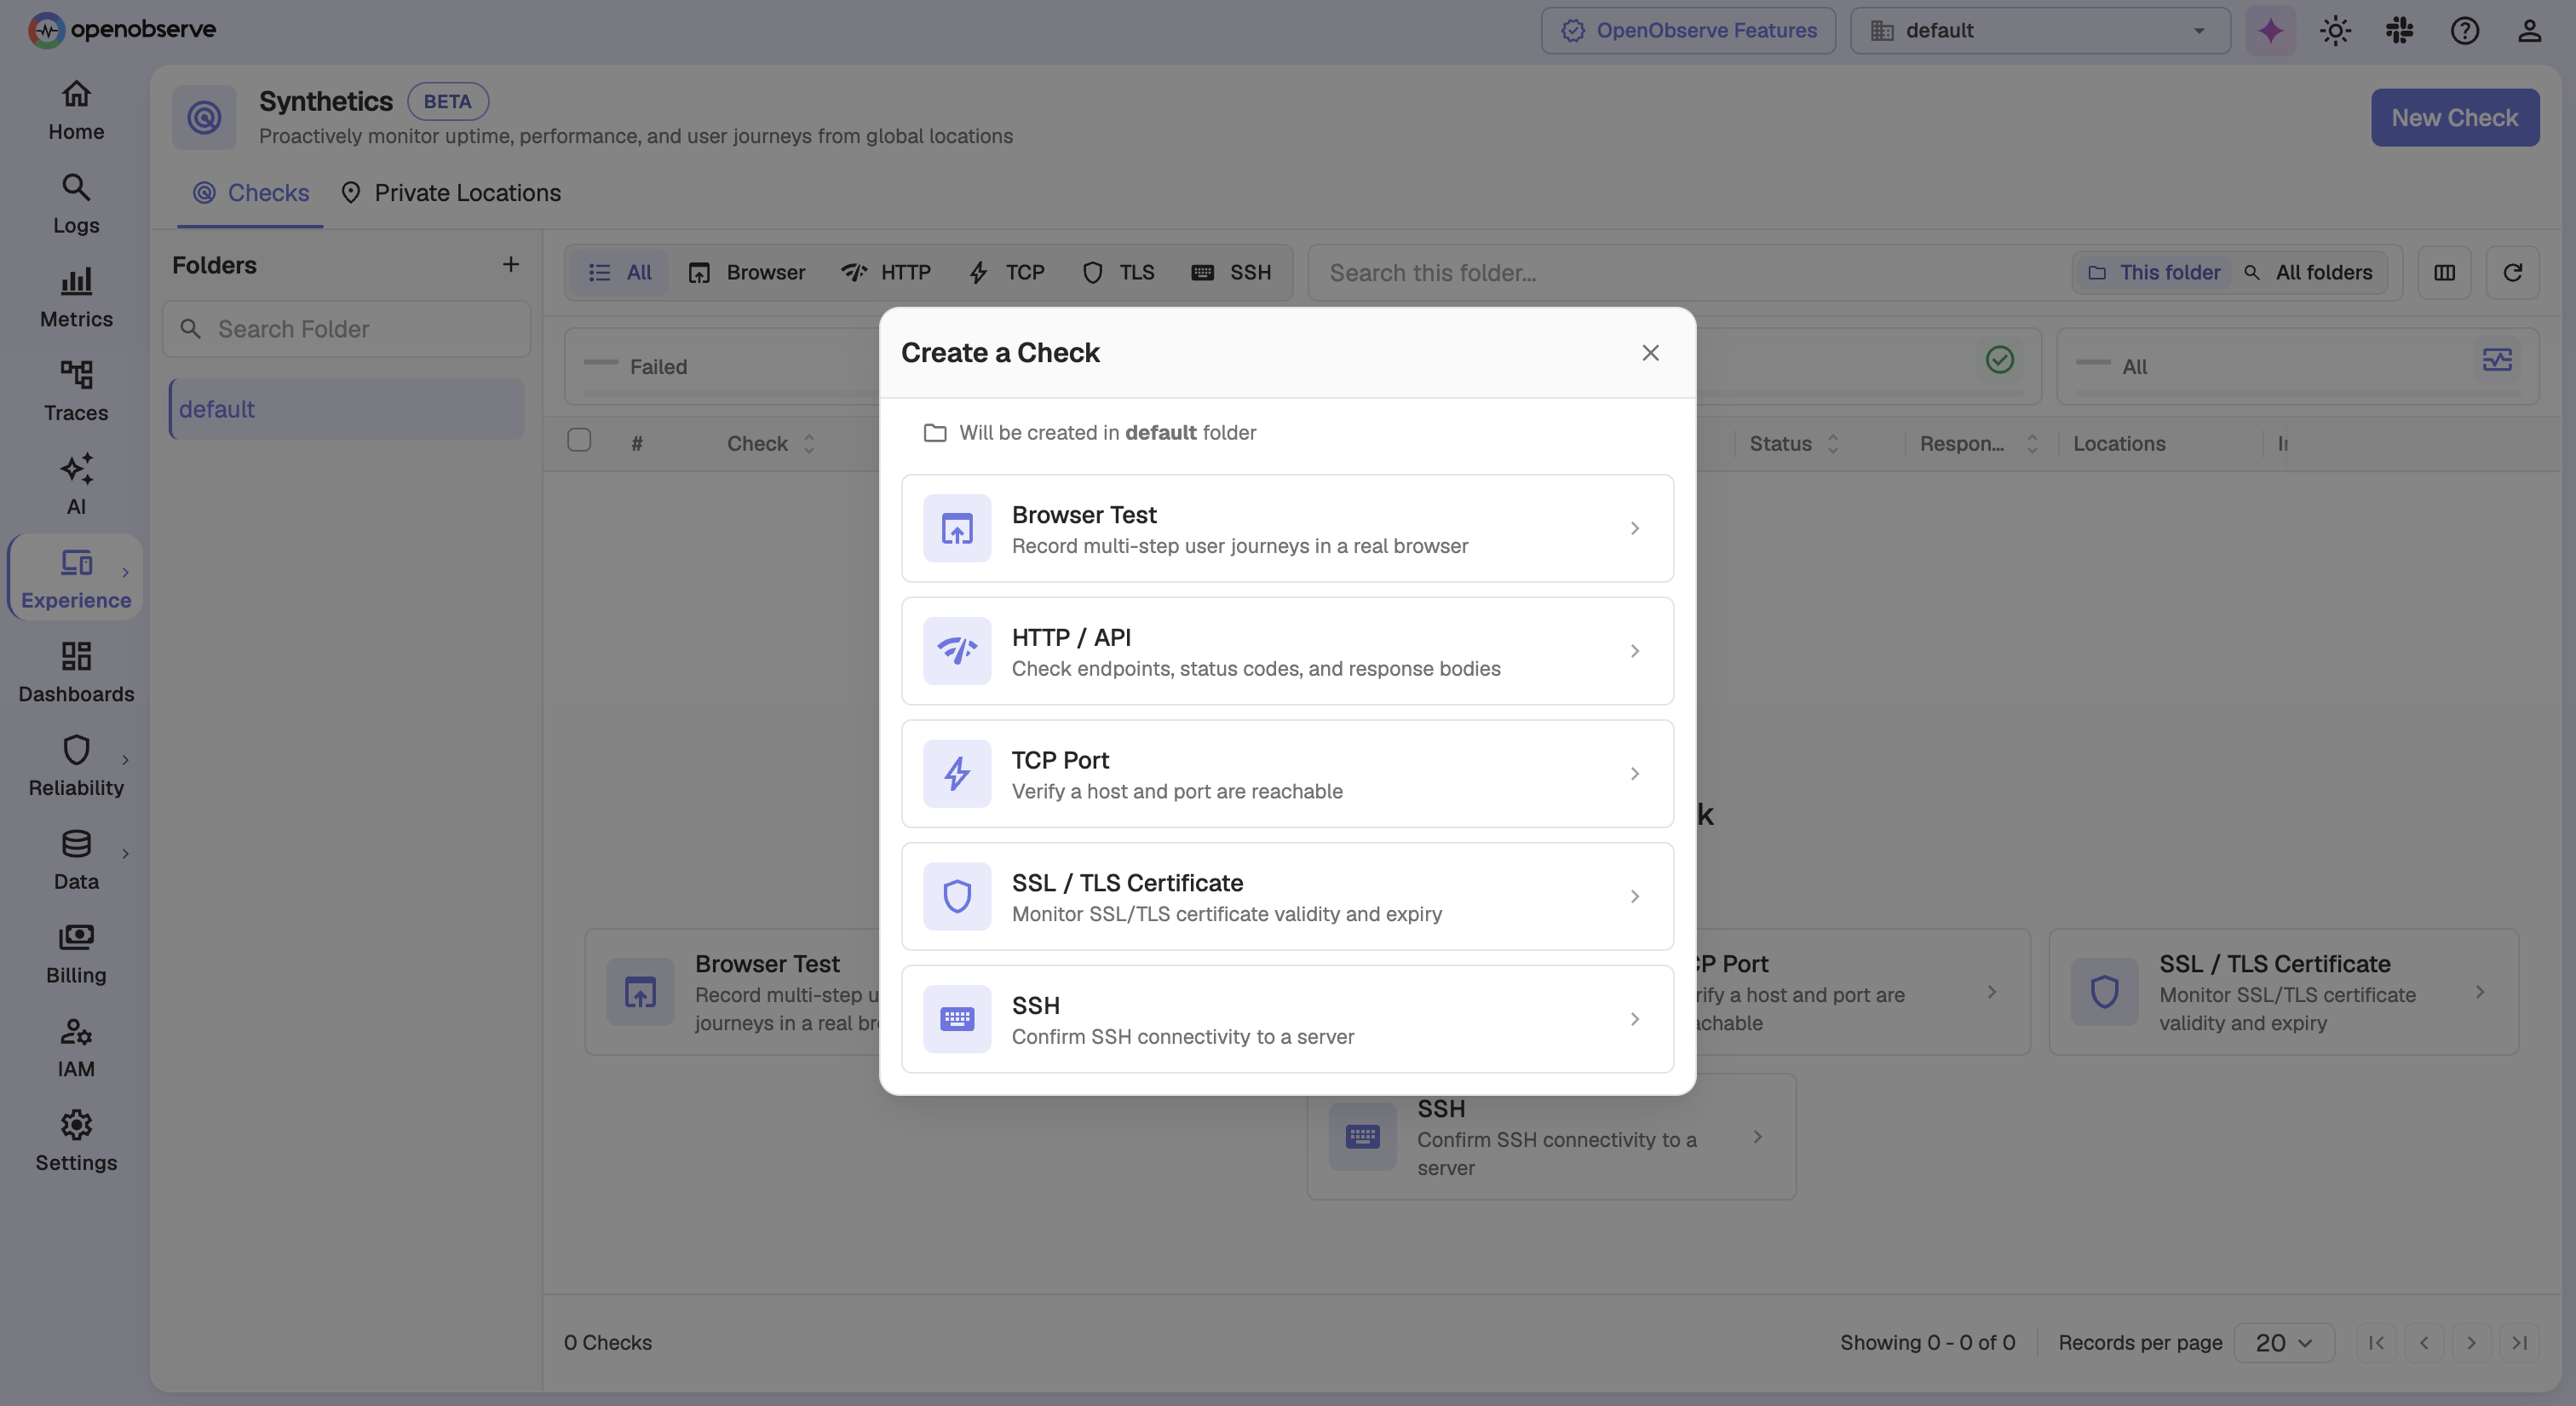
OpenObserve brings Synthetic Monitoring into the same platform as logs, metrics, traces, and RUM, live in beta on OpenObserve Cloud. It covers HTTP, TCP, TLS, and SSH checks with per-type assertions, plus full browser checks built from a no-code recorder or real @playwright/test scripts.
OpenObserve Pros:
- Unified Platform: Synthetic check results land in a native
synthetics_resultsstream, queryable with SQL, right alongside your logs, metrics, traces, and RUM sessions, so investigation starts where the alert fired, not in a second tool - Real Playwright Scripts: Browser checks run standard
@playwright/testscripts, the same ones your engineers already write for CI, so they're versioned and reviewed like real code rather than locked into a proprietary DSL - No-Code Recorder: Capture a journey (log in, add to cart, check out) by clicking through it, then refine it into code when you're ready
- Private Locations: A lightweight, outbound-only agent checks internal and firewalled endpoints with no inbound port and no credentials shared with a third party, a capability other vendors typically gate behind a paid enterprise tier
- Evidence Panels: Every failed step captures a screenshot and step-level detail, so debugging starts from what actually happened, not a bare pass/fail
- Noise-Aware Alerting: Classifies flaky failures separately from genuinely degraded checks, with recovery notices and cooldown controls so a single bad probe run doesn't page on-call repeatedly
- Self-Hosted or Managed: Deploy on your own infrastructure or use OpenObserve Cloud, with no forced SaaS dependency
- Usage-Based Pricing: Included as part of OpenObserve's overall platform pricing, without a Datadog-style separate per-test-run charge
OpenObserve Cons:
- Synthetic Monitoring is in beta, so the public probe location network and some advanced assertion types are still expanding compared to decades-old dedicated synthetic vendors
Integration / Mitigation:
- Find Synthetics in the Experience section of OpenObserve, next to RUM
- Start with an HTTP or TLS check by pasting a URL, or record a browser journey in minutes
- Set up a Private Location agent for internal endpoints that public checkers can't reach
- Dashboard and alert on
synthetics_resultsusing the same SQL and alerting you already use for logs and traces - Read the Synthetic Monitoring release notes and Synthetic Monitoring vs. RUM for a deeper walkthrough
2. Datadog Synthetic Monitoring
Datadog Synthetic Monitoring is part of the broader Datadog platform, offering API tests (HTTP, TCP, DNS, SSL, ICMP, gRPC), multistep API tests, and browser tests with tight integration into Datadog APM and RUM. For a full pricing breakdown, see our Datadog pricing guide, and for what the per-test-run model specifically costs at scale, see Datadog Synthetic Monitoring Pricing: The Per-Test Trap; for alternatives, see Datadog competitors.
Datadog Synthetic Monitoring Pros:
- Deep Platform Integration: Pivot directly from a failing synthetic check to related APM traces and RUM sessions within the same platform
- Broad Protocol Coverage: HTTP, TCP, DNS, SSL, ICMP, WebSocket, and gRPC checks, beyond the basics most competitors cover
- Multistep API Tests: Chain multiple API calls together with assertions and variable extraction between steps
- Global Managed Locations: A large number of managed probe locations across regions and cloud providers
- Private Locations: Agent-based checks for internal endpoints, available as an add-on
Datadog Synthetic Monitoring Cons:
- Per-Test-Run Pricing: Billed at $5.00 per 10,000 API test runs, with costs multiplying quickly as check frequency and the number of locations increase
- Stacks on Existing Datadog Spend: Synthetics is one more line item on top of infrastructure, APM, RUM, and log costs that are already among the highest in the category
- SaaS Only: No self-hosted deployment option for teams that need on-premises data residency
- Browser Test Complexity: Advanced multistep browser scripts can require significant setup time compared to portable script formats
Integration / Mitigation:
- Scope synthetic check frequency and locations deliberately; both are direct cost multipliers
- Use Datadog's cost monitoring tools to track synthetic spend as a distinct line item
- Consider OpenObserve where synthetics need to live alongside cost-effective log and trace retention rather than Datadog's per-GB log pricing
3. Checkly
Checkly is a developer-first, monitoring-as-code platform built natively around Playwright, designed for teams that want checks defined, versioned, and deployed the same way they ship application code.
Checkly Pros:
- Playwright-Native: Checks are written as real
@playwright/testscripts from the start, with strong CLI and CI/CD integration - Monitoring as Code: Checks live in your repository, get code review, and deploy through your existing pipeline
- Fast Setup for Developers: Engineers comfortable with Playwright are productive almost immediately
- API and Browser Checks: Covers both simple API assertions and full browser journeys
Checkly Cons:
- Synthetics-Only Focus: No native logs, metrics, or traces; teams need a separate observability platform for everything else and must correlate manually
- Less Approachable for Non-Engineers: The code-first philosophy is a strength for developers but a barrier for teams that want a no-code recorder option
- Per-Check Pricing: Costs scale with check volume and frequency, similar to other dedicated synthetic vendors
Integration / Mitigation:
- A strong fit for engineering teams that already treat infrastructure as code and want the same discipline for checks
- Forward check failure events to your main observability platform to avoid a fully siloed alerting workflow
- Consider OpenObserve when you want Playwright-based checks living in the same platform as the rest of your telemetry rather than a standalone tool
4. Grafana Cloud Synthetic Monitoring (k6)
Grafana Cloud Synthetic Monitoring, built on the k6 testing engine, brings HTTP, TCP, DNS, ICMP, and browser checks into the Grafana ecosystem, a natural fit for teams already running Grafana, Prometheus, and Loki.
Grafana Cloud Synthetic Monitoring Pros:
- Grafana-Native: Check results flow into Grafana dashboards and alerting alongside existing Prometheus metrics
- k6 Foundation: Built on a well-established, developer-friendly load and browser testing engine
- Prometheus-Compatible Output: Metrics from checks integrate cleanly with teams already standardized on the Prometheus data model
- Flexible Check Scripting: k6's JavaScript-based scripting supports complex, custom check logic
Grafana Cloud Synthetic Monitoring Cons:
- Metrics-First, Not Log/Trace-Native: Strongest for metric-style check results; deeper log or trace correlation still typically means pairing with Loki and Tempo separately, part of the broader Grafana LGTM stack operational overhead
- Requires Grafana Cloud for Full Hosted Probes: Self-hosted k6 exists, but the managed multi-location probe network requires a Grafana Cloud subscription
- Browser Check Maturity: Newer relative to long-established browser testing tools
Integration / Mitigation:
- A strong fit for teams already standardized on the Grafana/Prometheus/Loki stack
- Pair with Loki and Tempo for log and trace correlation on top of check metrics
- Consider OpenObserve if you want synthetics, logs, metrics, and traces queryable together with one SQL layer instead of three separate Grafana-ecosystem tools
5. Catchpoint
Catchpoint is an enterprise-grade Internet Performance Monitoring platform built around one of the industry's largest dedicated global probe networks, including ISP-level and last-mile nodes, for teams that need deep network path diagnostics.
Catchpoint Pros:
- Massive Global Node Network: Extensive ISP, backbone, and last-mile monitoring locations, well beyond typical cloud-region probe coverage
- Deep Network Diagnostics: BGP monitoring, traceroute analysis, and CDN performance breakdowns for diagnosing network-layer issues, not just application failures
- Enterprise SLA Reporting: Purpose-built for contractual uptime and performance reporting at scale
- Broad Protocol and Browser Coverage: HTTP, API, and browser checks alongside network-layer monitoring
Catchpoint Cons:
- Enterprise Pricing: Sold on custom, sales-led contracts rather than transparent self-serve pricing, and typically expensive relative to developer-first alternatives
- Steep Learning Curve: The depth of network diagnostics adds complexity that smaller teams don't need
- Overkill for Most Web Apps: Its core strength, deep network path analysis, matters most for CDN operators, ISPs, and very large-scale consumer platforms
Integration / Mitigation:
- Best suited for large enterprises with dedicated network reliability or performance teams
- Evaluate whether your team actually needs ISP-level diagnostics or just reliable application-layer checks
- Consider OpenObserve for application and API-layer synthetic checks unified with the rest of your telemetry, without Catchpoint's enterprise sales cycle
6. Dynatrace Synthetic Monitoring
Dynatrace Synthetic Monitoring is part of the broader Dynatrace platform, combining browser clickpath and HTTP monitors with Davis AI, Dynatrace's automated root-cause analysis engine, and tight integration with real-user monitoring.
Dynatrace Synthetic Monitoring Pros:
- AI-Assisted Root Cause: Davis AI attempts to automatically correlate a failing check with the underlying infrastructure or code-level cause
- Full-Stack Integration: Synthetic checks connect to Dynatrace's broader APM, infrastructure, and RUM data
- Clickpath Recorder: No-code browser journey recording for non-engineers
- Enterprise-Grade Reliability: Mature platform with strong SLA and compliance credentials
Dynatrace Synthetic Monitoring Cons:
- Pricing Complexity: Dynatrace's consumption-based, host-unit pricing model is notoriously difficult to predict and often expensive at scale
- Heavy Agent-Based Deployment: Full platform value requires deploying Dynatrace's OneAgent broadly, a larger commitment than a lightweight checker
- Steep Learning Curve: The breadth of the platform means significant onboarding time before teams are self-sufficient
- Vendor Lock-In: Proprietary data model and agent architecture make migration away from Dynatrace a substantial project
Integration / Mitigation:
- A strong fit for large enterprises already standardized on Dynatrace for full-stack APM
- Scope which teams actually need Davis AI's automated correlation versus simpler uptime checks
- Consider OpenObserve for a lighter-weight, usage-based alternative that still unifies synthetics with logs, metrics, and traces
7. New Relic Synthetics
New Relic Synthetics provides scripted browser and API monitors as part of the New Relic One platform, with a generous free tier that makes it accessible to smaller teams evaluating full-stack observability for the first time.
New Relic Synthetics Pros:
- Generous Free Tier: 100GB/month of free data ingest across the platform covers many small and medium teams, synthetics included
- NRQL Correlation: Query synthetic check results alongside APM, logs, and infrastructure data using New Relic's query language
- Scripted Browser Monitors: Node.js-based scripting for custom multistep browser checks
- Unified Platform: Synthetics, APM, logs, and infrastructure monitoring in one product
New Relic Synthetics Cons:
- Cost Beyond Free Tier: Pricing scales with data volume and check execution once you exceed the free allowance
- NRQL Learning Curve: Teams unfamiliar with New Relic's query syntax need ramp-up time
- Node.js Script Format: Less portable than Playwright-based checks if you later migrate to a different platform
- SaaS Only: No on-premises deployment option
Integration / Mitigation:
- Use the free tier to validate synthetic monitoring value before committing to paid volume
- Apply check frequency and location limits deliberately to stay within budget as usage grows
- Consider OpenObserve for self-hosted or cost-sensitive production deployments once you outgrow the free tier
8. Pingdom (SolarWinds)
Pingdom, now part of SolarWinds, is one of the longest-running and most recognized names in uptime monitoring, known for straightforward HTTP and transaction checks with an easy setup process.
Pingdom Pros:
- Simplicity: Point Pingdom at a URL and get uptime checks running in minutes, minimal configuration required
- Established Reputation: Decades of track record and broad name recognition
- Public Status Pages: Built-in, easy-to-configure status pages for communicating uptime to customers
- RUM Add-On: Real user monitoring available as a paired product for teams that want both
Pingdom Cons:
- Limited Advanced Scripting: Browser transaction checks are less flexible than Playwright-based tools for complex multistep journeys
- No Deep APM/Log Correlation: Uptime results don't natively connect to application-level logs or traces
- Part of a Broader, Less Unified Suite: SolarWinds' portfolio spans many separately billed products rather than one cohesive platform
- Fewer Assertion Types: Less granular per-check assertion configuration than newer, developer-focused tools
Integration / Mitigation:
- A reasonable fit for teams that want simple, reliable uptime checks without deep customization needs
- Pair with a full observability platform once you need to correlate check failures with application behavior
- Consider OpenObserve when uptime checks need to sit next to logs and traces rather than in an isolated status-page tool
9. UptimeRobot
UptimeRobot is a budget-friendly, widely used uptime checker popular with solo developers, small projects, and teams that need basic HTTP, ping, port, and keyword monitoring without enterprise pricing.
UptimeRobot Pros:
- Free Tier: A genuinely usable free plan covers basic uptime checking for small projects
- Extremely Simple Setup: Add a URL, pick a check interval, done
- Broad Basic Check Types: HTTP(S), ping, port, and keyword-presence checks cover common failure modes
- Affordable Paid Tiers: Low-cost upgrades for teams that need more frequent checks or more monitors
UptimeRobot Cons:
- No Real Browser Testing on Lower Tiers: Multistep journey testing is limited or unavailable outside higher plans
- Minimal Assertions: Basic status-code and keyword checks only; no deep response validation
- Not Built for Enterprise Scale: Lacks the private location, SLA reporting, and correlation features larger teams need
- No Observability Integration: Check results stay isolated from logs, metrics, or traces
Integration / Mitigation:
- Best suited for hobby projects, small sites, or as a lightweight second opinion alongside a more capable primary tool
- Migrate to a more capable platform as check complexity and correlation needs grow
- Consider OpenObserve once you need browser journey checks and correlation with the rest of your telemetry, both free tier limitations on UptimeRobot
Synthetic Monitoring Tools Comparison Table
| Tool | Deployment | Browser Checks | Private Locations | Unified with Logs/Metrics/Traces | Pricing Model |
| OpenObserve | Self-hosted / Managed | Yes (Playwright + no-code recorder) | Yes (built-in) | Yes (native, SQL-queryable) | Usage-based platform pricing |
| Datadog | SaaS only | Yes (recorder + scripted) | Yes (add-on) | Yes (Datadog platform) | Per test run ($5/10k API tests) |
| Checkly | SaaS only | Yes (Playwright-native) | Limited | No (synthetics-only) | Per check run |
| Grafana Cloud (k6) | Self-hosted / Managed | Yes (k6 browser) | Via self-hosted k6 | Partial (via Loki/Tempo) | Grafana Cloud subscription |
| Catchpoint | SaaS only | Yes | Yes (enterprise) | Limited | Custom enterprise contract |
| Dynatrace | SaaS / Managed | Yes (clickpath recorder) | Yes (add-on) | Yes (Dynatrace platform) | Consumption-based, host units |
| New Relic Synthetics | SaaS only | Yes (scripted, Node.js) | Limited | Yes (New Relic One) | Free tier, then usage-based |
| Pingdom | SaaS only | Limited | No | No | Plan tier |
| UptimeRobot | SaaS only | Limited (higher tiers) | No | No | Free tier, then low-cost plans |
Best Practices for Synthetic Monitoring
Check the paths your business actually depends on: Login, checkout, search, whatever generates revenue or support tickets when it breaks, deserves a dedicated check, not just a homepage ping.
Run checks from more than one location: A single-location check can't distinguish a real outage from a regional network blip. Multiple locations turn a false alarm into a confirmed signal.
Separate flaky from degraded in your alerting: A check that fails once and recovers on the next run is different from one that's consistently down. Alerting that treats them the same trains on-call to ignore pages, see Alert Fatigue for why that erosion happens.
Use real scripts, not proprietary DSLs, for browser checks: Playwright-based checks are portable, reviewable in a pull request, and testable locally before they ever run as a monitor.
Cover internal endpoints, not just public ones: Staging environments, internal admin tools, and firewalled APIs fail too, and a private location agent lets you check them without opening inbound ports.
Correlate check failures with the rest of your telemetry: A failed check tells you something broke; logs and traces from the same time window tell you why. See why logs, traces, and metrics correlation matters and Incident Correlation for the investigation workflow this enables.
Pair synthetic monitoring with RUM, not instead of it: Synthetic checks catch what real users can't report; RUM shows what real users actually experienced. Neither replaces the other, see Synthetic Monitoring vs. RUM for the full comparison.
Set thresholds before you need them: Decide what counts as degraded versus down, and how many consecutive failures trigger a page, before an incident forces you to decide under pressure.
Conclusion
The best synthetic monitoring tool for your team depends on how much of your stack you need to check, whether browser journeys matter, and whether you want check results living next to the rest of your observability data or in a separate silo.
For most engineering and SRE teams in 2026, OpenObserve is the strongest all-around choice: HTTP, TCP, TLS, and SSH checks with real assertions, full Playwright browser checks that are portable and reviewable, Private Locations for internal endpoints, and noise-aware alerting, all landing in the same SQL-queryable platform as your logs, metrics, traces, and RUM sessions. No second tool, no manual timestamp-matching during an incident.
Key recommendations by use case:
- Unified observability with synthetics included: OpenObserve keeps check results, logs, metrics, and traces in one queryable platform
- Already deep in the Datadog ecosystem: Datadog Synthetic Monitoring for tight APM/RUM integration, watch the per-test-run cost as frequency and locations grow
- Developer-first, code-native checks: Checkly for teams that want monitoring fully defined in their existing CI/CD pipeline
- Already standardized on Grafana/Prometheus: Grafana Cloud Synthetic Monitoring (k6) fits naturally into that stack
- Enterprise network path diagnostics: Catchpoint for CDN operators and large-scale platforms that need ISP-level visibility
- Simple uptime checks, small team: UptimeRobot or Pingdom to start; migrate to a unified platform as correlation needs grow
Take the Next Step
- Try Synthetic Monitoring: Sign up for OpenObserve Cloud and create your first check in about two minutes
- Read the Synthetic Monitoring release notes for what's available in the beta
- See Synthetic Monitoring vs. RUM to understand how the two disciplines complement each other
- Set up SQL-based alerts on your
synthetics_resultsstream alongside your existing logs and traces - Explore Real User Monitoring and Frontend Performance to pair synthetic checks with real user data
Frequently Asked Questions
About the Author
Simran Kumari

Passionate about observability, AI systems, and cloud-native tools. All in on DevOps and improving the developer experience.
Follow OpenObserve on Google
Add OpenObserve as a preferred source to see more of our articles in Google Search and Top Stories.












