What Is a Status Page? How It Works and How to Run One




Ready to get started?
Try OpenObserve Cloud today for more efficient and performant observability.
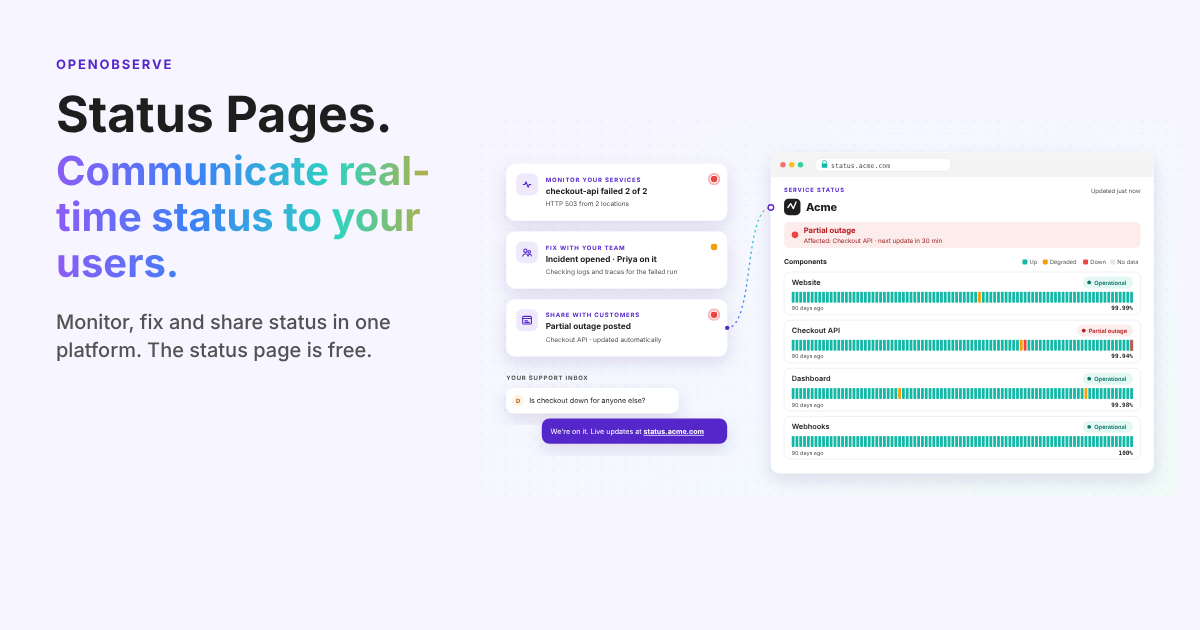
A status page is a public web page that shows whether a service and its components are working, lists active incidents and scheduled maintenance, and keeps a history of past uptime. Customers check it during an outage instead of opening support tickets, so one update reaches everyone at once.
TL;DR
- What it is: a page that answers "is it you or me?" with component status, incidents, maintenance and uptime history.
- Public or private: public for customer-facing products, password-protected for enterprise customers and partners.
- Uptime math: (window − downtime) ÷ window × 100. A 99.9% monthly target allows 43 m 12 s of downtime.
- Best for keeping the page current: OpenObserve, which drives the page directly from the synthetic checks that alert your on-call.
This guide covers what belongs on a status page, when to make one public or private, how the uptime percentage is actually calculated, and how to communicate during an incident.
What goes on a status page?
A useful status page answers "is it you or me?" in a few seconds. Most include:
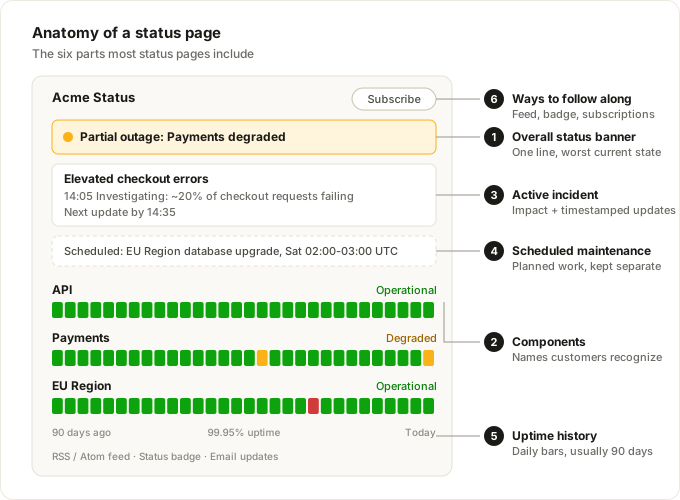
- An overall status banner. One line at the top: operational, degraded, partial outage or major outage.
- Components. The parts of your service customers recognize, such as API, Dashboard, Payments or EU Region, each with its own state.
- Active incidents. A title, impact, affected components and timestamped updates.
- Scheduled maintenance. Planned work announced in advance and kept separate from incidents.
- Uptime history. Daily bars and percentages, usually over 90 days.
- Ways to follow along. A feed, a badge, or subscriptions, so customers don't have to keep refreshing.
Public vs private status pages: which do you need?
Pick by audience. Many teams run one public page for customers and a protected page for partners or internal teams.
| Type | Who sees it | Typical use |
|---|---|---|
| Public | Anyone with the URL | Customer-facing SaaS status, API health |
| Password-protected | People you share the password with | Enterprise customers, partners, internal teams |
| Unlisted | Anyone with the link, but not search engines | Pages you share directly but don't want indexed |
| Draft | Your team only | Building and previewing before launch |
How is status page uptime calculated?
Uptime is the share of a time window during which a component was not down:
uptime % = (window − downtime) ÷ window × 100
A 30-day month has 43,200 minutes, which gives each target a fixed downtime budget:
| Uptime target | Downtime per 30 days | Per year |
|---|---|---|
| 99% | 7 h 12 m | 3 d 15 h 36 m |
| 99.5% | 3 h 36 m | 1 d 19 h 48 m |
| 99.9% | 43 m 12 s | 8 h 45 m 36 s |
| 99.95% | 21 m 36 s | 4 h 22 m 48 s |
| 99.99% | 4 m 19 s | 52 m 34 s |
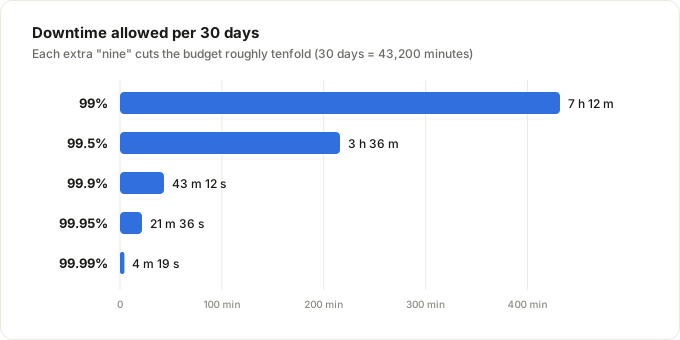
These are the same budgets you work with when you set meaningful SLOs: the uptime on your status page is the public view of the error budget your team tracks internally.
The formula is simple. What counts as downtime is where status pages differ:
- Sample counting vs incident time. Some tools divide passing checks by total checks, a number that can disagree with the incident history shown on the same page. Counting confirmed incident time keeps the two consistent.
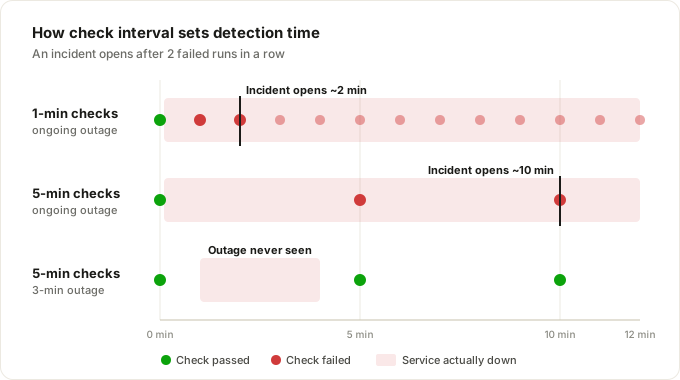
- Check interval sets the resolution. A check every 5 minutes can miss an outage shorter than 5 minutes. If you require 2 failed runs to confirm, it takes up to about 10 minutes to mark an outage; at a 1-minute interval, about 2. The synthetic check schedule settings control this trade-off.
- Maintenance and degraded states. Decide up front whether planned work and slowdowns count, and say so on the page.
- Missing data is not uptime. If a check stops running, the page should show "no data," not "up."
Worked example. Payments API had one confirmed incident of 21 minutes this month. Its 30-day uptime is (43,200 − 21) ÷ 43,200 = 99.951%, just inside a 99.95% target. One more minute and it misses.
Status page vs uptime monitoring: what's the difference?
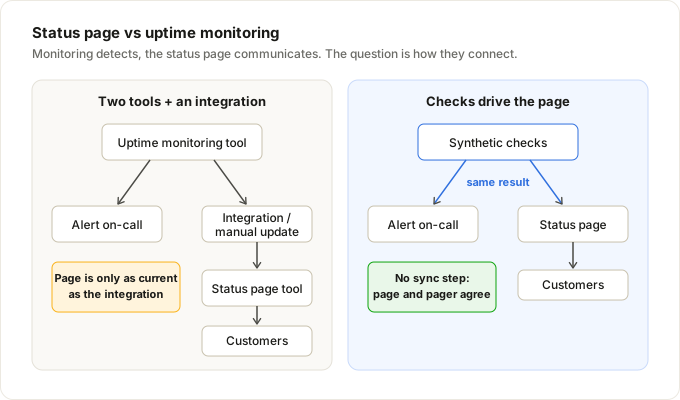
Uptime monitoring detects problems: it runs checks against your endpoints and alerts your team. A status page communicates problems: it tells customers what is affected and when it will be fixed. Most teams run them as two tools joined by an integration, which means the page is only as current as that integration.
The alternative is a status page driven directly by your monitoring checks, so the same result that pages your on-call also updates the page.
If you're still choosing the monitoring side, see what synthetic monitoring is and how it compares to RUM and our comparison of the best synthetic monitoring tools.
Status page best practices during an incident
- Acknowledge fast, even with little to say. "We are investigating elevated errors on Payments" beats silence.
- Name the customer impact, not the cause. "Checkout requests are failing for about 20% of users" is useful. "Redis primary failover" is not.
- Commit to an update cadence. Say when the next update is coming, and post it on time even if nothing has changed.
- Keep internals off the page. Use component names your customers recognize. Hostnames and IPs leak topology.
- Keep the page up when your app is down. A status page that fails with your app is no help. Make sure it doesn't depend on the system it reports on.
- Close the loop. Post a resolution note, and link the postmortem for major incidents.
Clear communication buys your team time, but customers ultimately judge you on how fast the fix lands. For the response side, see our guide to mean time to resolution (MTTR).
Status pages in OpenObserve
OpenObserve builds status pages directly on its synthetic checks. You map HTTP, TCP, TLS or SSH checks to public components, and incidents open after consecutive failures and close after consecutive passes. Uptime is calculated from confirmed incident time, and public visitors read a cached snapshot rather than querying your data. The page itself is free.
To create a page, map components and publish it, follow the Status Pages docs. When a check fails, you investigate in the same place: every check result is a stream, so the logs and traces behind a failed run are a query away, and incident management groups related alerts for your on-call.
Status pages sit alongside the rest of the platform. OpenObserve is an open-source (AGPL-3.0), OpenTelemetry-native observability platform that also covers:
- Telemetry: logs, metrics, traces (service graph, service catalog) and profiles, queried with SQL and PromQL
- Frontend: RUM, session replay and error tracking, plus browser and protocol synthetic checks
- AI: AI Assistant, SRE Agent for AI root cause analysis, MCP server, LLM observability and evaluations, anomaly detection, log patterns and insights
- Reliability: scheduled, real-time, composite and anomaly alerts, incident management, and SLOs with error budgets and burn rate
- Dashboards and reports, and pipelines with VRL functions, enrichment tables and downsampling
- Storage and cost: Parquet on object storage, bring your own bucket, extended retention, and ingest-based pricing with no per-host or per-user fees
- Security and compliance: SSO, RBAC, multi-tenancy, sensitive data redaction, audit trail, cipher keys and federated search; SOC 2 Type II, ISO 27001, and GDPR via the EU region
See how it works: components, auto-incidents, uptime, notices and pricing on the Status Pages overview.
Take the next step
- Read the Synthetics docs to set up the checks that drive your page, including private locations for internal endpoints.
- Explore Synthetic Monitoring, Incidents and SLOs in OpenObserve.
- Start a free OpenObserve Cloud trial and publish your first status page.
- Related reading: SLO-based alerting in OpenObserve.
Frequently Asked Questions
About the Author
Simran Kumari

Passionate about observability, AI systems, and cloud-native tools. All in on DevOps and improving the developer experience.
Follow OpenObserve on Google
Add OpenObserve as a preferred source to see more of our articles in Google Search and Top Stories.