How Many Nines Do You Actually Need?




Ready to get started?
Try OpenObserve Cloud today for more efficient and performant observability.
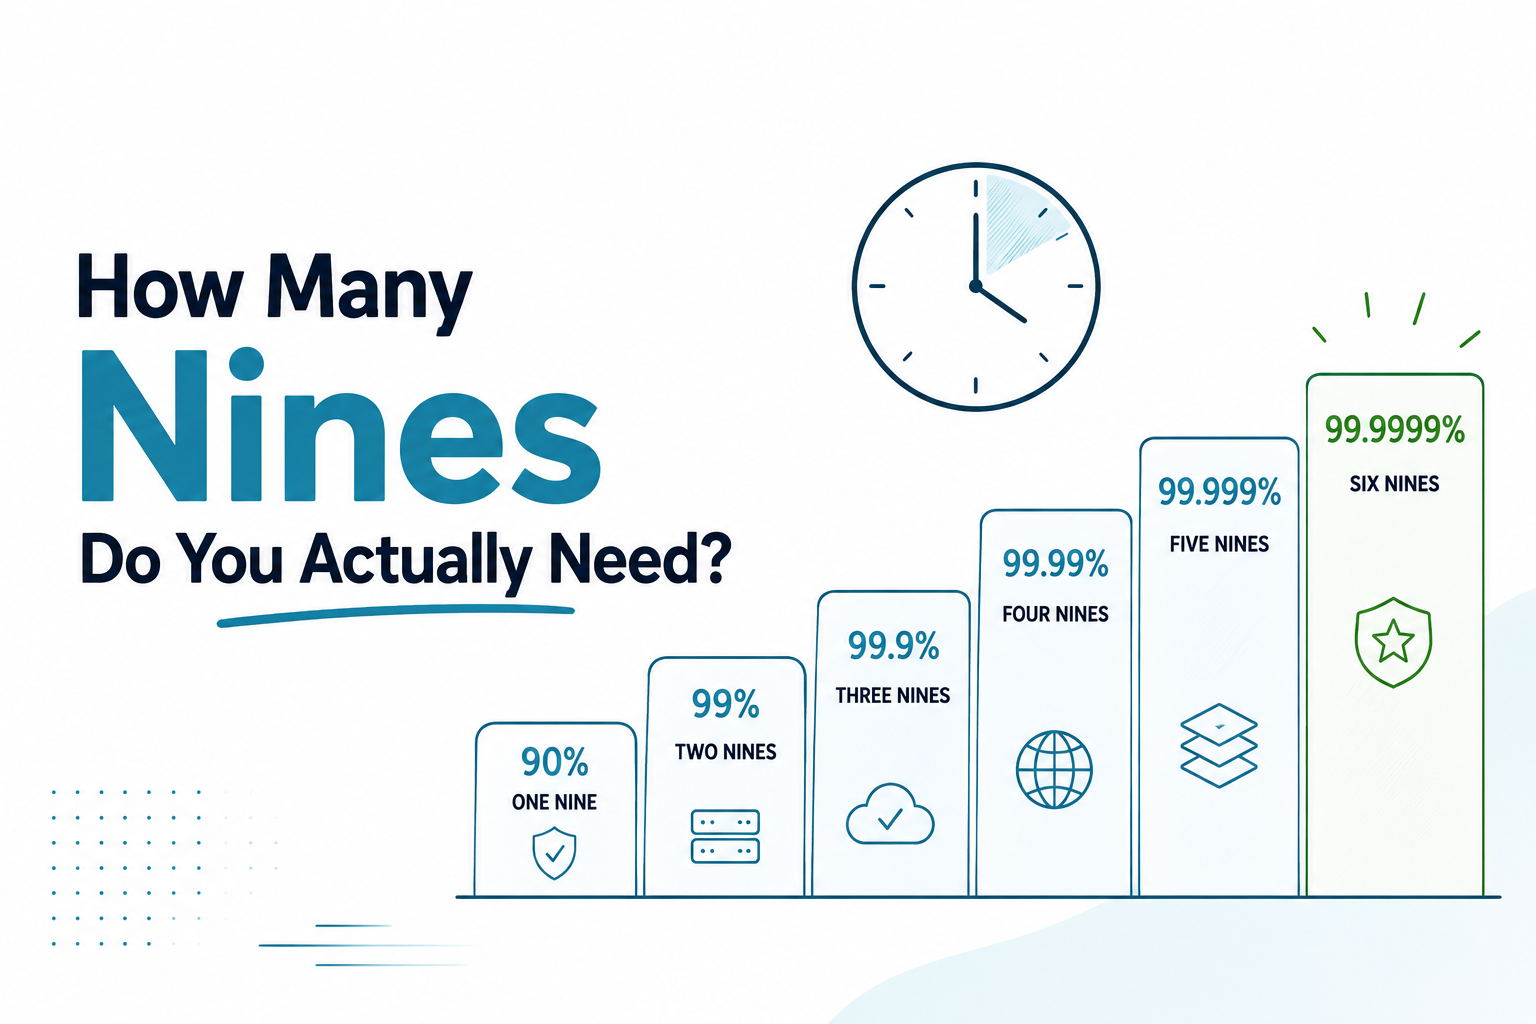
"Five nines" gets thrown around in architecture reviews like it's the default answer, but 99.999% availability allows just 5.26 minutes of downtime a year, and building for it costs roughly an order of magnitude more than the nine below it. Most teams don't need it, and committing to it without the infrastructure and headcount to back it up just means missing your own target every quarter.
TL;DR:
- Each nine of availability cuts your allowed downtime by roughly 10x: 99% allows 3.65 days a year, 99.9% allows 8.76 hours, 99.99% allows 52.6 minutes, 99.999% allows 5.26 minutes.
- Each additional nine costs roughly an order of magnitude more to build, as a rule of thumb, not a precise multiplier, because the failure modes left to eliminate get progressively rarer.
- Most consumer SaaS products should target 99.9% to 99.99%. Five nines is for infrastructure where outages carry direct financial or safety consequences.
- Picking a target you can't actually hit is worse than picking a lower one you hit consistently: a missed SLO burns trust faster than an honest, modest one.
What Does a "Nine" Actually Mean?
Availability is the percentage of time (or requests) a system is expected to be up and working correctly, expressed as a percentage that gets more nines as it approaches 100%. "Three nines" means 99.9% availability; "five nines" means 99.999%. The jump from one nine to the next looks small on paper (99.9% to 99.99% is a 0.09 percentage-point difference) but represents a 10x reduction in allowed downtime, because you're shrinking the remaining sliver, not the whole number.
How Much Downtime Does Each Nine Actually Allow?
This is the table worth pinning above your desk. It converts each availability target into actual allowed downtime, per year, month, and week:
| Availability | Nines | Downtime / year | Downtime / month | Downtime / week |
|---|---|---|---|---|
| 90% | One nine | 36.5 days | 3 days | 16.8 hours |
| 99% | Two nines | 3.65 days | 7.2 hours | 1.68 hours |
| 99.9% | Three nines | 8.76 hours | 43.2 minutes | 10.1 minutes |
| 99.99% | Four nines | 52.6 minutes | 4.32 minutes | 1.01 minutes |
| 99.999% | Five nines | 5.26 minutes | 25.9 seconds | 6.05 seconds |
| 99.9999% | Six nines | 31.5 seconds | 2.59 seconds | 0.605 seconds |
A few things jump out once the numbers are in front of you:
- The gap between "three nines" and "four nines" sounds trivial as percentages, but it's the difference between an 8-hour outage budget and a 52-minute one, per year.
- At five nines, your entire annual downtime budget is smaller than a single well-handled incident response call. You can burn the whole year's budget on one bad deploy that takes 6 minutes to roll back.
- At six nines, the allowed downtime per week is measured in fractions of a second. This tier exists for telecom-grade infrastructure, not typical web services.
Why Each Nine Costs Roughly 10x More
The commonly cited engineering rule of thumb is that each additional nine costs about an order of magnitude more than the one before it. Treat that as a directional guide, not a formula: real cost depends heavily on your existing architecture and how far you already are from the next threshold. But the underlying reason it holds directionally is consistent: the failure modes you still have to eliminate get progressively rarer, more correlated, and harder to reproduce in testing.
Roughly, here's what tends to change at each step, and what it typically takes to get there:
| Jump | Relative build cost | What it typically takes | Failure modes you're closing off |
|---|---|---|---|
| 99% → 99.9% | Baseline (1x) | Health checks, automatic restarts, a load balancer that stops sending traffic to a dead instance | Single-instance crashes, obvious hardware failures |
| 99.9% → 99.99% | ~10x | Multi-AZ deployment, graceful degradation under load, load shedding for non-critical paths, a functioning on-call rotation | Zone-level outages, overload cascades, slow deploys with no rollback path |
| 99.99% → 99.999% | ~100x | Multi-region active-active architecture, chaos engineering, a dedicated reliability team | Correlated failures, retry storms, dependency-on-a-dependency problems |
| 99.999% → 99.9999% | ~1000x | Hardware-level redundancy, regulatory-grade operational processes (telecom, core network) | Failure modes rare enough that most software companies never see one in production |
Treat the "relative build cost" column as an order-of-magnitude guide, not a priced quote; it's the direction the commonly cited 10x-per-nine rule of thumb points, not a formula, since your actual cost depends on existing architecture and how far you already are from the next threshold.
Each step isn't just "more of the same effort." It's a different category of problem: the outages that get you from 99.9% to 99.99% are usually single points of failure you can find and fix. The outages standing between 99.99% and 99.999% are often correlated failures, cascading retries, or dependency-on-a-dependency problems that only show up under specific, rare conditions.
Picking a Target That Fits What You Actually Run
The honest framework is to work backward from consequence, not forward from ambition:
- Internal tools, admin dashboards, batch pipelines: 99% to 99.5% is usually fine. A few hours of downtime a month rarely has real business impact if there's no customer-facing dependency.
- Consumer SaaS, B2B web apps: 99.9% to 99.99% is the realistic band for most products. It's achievable with standard cloud redundancy and a real on-call process, without requiring a dedicated SRE org.
- Payments, healthcare, safety infrastructure: 99.99% to 99.999% is where the extra cost is usually justified, because the cost of an outage (financial, legal, or safety) is asymmetric and large compared to the engineering cost of preventing it.
- Telecom, core network, emergency services: 99.999% and above, because regulation or physical safety requires it, not because it's aspirational.
If you're not sure where you land, our guide to setting meaningful SLOs walks through defining the SLI your target should actually be measured against, and error budgets explained covers what to do once you've picked a number: how to turn it into an error budget that tells you when to freeze releases and when it's safe to ship.
The Trap: Committing to a Nine You Can't Actually Hit
A target you consistently miss is worse than a lower target you consistently hit. Committing to 99.99% without multi-AZ failover, without an on-call rotation that can respond within the 52-minute annual budget, and without the testing discipline to catch regressions before they ship, doesn't get you 99.99% reliability. It gets you a broken promise every quarter, reported against a number nobody actually believes anymore.
The fix isn't more ambition, it's measuring what you're actually delivering, setting the target to match, and only raising it once the infrastructure underneath it has actually changed.
Tracking Your Nines
Whatever target you land on, you can only defend it with data: uptime checks alone tell you a request failed, not why, and "why" is what actually gets an incident resolved inside your downtime budget instead of eating into it. OpenObserve is an open source (AGPL-3.0) observability platform that unifies logs, metrics, and traces so you can go from an availability dip straight to the failing request, the service it touched, and the log line that explains it, without switching tools mid-incident.
Conclusion
Five nines sounds impressive in a pitch deck and is the wrong target for most teams building it. The math is unambiguous: each nine buys roughly 10x less downtime and costs roughly 10x more to build, and for most consumer products the honest, defensible target sits at three to four nines, not five. Pick the number that matches what an outage actually costs your business, build the architecture that gets you there, and measure it honestly enough to know when you've actually hit it.
Frequently Asked Questions
About the Author
Simran Kumari

Passionate about observability, AI systems, and cloud-native tools. All in on DevOps and improving the developer experience.
Follow OpenObserve on Google
Add OpenObserve as a preferred source to see more of our articles in Google Search and Top Stories.












