Prometheus Alternatives for Metrics at Scale (2026)




Ready to get started?
Try OpenObserve Cloud today for more efficient and performant observability.
Prometheus is the de facto standard for Kubernetes-native metrics collection: a pull-based model, a purpose-built time-series database, and PromQL as the query language teams have standardized on for years. For a single cluster with a modest number of series, it works well out of the box.
The trouble starts at scale. Prometheus's local TSDB was designed for a single node, retention is bounded by local disk, there's no built-in high availability, and high-cardinality labels (user IDs, request IDs, pod names in a churning Kubernetes cluster) can push a Prometheus instance to its knees. Teams typically respond by bolting on Thanos, Cortex, or Mimir for long-term storage and HA, which solves the scaling problem but multiplies the number of components you have to run and upgrade.
In this guide, we'll compare ten Prometheus alternatives and scaling companions, from unified observability platforms to metrics-only, drop-in replacements, so you can decide what actually fits your scale and budget.
TL;DR
OpenObserve is the best Prometheus alternative in 2026 for teams that have outgrown single-node Prometheus. It ingests existing Prometheus metrics via remote write with no PromQL rewrite required, handles high-cardinality data without extra tuning, and unifies metrics with logs and traces in one platform, removing the need to separately run Thanos, Cortex, or Mimir just for long-term storage.
- Best overall Prometheus alternative: OpenObserve: remote-write compatible, high-cardinality friendly, unifies metrics with logs and traces
- Best for cost at scale: OpenObserve: object-storage-backed retention with no per-metric or per-host billing
- Best for high-cardinality metrics specifically: OpenObserve: handles high-cardinality dimensions that overload Prometheus's local TSDB
- Best for eliminating extra infrastructure: OpenObserve: replaces the need for Thanos, Cortex, or Mimir as a separate long-term storage layer
- Best for compliance and data sovereignty: OpenObserve: self-hosted, full data ownership, no forced SaaS dependency
What "Prometheus Alternative" Means in This Guide
None of the tools below replace metric collection itself. Scraping targets or receiving pushed metrics still happens through Prometheus (often running in agent mode and forwarding via remote write) or the OpenTelemetry Collector's Prometheus receiver. What OpenObserve and the other options in this guide actually replace is what happens after collection: the storage engine, the query layer, long-term retention, and high availability, the parts of vanilla Prometheus that break down at scale.
So when this guide says OpenObserve removes the need to run Thanos, Cortex, or Mimir, that's specifically about long-term storage and query, not about how metrics get collected in the first place. The collection path into OpenObserve stays the same: Prometheus remote write or the OpenTelemetry Collector.
Why Teams Are Seeking Prometheus Alternatives
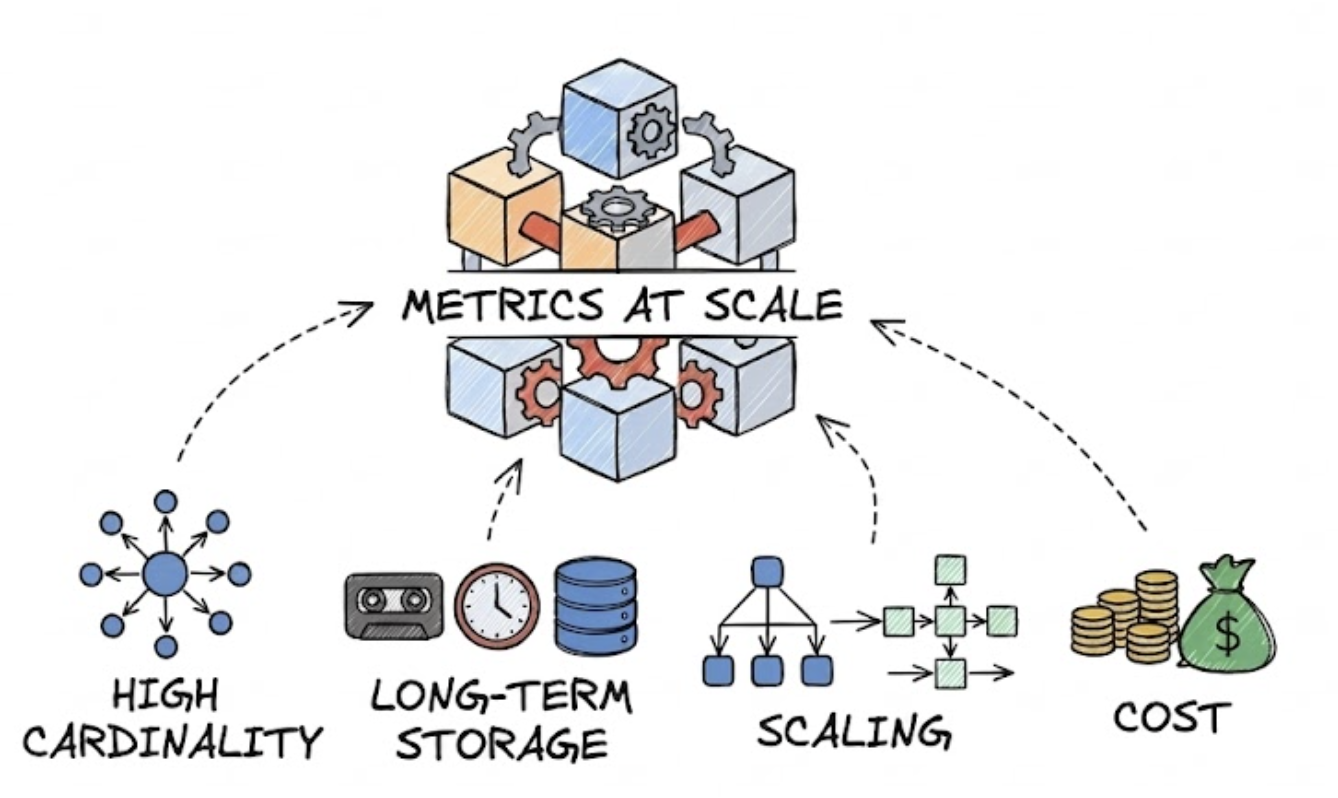
- High-Cardinality Limits: Labels like user ID, request ID, or pod name in a churning Kubernetes cluster can explode Prometheus's series count, degrading query performance and blowing up memory usage.
- Limited Long-Term Retention: Prometheus stores data on local disk by design. Long retention windows require significant local storage or an external long-term storage layer.
- No Built-In High Availability: A single Prometheus instance is a single point of failure. HA requires running duplicate instances plus a deduplication layer.
- Operational Complexity of Scaling: Getting HA, long-term storage, and global querying out of vanilla Prometheus means running Thanos, Cortex, or Mimir on top, each with its own components to deploy and maintain.
- Metrics-Only Scope: Prometheus only handles metrics. Teams still need separate tools for logs and traces, and correlating across all three means stitching together different systems.
Why This Guide Exists
As metrics volume grows in 2026, more teams are evaluating what comes after single-node Prometheus, whether that's a scaling companion or a full replacement:
Evidence from Real Deployments:
- Operational reduction: Unified alternatives eliminate the need to run Thanos/Cortex/Mimir just for retention and HA
- Query continuity: PromQL-compatible options avoid a rewrite of existing dashboards and alert rules
- High-cardinality support: Modern alternatives handle cardinality growth that degrades vanilla Prometheus
- Cost efficiency: Object-storage-backed platforms often cut metrics storage costs significantly versus running large local TSDBs
What to Look for in a Prometheus Alternative
When evaluating Prometheus alternatives for metrics at scale, assess these critical dimensions:
| Criterion | Why It Matters | What to Evaluate | How to Test |
|---|---|---|---|
| PromQL / Remote Write Compatibility | Determines migration effort | Support for Prometheus remote write ingestion and PromQL query syntax | Point an existing exporter at the new backend without changing dashboards |
| High-Cardinality Handling | Modern Kubernetes and microservices workloads | Behavior with millions of unique label combinations | Load test with high-cardinality labels (user ID, pod name, request ID) |
| Long-Term Storage | Retention beyond what local disk allows | Object storage support, retention cost at 90/180/365 days | Model storage cost at current volume × retention window |
| High Availability | Avoiding a single point of failure | Built-in replication/dedup vs requiring extra components | Simulate node failure and confirm no query gaps |
| Multi-Tenancy | Shared platform across teams | Tenant isolation, per-tenant quotas and access control | Test isolation between two simulated tenants |
| Unified Telemetry | Correlating metrics with logs and traces | Native support for logs/traces alongside metrics | Correlate a metric spike with logs and traces for the same service |
| Query Performance at Scale | Investigation speed during incidents | Latency on aggregation queries over large series counts | Benchmark dashboard queries against production-scale data |
| Operational Complexity | Team bandwidth for running the stack | Number of components to deploy, upgrade, and monitor | Compare time spent on maintenance vs actual analysis |
| Cost Structure | Budget predictability at scale | Per-sample, per-host, or storage-based pricing | Model cost at 2x, 5x, and 10x current metrics volume |
| Migration Ease | Time and risk to adopt | Remote write support, dashboard/alert portability | Pilot migration with one non-critical service |
Top 10 Prometheus Alternatives: Comparison & Use Cases
Jump to comparison table for Prometheus alternatives comparison and use cases.
1. OpenObserve
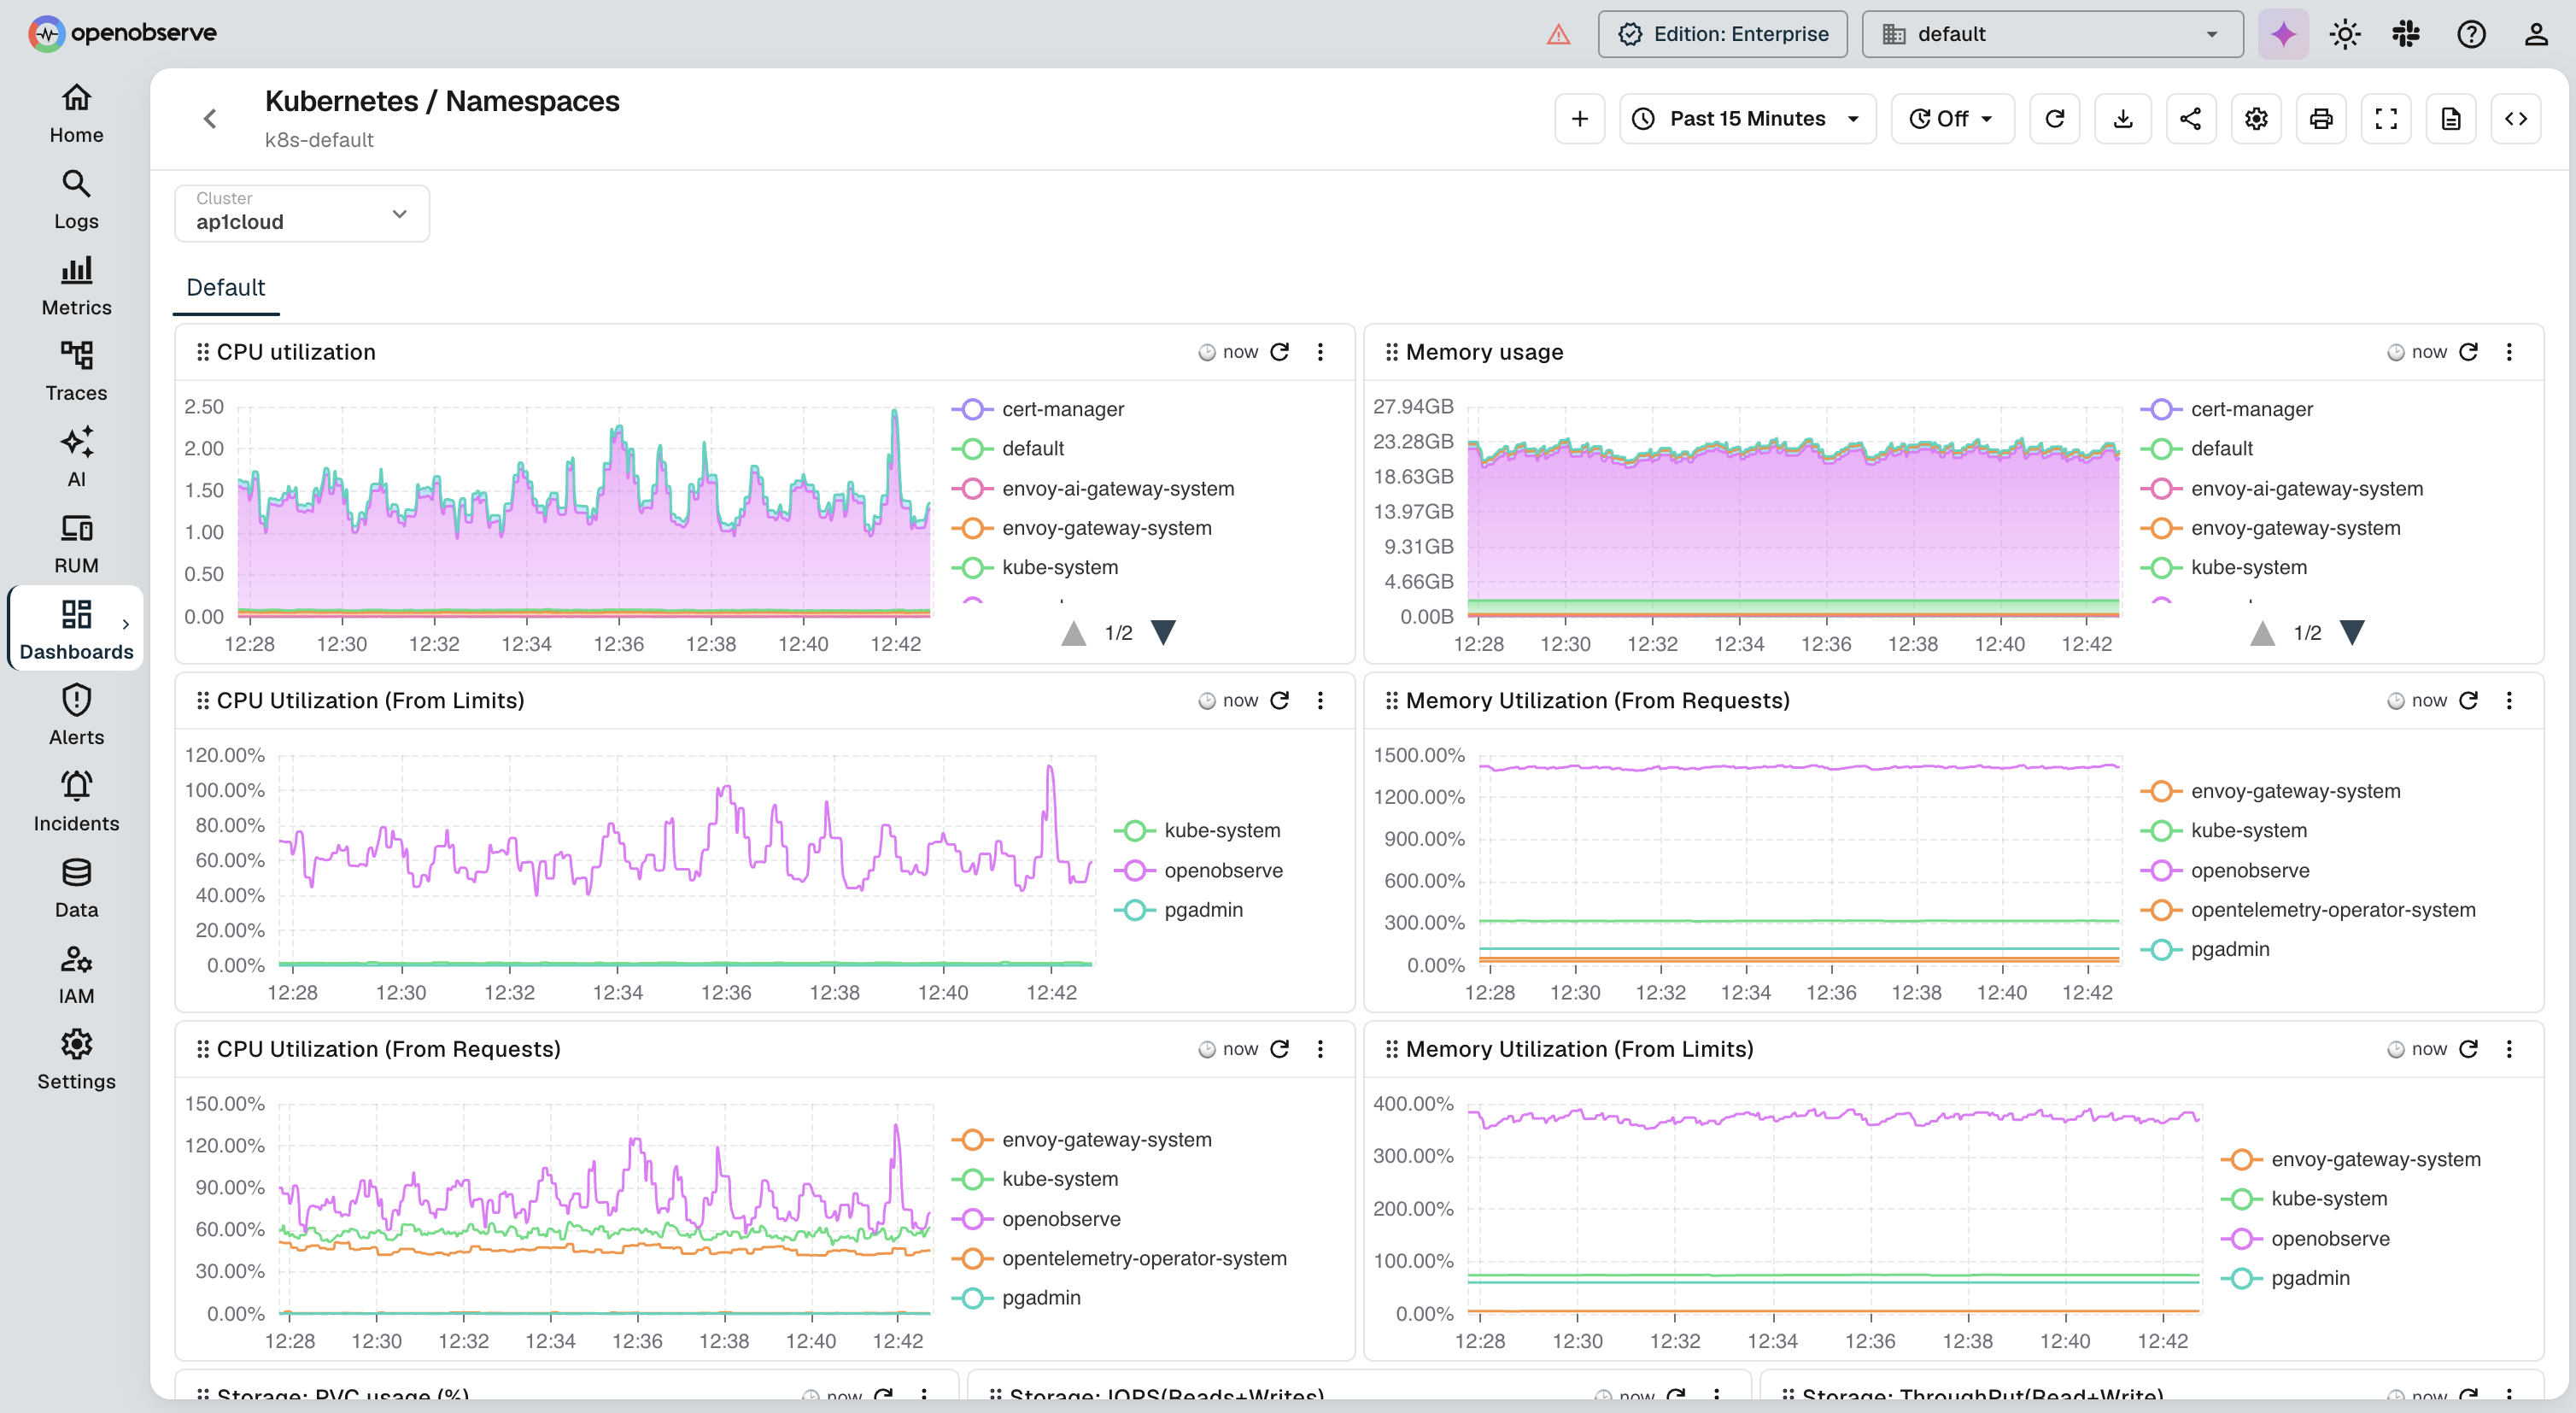
OpenObserve is the #1 unified observability platform for teams that need metrics at scale without also running Thanos, Cortex, or Mimir on top of Prometheus. It ingests metrics via Prometheus remote write, handles high-cardinality data natively, and stores everything on object storage with aggressive columnar compression, alongside logs and traces in the same platform.
OpenObserve Pros:
- Prometheus Remote Write Compatible: Existing exporters and Prometheus instances can ship metrics without any re-instrumentation
- PromQL and SQL Support: Existing PromQL queries, dashboards, and alert rules keep working, with SQL available for analytical queries PromQL can't express
- No Separate Long-Term Storage Layer Needed: Object-storage-backed retention is built in, replacing the need for Thanos, Cortex, or Mimir
- High-Cardinality Friendly: Handles label churn and high-cardinality dimensions that degrade vanilla Prometheus
- Unified Platform: Metrics, logs, traces, and RUM in one tool, so a metric spike can be correlated with logs and traces without switching systems
- Dramatically Lower Storage Costs: Parquet columnar format on object storage achieves approximately 140x lower storage costs in typical log and metrics workloads compared to Elasticsearch-based stacks; actual results vary based on data entropy and cardinality
- Single Binary Deployment: Get running in under 2 minutes with minimal infrastructure requirements
- Self-Hosted or Cloud: Full control over data residency and retention with flexible deployment options
OpenObserve Cons:
- Smaller integration marketplace compared to the Prometheus ecosystem's exporters and mixins
- Newer ecosystem with community integrations still expanding
Integration / Mitigation:
- Accepts Prometheus remote write directly, no exporter changes required
- Compatible with the OpenTelemetry Collector's Prometheus receiver for a unified ingestion path
- Can run alongside existing Prometheus and Grafana during a phased migration
For a comprehensive technical comparison, explore the detailed OpenObserve vs Grafana comparison, which covers metrics architecture and query capabilities in depth.
2. VictoriaMetrics
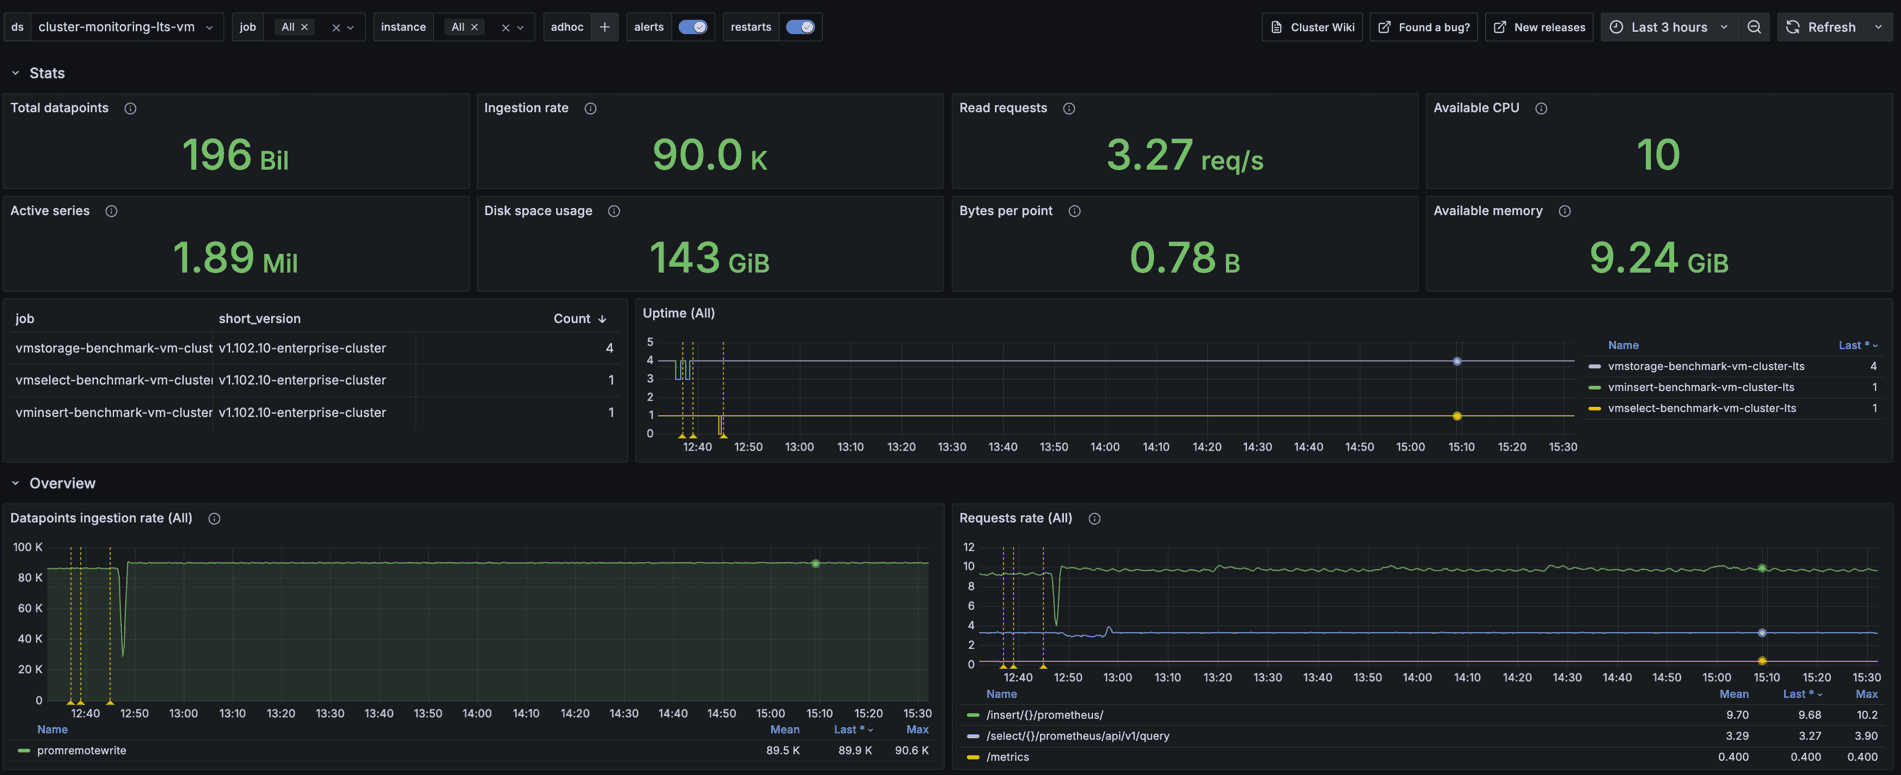
VictoriaMetrics is a fast, cost-effective time-series database built as a drop-in Prometheus replacement, popular with teams that want a metrics-only upgrade without touching their query layer.
VictoriaMetrics Pros:
- Drop-In Prometheus Replacement: Fully PromQL compatible, works with existing exporters and Grafana dashboards unchanged
- Superior Performance: Faster queries and better compression than vanilla Prometheus
- Lower Resource Usage: Significantly reduced CPU and memory footprint at the same data volume
- High-Cardinality Friendly: Handles high-cardinality metrics considerably better than Prometheus
- Simple Operations: Single-binary and cluster deployment options available
VictoriaMetrics Cons:
- Metrics only; doesn't cover logs or traces, so you'll still need separate tools for full observability
- Still requires Grafana or another tool for visualization
- Some advanced features (downsampling, multi-tenancy at scale) require the enterprise edition
Integration / Mitigation:
- Direct replacement for Prometheus's storage layer with no PromQL rewrite
- Compatible with existing dashboards and alerting rules
- Can run alongside Prometheus during migration for validation
3. Thanos
Thanos extends Prometheus with long-term storage on object storage, global querying across multiple Prometheus instances, and deduplication for high availability, without replacing Prometheus itself.
Thanos Pros:
- CNCF Graduated Project: Mature, widely adopted for scaling Prometheus in production
- Global Query View: Query across many Prometheus instances and clusters as if they were one
- Unlimited Retention: Object storage backing removes the local-disk retention ceiling
- High Availability: Deduplication across redundant Prometheus instances eliminates single points of failure
- PromQL Compatible: No query language change since it sits directly on top of Prometheus
Thanos Cons:
- Adds several new components (Sidecar, Store Gateway, Compactor, Querier) to deploy and operate
- Metrics only; logs and traces still require separate tooling
- Requires meaningful operational expertise to run reliably at scale
Integration / Mitigation:
- Runs as a sidecar to existing Prometheus instances, no re-instrumentation needed
- Grafana remains fully compatible for visualization
- Often the first step teams take before considering a full platform replacement
4. Grafana Mimir
Grafana Mimir is a horizontally scalable, multi-tenant, long-term storage system for Prometheus metrics, positioned as the successor to Cortex within the Grafana ecosystem.
Grafana Mimir Pros:
- Massive Scale: Built to handle billions of active series across large organizations
- Multi-Tenancy: First-class tenant isolation for platform teams serving multiple internal teams
- PromQL Compatible: Existing Prometheus queries and Grafana dashboards work unchanged
- Object Storage Backed: Cost-efficient long-term retention on S3-compatible storage
- Active Development: Backed by Grafana Labs with regular releases and strong community support
Grafana Mimir Cons:
- Complex to operate at full scale; many microservices to deploy and tune
- Metrics only; still requires Loki and Tempo (or alternatives) for logs and traces
- Steeper learning curve than a single-binary alternative
Integration / Mitigation:
- Ingests via Prometheus remote write, keeping existing scrape configs intact
- Pairs with Grafana for visualization exactly as before
- Can be adopted incrementally, starting with a subset of tenants or teams
5. Cortex
Cortex is a horizontally scalable, multi-tenant Prometheus-as-a-service project, one of the original inspirations for Mimir and still run in production by several large organizations.
Cortex Pros:
- Proven at Scale: Used in production by large-scale SaaS providers for years
- Multi-Tenancy: Built-in tenant isolation for shared metrics platforms
- PromQL Compatible: Drop-in for teams already standardized on PromQL
- Object Storage Support: Long-term retention without local-disk limits
Cortex Cons:
- Development activity has slowed as much of the community has moved toward Mimir
- Significant operational complexity with many independently scaled components
- Metrics only; no native logs or traces support
Integration / Mitigation:
- Same remote-write ingestion path as Thanos and Mimir
- Existing Grafana dashboards and alerts require no changes
- Teams currently on Cortex should evaluate Mimir as a more actively maintained path forward
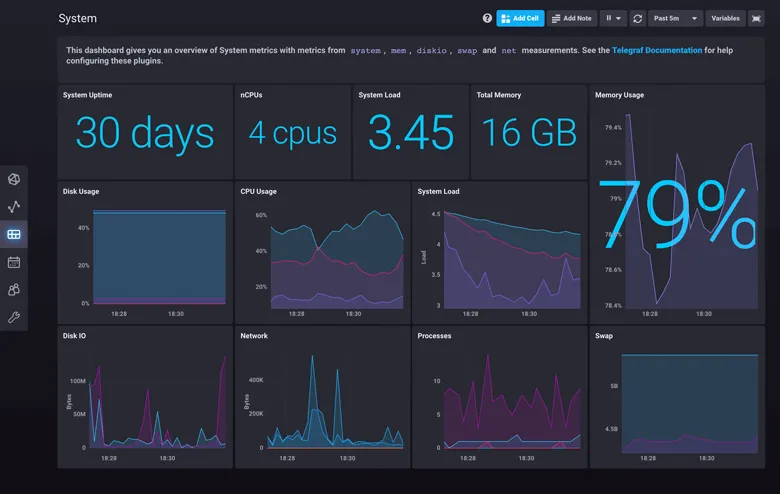
6. InfluxDB
InfluxDB is a general-purpose time-series database that predates the Prometheus ecosystem, widely used for IoT, sensor data, and metrics workloads that don't fit Prometheus's pull-based model.
InfluxDB Pros:
- Push-Based Ingestion: A natural fit for IoT and event-driven workloads that don't suit Prometheus's scrape model
- Flexible Query Options: Supports both InfluxQL and Flux for different query styles
- Strong Ecosystem for Time-Series Beyond Metrics: Popular for sensor data, financial data, and other non-Prometheus time series
- Managed Cloud Option: InfluxDB Cloud removes the operational burden of self-hosting
InfluxDB Cons:
- Not PromQL compatible; migrating existing Prometheus dashboards and alerts requires a rewrite
- Different data model than Prometheus, so exporters and instrumentation need adaptation
- Enterprise features (clustering, high availability) require a commercial license
Integration / Mitigation:
- Telegraf can bridge Prometheus-format metrics into InfluxDB
- Best suited for teams building new instrumentation rather than migrating existing Prometheus setups
- Often used alongside Grafana, which supports InfluxDB as a data source
7. TimescaleDB
TimescaleDB is a time-series extension for PostgreSQL, appealing to teams that want metrics storage on infrastructure they already run and query with standard SQL.
TimescaleDB Pros:
- SQL-Native: Query metrics with standard SQL instead of learning PromQL
- Runs on PostgreSQL: Reuses existing Postgres operational knowledge and tooling
- Good for Mixed Workloads: Useful when metrics need to be joined with relational business data
- Mature Compression: Strong native compression for time-series data
TimescaleDB Cons:
- Not PromQL compatible; existing Prometheus alert rules and dashboards need to be rebuilt
- Not purpose-built for the pull-based, label-heavy Prometheus data model
- Scaling to Prometheus-level metrics volume requires careful schema and partitioning design
Integration / Mitigation:
- Prometheus's
remote_writecan be adapted into TimescaleDB via community adapters - Best fit when metrics need to live alongside existing relational data
- Grafana supports TimescaleDB as a native data source
8. M3DB
M3DB is Uber's distributed time-series database, built to handle extremely large-scale metrics workloads with strong multi-tenancy and downsampling support.
M3DB Pros:
- Built for Massive Scale: Proven at some of the largest metrics volumes in the industry
- Multi-Tenant by Design: Strong isolation for large platform teams
- PromQL Compatible: Supports Prometheus's query layer via M3 Query
- Configurable Downsampling: Fine-grained control over retention and resolution trade-offs
M3DB Cons:
- Significant operational complexity; designed for teams with dedicated platform engineering resources
- Smaller community and less documentation than Thanos, Cortex, or Mimir
- Overkill for teams below hyperscale metrics volumes
Integration / Mitigation:
- Ingests via Prometheus remote write
- Best suited for organizations already operating at extreme scale
- Typically adopted by dedicated observability platform teams, not general application teams
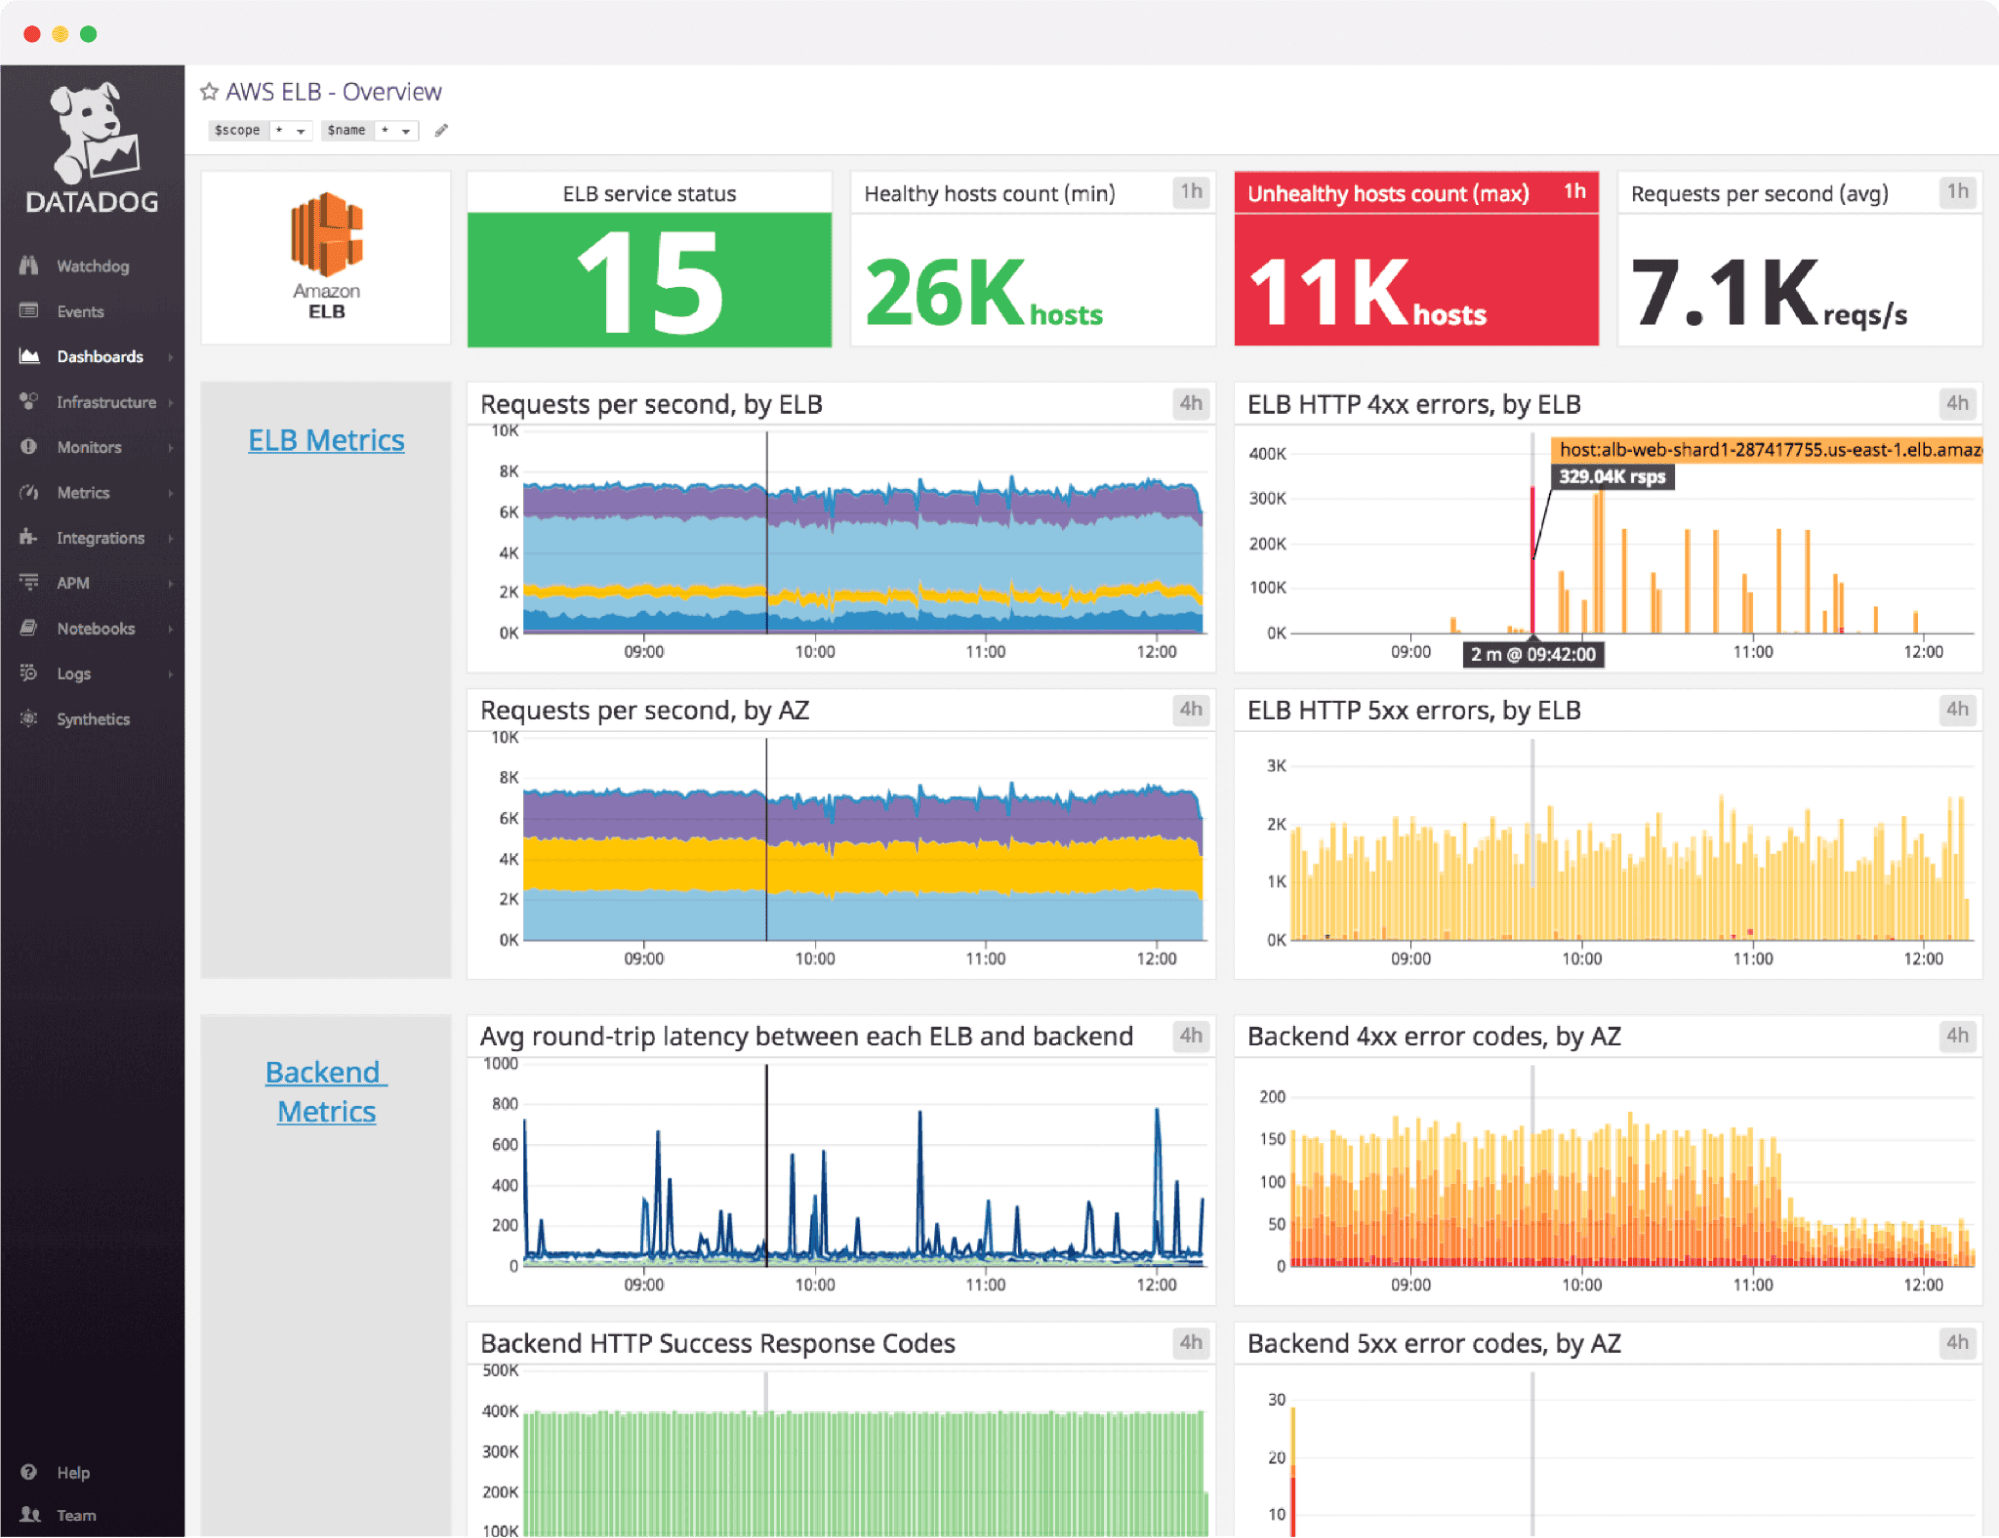
9. Datadog
Datadog is a fully managed SaaS platform that replaces Prometheus and its scaling companions entirely, trading operational ownership for a fully hosted metrics, logs, and traces experience.
Datadog Pros:
- Zero Operational Overhead: No Prometheus, Thanos, Cortex, or Mimir to run and upgrade
- Unified Platform: Metrics, logs, traces, RUM, and synthetics in one integrated solution
- 700+ Integrations: Broad out-of-the-box support across cloud providers and technologies
- Custom Metrics and Dashboards: Rich dashboarding and alerting without self-managed infrastructure
Datadog Cons:
- Expensive at scale, particularly with custom metrics and high-cardinality tags
- Vendor lock-in with proprietary agents and pricing models
- No self-hosted option for teams with data sovereignty requirements
Integration / Mitigation:
- OpenTelemetry support allows metrics to be routed through a vendor-neutral pipeline
- Prometheus metrics can be forwarded to Datadog via the OpenTelemetry Collector
- Consider a phased migration starting with a subset of services
See our top Datadog alternatives guide for a detailed cost and feature comparison.
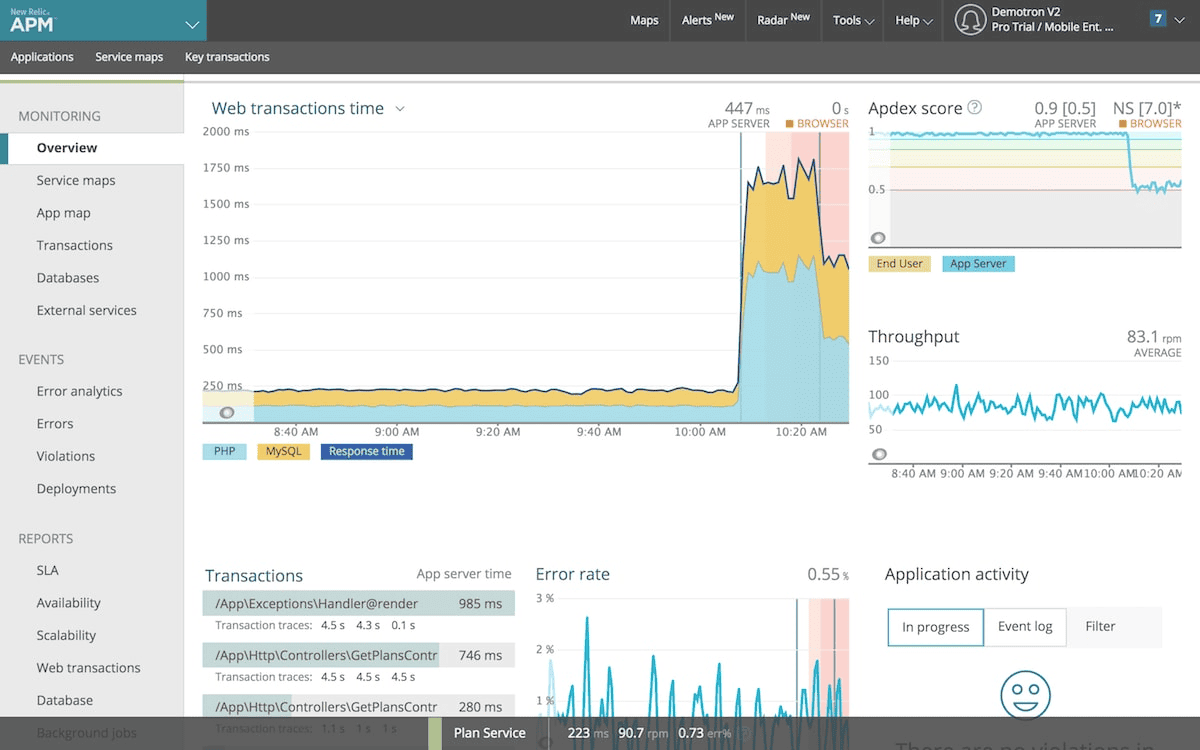
10. New Relic
New Relic is a SaaS observability platform with strong APM capabilities and a generous free tier, appealing to teams that want to move off self-managed Prometheus without a large upfront commitment.
New Relic Pros:
- Free Tier Available: 100 GB free per month makes evaluation and small workloads accessible
- Strong OpenTelemetry Support: Metrics can be ingested via OTLP with minimal setup
- Unified Platform: Metrics, logs, traces, and RUM in a single product
- AI-Powered Insights: Built-in anomaly detection on top of metrics data
New Relic Cons:
- Costs can grow quickly beyond the free tier at high metrics volume
- Less control over data residency than self-hosted alternatives
- Proprietary platform with some vendor lock-in
Integration / Mitigation:
- Prometheus remote write and OpenTelemetry ingestion both supported
- Suitable for teams wanting a managed option without operating Thanos, Cortex, or Mimir
- Existing Grafana dashboards need to be recreated in New Relic's UI
Comparison Table: Prometheus Alternatives 2026
| Tool | Deployment | PromQL / Remote Write | Long-Term Storage | Logs + Traces | Why Teams Choose It Over Prometheus | Migration Ease |
|---|---|---|---|---|---|---|
| OpenObserve | Self-hosted / Cloud | Yes, PromQL + remote write | Yes, built-in | Yes | Unified platform, no separate Thanos/Cortex/Mimir needed | Very Easy (remote write) |
| VictoriaMetrics | Self-hosted / Cloud | Yes, full PromQL | Yes, built-in | No | Drop-in replacement, lower resource usage | Very Easy (drop-in) |
| Thanos | Self-hosted | Yes, full PromQL | Yes, object storage | No | Global query view across many Prometheus instances | Easy (sidecar) |
| Grafana Mimir | Self-hosted / Cloud | Yes, full PromQL | Yes, object storage | No | Massive scale, multi-tenant | Easy (remote write) |
| Cortex | Self-hosted | Yes, full PromQL | Yes, object storage | No | Proven multi-tenancy, though development has slowed | Easy (remote write) |
| InfluxDB | Self-hosted / Cloud | No | Yes, built-in | Partial | Push-based model for IoT and non-Prometheus workloads | Difficult (data model change) |
| TimescaleDB | Self-hosted / Cloud | No | Yes, built-in | No | SQL-native querying on existing Postgres infrastructure | Difficult (rewrite needed) |
| M3DB | Self-hosted | Yes, via M3 Query | Yes, built-in | No | Hyperscale metrics volumes | Moderate (remote write) |
| Datadog | SaaS | Partial, via OTel | Yes, managed | Yes | Zero operational overhead, broad integrations | Easy (agent-based) |
| New Relic | SaaS | Partial, via OTel | Yes, managed | Yes | Free tier, managed alternative to self-hosting | Easy (OTel support) |
How to Choose the Right Prometheus Alternative
Selecting the right Prometheus alternative depends on what's actually breaking at your current scale.
1. What's Actually Failing
If the problem is purely long-term storage and high availability, Thanos, Cortex, or Grafana Mimir solve that directly while keeping Prometheus itself in place. If the problem is high-cardinality metrics degrading query performance, OpenObserve or VictoriaMetrics address that more fundamentally. If the real problem is running four separate telemetry systems, a unified platform like OpenObserve removes the multi-tool overhead entirely.
2. Budget Constraints
For teams with tight budgets, VictoriaMetrics and OpenObserve provide the most value: both are open source with efficient storage. For moderate budgets wanting less operational burden, OpenObserve Cloud or New Relic's free tier are attractive. Enterprise budgets with hyperscale needs may justify M3DB or Datadog.
3. Query Language Preference
If your team is heavily invested in PromQL and existing Grafana dashboards, VictoriaMetrics, Thanos, Mimir, Cortex, and OpenObserve all preserve that investment with no rewrite. OpenObserve additionally supports SQL for the analytical queries PromQL can't express, so you keep existing PromQL alerts and dashboards while gaining SQL where you need it.
4. Deployment Preference
For self-hosted requirements driven by data sovereignty, choose OpenObserve, VictoriaMetrics, or Mimir. For SaaS preferences that eliminate operational burden, Datadog or New Relic are strong choices. For hybrid needs, managed versions of the open-source options provide flexibility.
5. Primary Use Case
For a full Prometheus replacement that also unifies logs and traces, OpenObserve covers the most ground. For a metrics-only, drop-in upgrade, VictoriaMetrics is the simplest path. For scaling an existing Prometheus deployment without replacing it, Thanos or Mimir are the natural next step. For non-Prometheus time-series workloads like IoT, InfluxDB fits better than any Prometheus-compatible option.
6. Migration Strategy
For the lowest-risk migration, choose tools that accept Prometheus remote write, OpenObserve, VictoriaMetrics, Thanos, Cortex, and Mimir all qualify, so existing scrape configs and exporters don't need to change. For gradual transition, dual-write to both your current setup and the new backend, validate data parity, then cut over dashboards and alerts once confidence is high.
Migrating from Prometheus to OpenObserve
Migrating from a self-managed Prometheus setup (with or without Thanos/Cortex/Mimir bolted on) to OpenObserve can be done incrementally, without rewriting exporters or instrumentation. By routing metrics through Prometheus remote write or the OpenTelemetry Collector's Prometheus receiver, teams can validate OpenObserve alongside their existing setup before cutting over.
This approach allows you to run Prometheus and OpenObserve side by side during migration, validate data parity, and gradually transition dashboards and alerts, all while avoiding a big-bang cutover.
The migration typically follows these phases:
- Phase 1: Configure Prometheus (or your exporters directly) to dual-write via remote write to both the existing backend and OpenObserve.
- Phase 2: Rebuild critical dashboards in OpenObserve using its SQL-based querying and built-in visualization. This is rarely a from-scratch effort: OpenObserve's dashboard repository covers common integrations out of the box, and dashboards can be imported directly as JSON, the same import tooling that let DevZero migrate its dashboards, alerts, logs, metrics, and traces off Datadog in under an hour.
- Phase 3: Migrate alerting rules to OpenObserve's unified alerting, validating thresholds against historical data.
- Phase 4: Decommission Thanos, Cortex, or Mimir components once validation is complete, since long-term storage is handled natively.
Conclusion
Prometheus remains the right tool for scraping metrics in a Kubernetes-native environment, but scaling it, long-term storage, high availability, high-cardinality handling, forces a choice: bolt on more components, or move to a platform that handles those problems natively.
- OpenObserve stands out for teams wanting to solve high cardinality, long-term storage, and metrics-logs-traces correlation in a single platform, without running Thanos, Cortex, or Mimir on top of Prometheus.
- Metrics-only scaling companions (VictoriaMetrics, Thanos, Cortex, Grafana Mimir) are the right call if you want to keep Prometheus and PromQL exactly as they are while adding scale and durability.
- General-purpose time-series databases (InfluxDB, TimescaleDB, M3DB) fit specific workloads, IoT, relational-adjacent data, or hyperscale volumes, better than a Prometheus-compatible tool would.
- SaaS platforms (Datadog, New Relic) remove operational burden entirely, at higher cost and with less control over data residency.
The right choice depends on whether your bottleneck is cardinality, retention, availability, operational overhead, or tool sprawl, and matching the alternative to that specific bottleneck rather than switching everything at once.
If you're also evaluating tools for adjacent use cases, see our top 10 Grafana alternatives guide, top 10 APM tools comparison, and top 10 Datadog alternatives.
Take the Next Step
Ready to explore the best Prometheus alternative for your metrics at scale?
Try OpenObserve: Start with the open source version or sign up for OpenObserve Cloud
Frequently Asked Questions
About the Author
Simran Kumari

Passionate about observability, AI systems, and cloud-native tools. All in on DevOps and improving the developer experience.
Follow OpenObserve on Google
Add OpenObserve as a preferred source to see more of our articles in Google Search and Top Stories.












