Prometheus vs Mimir vs VictoriaMetrics vs OpenObserve: Metrics Benchmark




Ready to get started?
Try OpenObserve Cloud today for more efficient and performant observability.
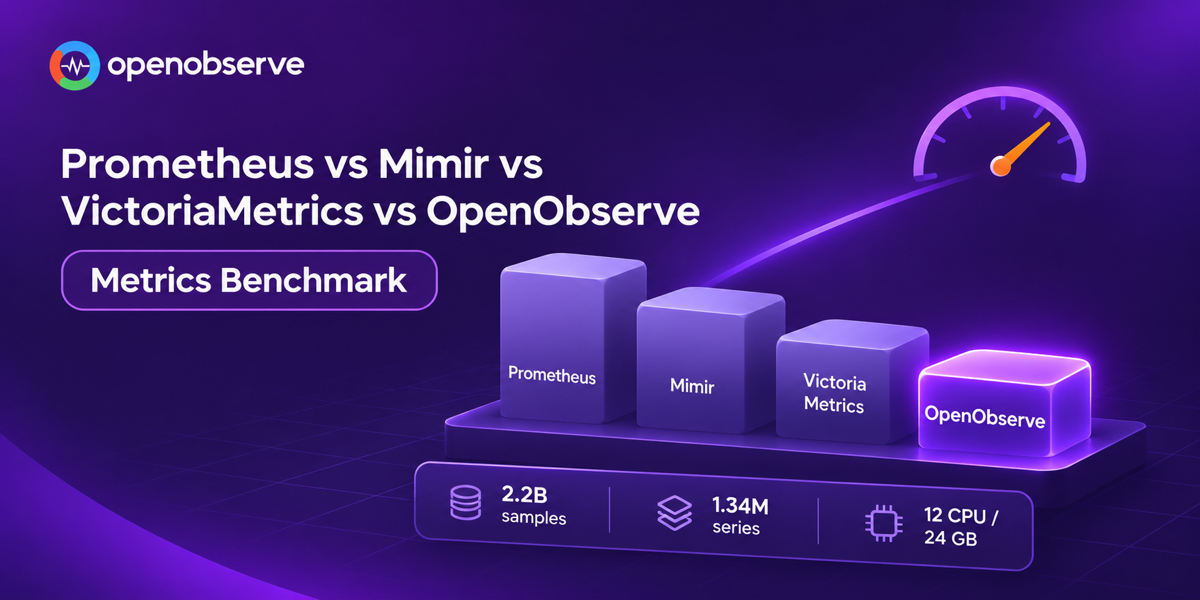
Prometheus vs Mimir vs VictoriaMetrics vs OpenObserve: we wrote the same 2.2 billion samples and 1.34 million series into all four, gave each the same 12 CPUs and 24 GB, and ran identical PromQL. OpenObserve v1.1.1 answered all 16 query and window combinations fastest, including a million-series histogram over 6 hours in 3.7 seconds.
TL;DR
- One dataset, four systems: 2,218,011,632 samples across 1,338,330 series, byte-identical on Prometheus, Mimir, VictoriaMetrics and OpenObserve; each single-node on its own
m7gd.4xlarge, 12 CPU / 24 GB, local NVMe, result caches off. - Fastest in all 16 cells: geomean latency 120 ms for OpenObserve, 374 ms VictoriaMetrics, 1,090 ms Mimir, 6,077 ms Prometheus.
- Million-series histogram, 6h: OpenObserve 3.7s, VictoriaMetrics 9.2s, Mimir 26.7s, Prometheus 4m 12s.
- Reproducible: every manifest, query and script is in the openobserve-metrics-benchmark repository.
Why benchmark metrics backends at a million series?
Prometheus is the reference metrics database and PromQL is the common query language for metrics. Grafana Mimir scales the same data model across a cluster and is one part of the Grafana LGTM stack. VictoriaMetrics is a PromQL-compatible time-series database that runs as a single binary or as a cluster.
All three behave well until cardinality grows. A single histogram with a few labels can produce over a million _bucket series, which is exactly what this dataset contains, and the dashboards on top of it run histogram_quantile and rate across all of them. If Prometheus cardinality is already your problem, the useful question is which backend still answers those queries quickly.
OpenObserve takes a different path from the three TSDBs. It stores metrics as columnar Parquet with a metrics index alongside, new in v1.1.1, and answers PromQL over that data. This is our second metrics benchmark: the first round compared OpenObserve with Prometheus and Mimir on an earlier release. This one adds VictoriaMetrics and the new index.
How we ran the benchmark
The full setup lives in the benchmark repository: Kubernetes manifests, the load generator, the queries and the measurement scripts.
Figure 2 · One load generator sends byte-identical data to all four systems.
| Setting | Value |
|---|---|
| Hardware | One dedicated EC2 m7gd.4xlarge per system (16 vCPU, 64 GiB, local NVMe), all single-node |
| Container limit | 12 CPU / 24 GB, requests equal to limits, for ingestion, compaction and queries |
| Versions | Prometheus v3.6.0, Mimir 3.2.2, VictoriaMetrics v1.154.0 (single node), OpenObserve v1.1.1 (Parquet with metrics index) |
| Caches | Result caches off: VictoriaMetrics -search.disableCache, OpenObserve ZO_RESULT_CACHE_ENABLED=false; Prometheus and Mimir have none configured |
| Limits | Query limits raised to the same level on all four; 600s timeout everywhere |
| Data | 7 hours at exactly 15s intervals, 2026-09-28 03:00 to 10:00 UTC, written once to all four |
| Windows | 30m, 1h, 3h and 6h, all ending 2026-09-28 10:00 UTC |
| Step | 15s for 30m/1h/3h, 30s for 6h |
| Runs | 5 per cell, the whole matrix twice back to back; tables report the median of both passes |
How the measurement is taken
- Queries are issued from inside the cluster, from a pod in the same availability zone as all four systems, on a node that is not under test.
- Every system's data is on node-local NVMe, so storage is not a variable and no query measures network-disk throughput.
- All data is in place before anything is measured. The load finishes, every system finishes its own background work (compaction, merges, block uploads), and only then do queries start. VictoriaMetrics settled 5 minutes after the backfill, Prometheus 16, OpenObserve 22 and Mimir 26.
- The step is computed, not pinned. A fixed 15s step makes the point count grow with the window (1,440 points at 6h), which no dashboard requests. Grafana asks for roughly the panel width in pixels, so this benchmark uses its rule:
max(15s, range / 1000)rounded up to a tidy interval, so no window asks for more than 720 points.
How the data was generated
The load comes from openobserve/fake-webserver:v5 in backfill mode: a single job simulating 14 web-server nodes, producing 7 hours of samples at 15-second spacing from a fixed seed. It sends the identical Prometheus remote-write requests to all four systems, so every system receives byte-identical data, and the same flags reproduce the same samples.
The result is 2,218,011,632 samples across 1,338,330 series, with 0 retries and 0 rejected samples on any system. Each system then held exactly the generated count. Series per metric, verified identical on all four:
| Metric | Series | Used by |
|---|---|---|
codelab_api_request_duration_seconds_bucket |
1,179,360 | the histogram queries |
codelab_api_request_duration_seconds_count |
45,360 | the irate query |
codelab_api_request_duration_seconds_sum |
45,360 | |
codelab_api_requests_total |
45,360 | |
codelab_api_request_errors_total |
22,680 | |
codelab_api_http_requests_in_progress |
210 | |
| Total | 1,338,330 |
Configuration for each system
The usual way a vendor benchmark goes wrong is tuning your own tool and running the others near defaults. Here is what each system ran. OpenObserve runs at defaults plus the result cache off and raised metrics query limits:
extraEnv:
  - name: ZO_METRICS_MAX_SERIES_RESPONSE
    value: "40000"
  - name: ZO_METRICS_MAX_POINTS_PER_SERIES
    value: "10000000"
  - name: ZO_RESULT_CACHE_ENABLED
    value: "false"
Prometheus runs with the remote-write receiver on so the load can be pushed in, and the last two flags raised from their defaults so the million-series histogram runs instead of being refused. A 2-hour out-of-order window in prometheus.yml accepts neighbouring timestamps that the parallel senders deliver slightly out of order:
args:
  - --web.enable-remote-write-receiver
  - --query.max-samples=1000000000   # default 50e6
  - --query.timeout=600s             # default 2m

# prometheus.yml
storage:
  tsdb:
    out_of_order_time_window: 2h
Mimir has its ingestion limits raised so the write path is never throttled, and its query-side limits raised for the same reason as Prometheus. Mimir needs both timeouts, because http_server_write_timeout also defaults to 2m and fires first:
querier:
  timeout: 600s                        # default 2m
server:
  http_server_write_timeout: 600s      # default 2m
limits:
  ingestion_rate: 20000000
  ingestion_burst_size: 20000000
  max_global_series_per_user: 150000000
  max_fetched_chunks_per_query: 20000000   # default 2e6
  out_of_order_time_window: 2h
Mimir's background timers default to hours: compaction waits up to an hour, the ingester keeps its local copy of each block for 13 hours after upload, and compacted-away blocks are kept for 12. We shortened them so Mimir settled 26 minutes after the backfill and answers this data from object storage, the way the other systems read their disk. Mimir checks two of these at startup: the while-querying delay must exceed three times sync_interval and stay below ignore_deletion_mark_delay.
blocks_storage:
  tsdb:
    head_compaction_idle_timeout: 5m       # default 1h
    retention_period: 15m                  # default 13h
  bucket_store:
    sync_interval: 1m                      # default 15m
    ignore_deletion_mark_delay: 5m         # default 1h
    ignore_deletion_mark_while_querying_delay: 4m
compactor:
  first_level_compaction_wait_period: 1m   # default 25m
  compaction_interval: 5m                  # default 1h
  cleanup_interval: 5m                     # default 15m
  deletion_delay: 10m                      # default 12h
VictoriaMetrics has its per-query limits raised so the largest query is answered rather than rejected:
extraArgs:
  search.disableCache: true
  search.maxSamplesPerQuery: "2147000000"
  search.maxQueryDuration: 600s
  search.maxUniqueTimeseries: "5000000"
Query results: four PromQL queries, four time windows
The query set covers the four most common dashboard workloads: irate, an unfiltered histogram, a regex-filtered histogram and an equality-filtered histogram, each over 30-minute, 1-hour, 3-hour and 6-hour windows. Tables show the median latency in milliseconds. No query failed and no system restarted.
1. irate
sum by (path) (irate(codelab_api_request_duration_seconds_count[1m]))
| Window | Step | Prometheus | Mimir | VictoriaMetrics | OpenObserve |
|---|---|---|---|---|---|
| 30m | 15s | 1,332 | 348 | 132 | 23 |
| 1h | 15s | 2,360 | 428 | 164 | 36 |
| 3h | 15s | 7,534 | 770 | 237 | 80 |
| 6h | 30s | 9,781 | 1,045 | 339 | 112 |
Over 45,360 series this is the lightest query in the set, and the spread is still two orders of magnitude. On the 6-hour window OpenObserve answers in 112 ms: 3.0x faster than VictoriaMetrics (339 ms), 9.3x faster than Mimir and 87x faster than Prometheus. It stays near or under a tenth of a second on every window.
2. Unfiltered histogram: the million-series stress test
histogram_quantile(
  0.9,
  sum by(le, path) (
    rate(codelab_api_request_duration_seconds_bucket{}[5m])
  )
)
This query has no label filter at all, so it must run rate and aggregation over all 1,179,360 series. It is the hardest query in the test.
| Window | Step | Prometheus | Mimir | VictoriaMetrics | OpenObserve |
|---|---|---|---|---|---|
| 30m | 15s | 33,653 | 6,738 | 4,164 | 506 |
| 1h | 15s | 60,159 | 9,450 | 4,704 | 964 |
| 3h | 15s | 193,082 | 20,222 | 7,222 | 2,663 |
| 6h | 30s | 252,336 | 26,704 | 9,246 | 3,672 |
Figure 4 · Unfiltered histogram over 1,179,360 series by window. Log scale: each gridline is 10x.
The gap is widest where the most data is scanned: at 30 minutes OpenObserve is 8.2x faster than VictoriaMetrics (506 ms against 4,164 ms). It still holds a 2.5x lead at 6 hours, returning in 3.7 seconds against 9.2 for VictoriaMetrics, 27 for Mimir and more than four minutes for Prometheus.
All four complete every window, but only because the limits were raised on all of them. At stock settings this query does not run at all. Prometheus refuses it outright:
execution: query processing would load too many samples
into memory in query execution
Mimir refuses the wider windows:
execution: the query exceeded the maximum number of chunks
(limit: 2000000 chunks) (err-mimir-max-chunks-per-query).
VictoriaMetrics' stock search.maxSamplesPerQuery and search.maxQueryDuration stop the longer windows too, with an HTTP 422. Each is a protective default doing its job; this benchmark raises them all to the same allowance, with the same 600-second clock.
3. Filtered histogram (regex match)
histogram_quantile(
  0.9,
  sum by(le, path) (
    rate(codelab_api_request_duration_seconds_bucket{path=~"/api/bar"}[5m])
  )
)
| Window | Step | Prometheus | Mimir | VictoriaMetrics | OpenObserve |
|---|---|---|---|---|---|
| 30m | 15s | 640 | 274 | 82 | 22 |
| 1h | 15s | 1,206 | 324 | 110 | 36 |
| 3h | 15s | 3,650 | 534 | 138 | 86 |
| 6h | 30s | 4,604 | 646 | 228 | 134 |
4. Filtered histogram (equality match)
histogram_quantile(
  0.9,
  sum by(le, path) (
    rate(codelab_api_request_duration_seconds_bucket{path="/api/bar"}[5m])
  )
)
| Window | Step | Prometheus | Mimir | VictoriaMetrics | OpenObserve |
|---|---|---|---|---|---|
| 30m | 15s | 620 | 273 | 84 | 19 |
| 1h | 15s | 1,102 | 329 | 110 | 34 |
| 3h | 15s | 3,678 | 534 | 138 | 78 |
| 6h | 30s | 4,631 | 652 | 176 | 114 |
Regex and equality matching cost essentially the same on every system. The filter type is not the variable; scan volume is.
These filtered queries are the "filter by endpoint" panels that fill real dashboards, and OpenObserve answers every one in under 135 ms. At 6 hours it returns in 114 to 134 ms against VictoriaMetrics' 176 to 228 ms (1.5 to 1.7x faster), while Mimir needs about 0.65 seconds and Prometheus 4.6 seconds. On shorter windows the lead widens: at 30 minutes OpenObserve is about 4x faster than VictoriaMetrics.
Figure 5 · All four query types over the 6-hour window. Bar lengths to real scale within each panel.
How does OpenObserve compare across all 16 combinations?
OpenObserve is fastest in every one of the 16 query and window cells. VictoriaMetrics is the next-fastest system everywhere, so the clearest way to see the lead is OpenObserve's speedup over it, cell by cell:
Figure 6 · How many times faster OpenObserve is than VictoriaMetrics, the next-fastest system, in each cell.
The lead is largest on short windows and on the unfiltered histogram, where the most data is scanned per point returned, and smallest on the long filtered histograms. Taking the geometric mean of all 16 cells gives one number per system:
OpenObserve's geomean of 120 ms is 0.32x VictoriaMetrics' latency, 11% of Mimir's and 2% of Prometheus': about 3x, 9x and 50x faster respectively.
How much disk does each system use?
Disk used once each system had settled, from each system's own accounting:
| System | On disk | Of which |
|---|---|---|
| VictoriaMetrics | 1.32 GB | |
| OpenObserve | 2.23 GB | Parquet data 1.55 GB + metrics index 0.67 GB |
| Prometheus | 5.43 GB | blocks 1.74 GB; the last 3 hours or so in head chunks 0.51 GB + WAL 3.19 GB |
| Mimir | 5.51 GB | object storage 1.94 GB; ingester WAL 2.7 GB + newest block 0.64 GB |
Figure 8 · Disk used after settling, 2.22 billion samples. Solid: the data queries read. Light: index, WAL and local copies.
OpenObserve stores the 2.22 billion samples in 2.23 GB, about one byte per sample and less than half the footprint of Prometheus or Mimir. That includes the metrics index (0.67 GB, or 0.30 bytes per sample), which is what makes the query results above possible. VictoriaMetrics' TSDB-specific encoding is the most compact at about 0.6 bytes per sample, for a store that serves metrics only.
OpenObserve's data is general-purpose columnar Parquet. The same files serve SQL as well as PromQL, can be read by any Parquet-aware tool, and map directly onto object storage, where they typically live in production at a much lower per-GB cost than local NVMe. Prometheus keeps its most recent 3 hours or so in memory-mapped head chunks and the WAL by design, roughly two thirds of its 5.43 GB. Mimir answers from the 1.94 GB compacted block in object storage; its ingester keeps the WAL and newest block on local disk until close_idle_tsdb_timeout (13 hours) closes the idle database.
Run the benchmark yourself
We make OpenObserve, so treat these numbers as a vendor benchmark and check them. The openobserve-metrics-benchmark repository has everything needed to reproduce the run:
deploy/: per-system manifests for all four systems, the local NVMe setup and the fake-webserver backfill job, including every setting shown abovebench/: the query runner and measurement scriptsRESULTS.md: the full results, including per-pass data and settling details
You need a Kubernetes cluster with four dedicated nodes that have local NVMe (the repo uses EKS with m7gd.4xlarge), plus kubectl, helm, curl and python3. End to end it takes about two hours: roughly 80 minutes of backfill, settling time, then about 10 minutes of queries. If you get different numbers, open an issue on the repo.
More than a metrics database
Prometheus, Mimir and VictoriaMetrics store metrics. OpenObserve is a complete, open source (AGPL-3.0) observability platform, and the metrics engine benchmarked here is one part of it:
- Metrics with PromQL and SQL: Prometheus remote write and OTLP ingest, PromQL for existing dashboards and SQL for ad-hoc analysis on the same data.
- Logs, traces and profiles in the same system, with service graph and service catalog built from traces.
- Frontend monitoring: RUM, session replay and error tracking, plus synthetic browser and protocol checks.
- AI: AI Assistant, SRE Agent for AI root cause analysis, an MCP server, LLM observability and evaluations, anomaly detection, log patterns and insights.
- Alerting and reliability: scheduled, real-time, composite and anomaly alerts, incident management, and SLOs with error budgets and burn rate.
- Dashboards and scheduled reports.
- Data processing: pipelines, VRL functions, enrichment tables and metrics downsampling.
- Storage and cost: Parquet on object storage, Bring Your Own Bucket (BYOB), extended retention, and ingest-based pricing with no per-host or per-user fees.
- Security and governance: SSO, RBAC, multi-tenancy, sensitive data redaction, audit trail, cipher keys and federated search.
- Compliance: SOC 2 Type II, ISO 27001, and GDPR via the EU region.
- Open standards: OpenTelemetry-native ingest, PromQL and SQL.
If you run Prometheus on Kubernetes today, sending metrics from kube-prometheus-stack to OpenObserve walks through pointing your existing setup at it, and our Prometheus alternatives guide covers the wider field.
The bottom line
Put the same 2.2 billion samples and 1.34 million series in front of four systems with the same resources, and the results condense to four points:
- Fastest everywhere: OpenObserve answers all 16 combinations fastest, with a geomean of 0.32x VictoriaMetrics' latency, 11% of Mimir's and 2% of Prometheus'.
- At a million series: the unfiltered histogram over 6 hours takes OpenObserve 3.7s, VictoriaMetrics 9.2s, Mimir 26.7s and Prometheus 4m 12s, and needs raised limits on every system to run at all.
- Everyday dashboard queries: irate at 6h returns in 112 ms against 339 ms, 1.0s and 9.8s; filtered histograms stay under 135 ms on every window.
- Storage: 2.23 GB including the metrics index, less than half of Prometheus (5.43 GB) and Mimir (5.51 GB), in open Parquet that serves SQL and PromQL alike.
For teams whose metrics have crossed a million active series, OpenObserve keeps PromQL dashboards fast without giving up the query language or the remote-write pipeline you already have. For the logs side of the same approach, see OpenObserve vs ClickHouse: one billion log records.
Get started with OpenObserve
- Try it on your own metrics: OpenObserve Cloud gives you PromQL, SQL, dashboards and alerts without running anything yourself.
- Self-host it: the same engine is open source; follow the getting started guide.
- Reproduce the numbers: clone the benchmark repository and run it on your own account.
- Read next: What you need to know about Prometheus architecture.
Frequently Asked Questions
About the Author
Hengfei Yang


Hengfei Yang is the founding engineer at OpenObserve. He has extensive experience in distributed system development. He is passionate about open source and has interests in traveling, music and photography.
Follow OpenObserve on Google
Add OpenObserve as a preferred source to see more of our articles in Google Search and Top Stories.