OpenTelemetry Context Propagation Explained: A W3C Trace Context Deep-Dive




Ready to get started?
Try OpenObserve Cloud today for more efficient and performant observability.
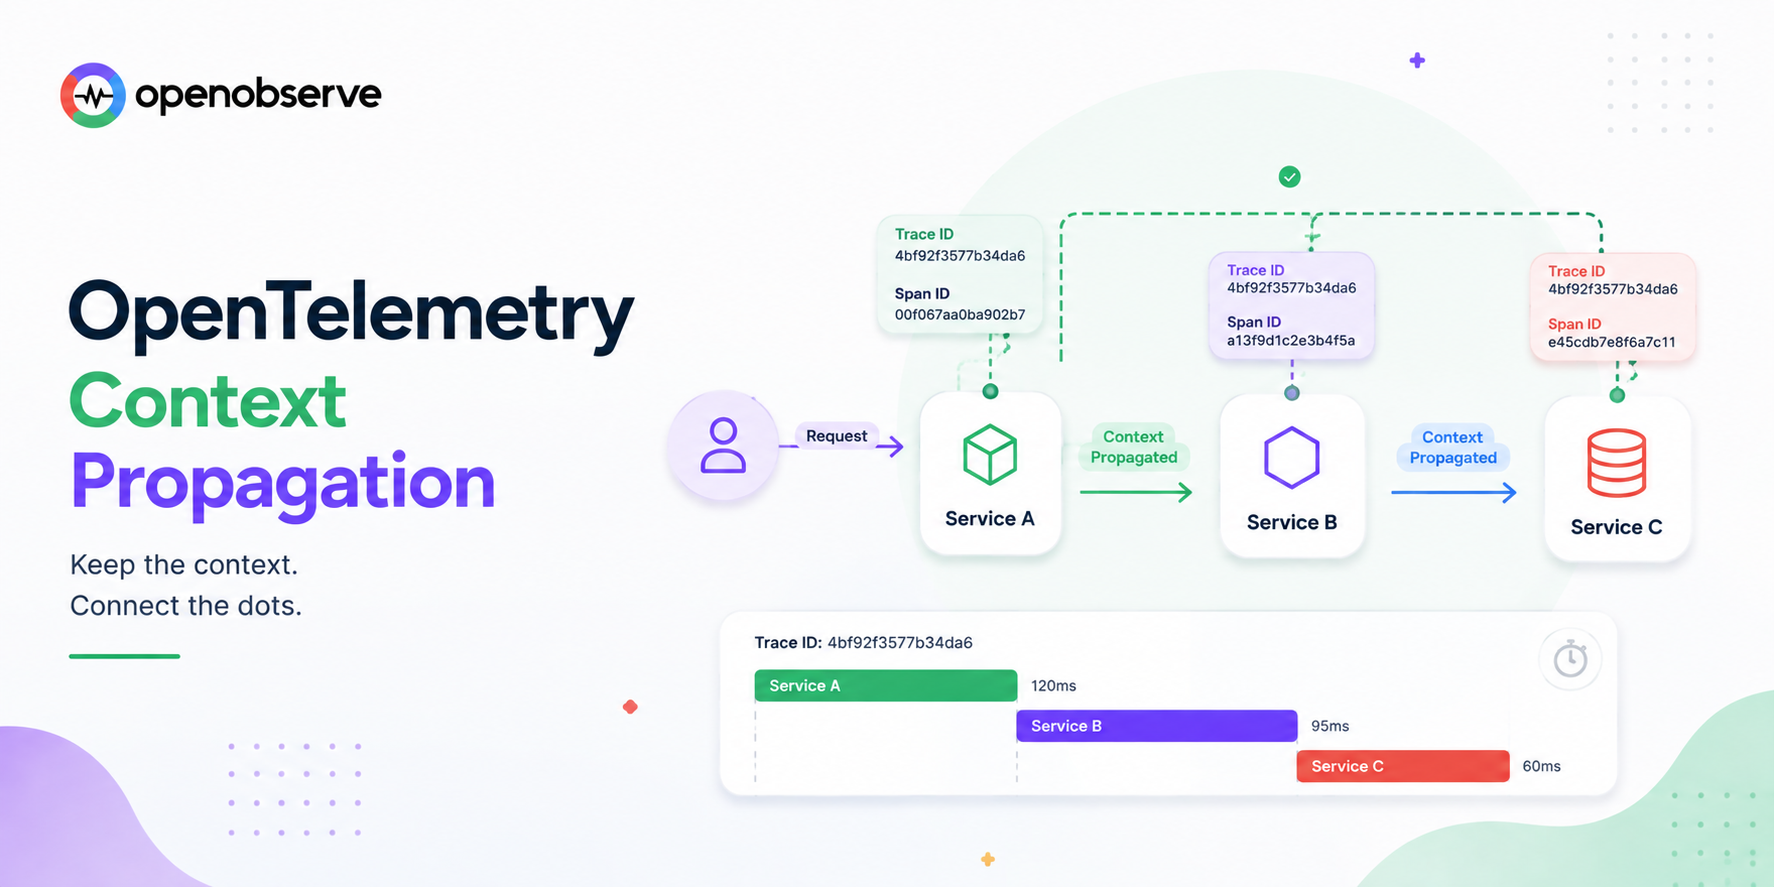
A request hits your API gateway, fans out to six microservices, touches a message queue, and lands in a database. In your tracing backend, this shows up as either one connected trace you can follow end to end, or six disconnected spans with no relationship between them, and the only difference between those two outcomes is whether context propagation worked.
This is a deep-dive on exactly how that works: the W3C Trace Context specification OpenTelemetry builds on, the traceparent and tracestate headers byte by byte, how OTel's propagators actually move that context across a service boundary, and the specific ways propagation breaks in real systems.
For the broader distributed tracing picture, see Distributed Tracing: Basics to Beyond; for how this fits into OpenTelemetry as a whole, see What Is OpenTelemetry?.
TL;DR
Context propagation carries trace identity across service boundaries using the W3C Trace Context spec's traceparent header: {version}-{trace-id}-{parent-id}-{trace-flags}, a fixed-format string every W3C-compliant system reads identically. The companion tracestate header carries vendor-specific extras without breaking interoperability. OpenTelemetry implements this through Propagators, which inject() context into outbound requests and extract() it from inbound ones; most auto-instrumentation handles this for you, but background jobs, queue consumers, and mixed legacy systems are where it breaks.
traceparent: the interoperable core, trace ID, parent span ID, sampled flag, e.g.00-4bf92f3577b34da6a3ce929d0e0e4736-00f067aa0ba902b7-01.tracestate: an ordered, vendor-extensible list of key-value pairs riding alongsidetraceparent.- Baggage: a separate header and spec for propagating arbitrary application data, not trace identity.
- Propagators: OTel's
inject/extractmechanism that reads and writes context to a carrier (HTTP headers, message attributes). - Where it breaks: background threads, queue consumers, header-stripping proxies, and mismatched propagator formats between services.
What Is Context Propagation?
Every span needs two pieces of identity to land in the right place in a trace: which trace it belongs to (trace ID), and which span called it (parent span ID). A single process can generate both locally. The problem is the moment a request crosses a process boundary, an HTTP call, a message published to a queue, a gRPC invocation, that identity has to travel with it, or the receiving service has no way to know it's part of an existing trace at all. It would start a brand new trace instead.
Context propagation is the general mechanism that solves this: serializing trace context into a carrier (most commonly HTTP headers) on the way out, and deserializing it back into an active context on the way in. Get this right consistently across every hop, and a request touching fifteen services produces one trace. Get it wrong at even one hop, and the trace fractures into disconnected pieces at exactly that point, which is almost always the pattern seen when someone reports "traces are incomplete."
The W3C Trace Context Specification
Before 2020, propagation was a interoperability problem: Zipkin used X-B3-* headers, Jaeger used uber-trace-id, and every vendor had its own format, so a trace crossing services instrumented by different tools simply didn't connect. The W3C Trace Context specification fixed this by standardizing the propagation format itself, independent of any specific tracing backend. OpenTelemetry adopted it as the default propagation format, which is why it's the one you'll encounter almost everywhere today.
The spec defines two HTTP headers:
traceparent: the required, interoperable core: trace ID, parent span ID, and sampling decisiontracestate: an optional, vendor-extensible companion for additional state
Both travel as plain HTTP headers on every request between services, added automatically by OpenTelemetry's instrumentation on the sending side and read automatically on the receiving side.
Anatomy of the traceparent Header
A traceparent value looks like this:
00-4bf92f3577b34da6a3ce929d0e0e4736-00f067aa0ba902b7-01
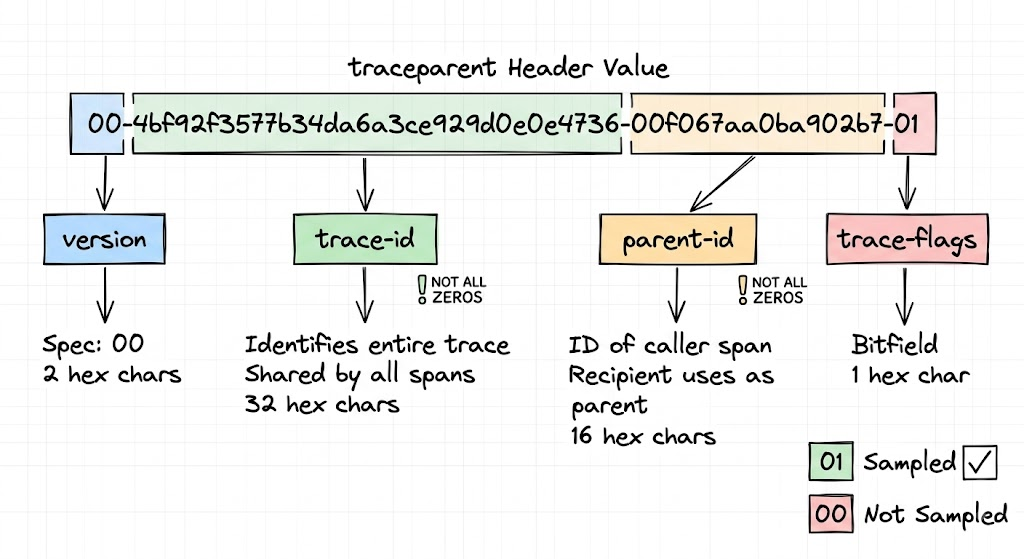
Broken into its four dash-separated fields:
| Field | Length | Example | What It Is |
|---|---|---|---|
version |
2 hex chars | 00 |
The Trace Context spec version. Currently always 00; a receiver seeing an unrecognized version falls back to best-effort parsing. |
trace-id |
32 hex chars (16 bytes) | 4bf92f3577b34da6a3ce929d0e0e4736 |
Identifies the entire trace. Every span from every service for this one logical request shares this exact value. Must not be all zeros. |
parent-id |
16 hex chars (8 bytes) | 00f067aa0ba902b7 |
The span ID of the caller, i.e. the span that made this specific request. The receiving service creates its own new span with this as its parent. Must not be all zeros. |
trace-flags |
2 hex chars | 01 |
A bitfield. The low bit is the sampled flag: 01 means the upstream service decided to sample this trace, 00 means it didn't. |
A few things worth knowing that trip people up:
- The trace ID never changes across the whole trace. Every service, every span, same 32 hex characters. If you see different trace IDs for what should be one request, propagation isn't happening.
- The parent ID changes at every hop. Service A's outgoing
traceparentcarries Service A's span ID asparent-id. When Service B receives it, it creates its own span, and that span's ID becomes theparent-idin whatevertraceparentService B sends onward to Service C. - The sampled flag is a recommendation, not a command. It tells downstream services what the upstream sampling decision was, but a
ParentBasedsampler (OTel's default) respects it by default, while a differently configured sampler downstream can still make its own call.
The tracestate Header: Multi-Vendor Interoperability
tracestate solves a narrower problem: what happens when a trace passes through multiple tracing vendors or systems that each need to attach their own state, without any of them needing to understand each other's format.
Format: a comma-separated, ordered list of key-value pairs.
tracestate: rojo=00f067aa0ba902b7,congo=t61rcWkgMzE
Each entry is vendorkey=opaque-value. The list is ordered by recency, the most recently updated entry appears first. A service updating its own entry moves it to the front rather than appending; a service adding a new entry prepends it. The spec caps the list at 32 members and the combined header at 512 bytes, so if you're chaining through many vendors, older entries can get dropped from the end.
Critically: tracestate is optional and additive. A service that has no idea what tracestate means can, and should, forward it unchanged (or drop it) without breaking the trace, because the trace connects correctly through traceparent alone. tracestate is where a vendor might stash something like an internal sampling priority score that only that vendor's backend interprets, riding along without interfering with anyone else.
Trace Context vs. Baggage: What's the Difference?
These get confused constantly because they travel the same route (HTTP headers, propagated at every hop) but solve different problems:
Trace Context (traceparent/tracestate) |
Baggage | |
|---|---|---|
| Purpose | Connect spans into one trace | Propagate arbitrary application data |
| Spec | W3C Trace Context | W3C Baggage |
| Header | traceparent, tracestate |
baggage |
| Content | Trace ID, span ID, sampling flag | User-defined key-value pairs, e.g. user.tier=enterprise |
| Consumed by | The tracing system itself | Your application code, and optionally attached to spans as attributes |
A practical example: baggage lets you set customer.tier=enterprise once at the edge, have it automatically ride along through every downstream service call, and pull it into any span's attributes anywhere in the call graph, without threading it through every function signature by hand. It's propagated the same way trace context is (injected and extracted at every hop) but it isn't what connects spans into a trace; that's traceparent's job alone.
Use baggage carefully: it's added to every outbound request at every hop, so anything you put in it has a real, cumulative performance and payload-size cost, and it should never carry PII, since it often ends up visible in logs and downstream systems you don't control.
How OpenTelemetry Implements Propagation
OpenTelemetry's propagation model has three pieces:
- Context: an immutable, in-process object holding the currently active span (and any baggage). Everything created while a given Context is active becomes a child of that context's span.
- Propagators: implement
inject()andextract().inject()writes the active Context into a carrier;extract()reads a carrier and returns a Context. - Carrier: whatever medium is transporting the context, most often an HTTP headers dict, but also message queue attributes, gRPC metadata, or anything else with a key-value shape.
The default propagator most SDKs configure is a composite of TraceContextTextMapPropagator (W3C traceparent/tracestate) and W3CBaggagePropagator (the baggage header), so both trace context and baggage travel together automatically. You can also set this via the OTEL_PROPAGATORS environment variable:
# Default: W3C trace context + baggage
export OTEL_PROPAGATORS=tracecontext,baggage
In-Process vs. Cross-Process Propagation
It's worth separating two propagation problems that feel similar but aren't:
In-process propagation happens automatically for straight-line synchronous code: a function calling another function within the same request keeps the same active Context without you doing anything. Where it doesn't happen automatically is anywhere execution hops to a new thread, a new async task not awaited from the parent, or a callback fired later, since the Context isn't magically attached to new execution units. This is the single most common source of "my traces have gaps inside one service," not just across services.
Cross-process propagation is everything covered above: inject() on the way out, extract() on the way in, over whatever carrier the transport uses. Most HTTP client and server auto-instrumentation (requests, urllib3, Flask, Express, ASP.NET, gRPC interceptors) handles this transparently, calling inject/extract for you on every request. Where auto-instrumentation doesn't reach, message queues, custom RPC protocols, cron jobs picking up a database row, you're responsible for doing it manually.
A Worked Example: Propagating Context Across an HTTP Call
Here's what actually happens under the hood for a plain HTTP call between two Python services, without relying on auto-instrumentation, to make the mechanism concrete.
Service A (caller): inject context into outbound headers
from opentelemetry import trace, propagate
from opentelemetry.trace.propagation.tracecontext import TraceContextTextMapPropagator
import requests

tracer = trace.get_tracer(__name__)
propagator = TraceContextTextMapPropagator()

with tracer.start_as_current_span("call-service-b") as span:
    headers = {}
    propagator.inject(headers)  # writes traceparent (and tracestate) into headers
    # headers now looks like:
    # {"traceparent": "00-4bf92f3577b34da6a3ce929d0e0e4736-00f067aa0ba902b7-01"}

    response = requests.get("http://service-b/api/resource", headers=headers)
Service B (receiver): extract context from inbound headers
from opentelemetry import trace, context
from opentelemetry.trace.propagation.tracecontext import TraceContextTextMapPropagator

tracer = trace.get_tracer(__name__)
propagator = TraceContextTextMapPropagator()

def handle_request(incoming_headers):
    ctx = propagator.extract(incoming_headers)      # parses traceparent into a Context
    token = context.attach(ctx)                      # makes it the active context
    try:
        with tracer.start_as_current_span("handle-resource") as span:
            # this span's parent is Service A's span, extracted from traceparent
            ...
    finally:
        context.detach(token)
Two details that matter: extract() on its own doesn't do anything until you attach() the resulting Context, and any span you start after attaching automatically becomes a child of the extracted parent, no manual parent-ID wiring required. This is exactly what HTTP auto-instrumentation is doing for you behind the scenes on every request.
Propagating Context Through Message Queues
HTTP auto-instrumentation covers request/response calls, but a message published to Kafka, SQS, or RabbitMQ has no request/response cycle for a library to hook into, so propagation across a queue is usually manual:
Producer: inject context into message headers/attributes before publishing
from opentelemetry.trace.propagation.tracecontext import TraceContextTextMapPropagator

propagator = TraceContextTextMapPropagator()

def publish_message(topic, payload):
    headers = {}
    propagator.inject(headers)
    # Kafka, SQS, and RabbitMQ all support arbitrary message headers/attributes;
    # attach the injected traceparent there, not in the payload body.
    producer.send(topic, value=payload, headers=[(k, v.encode()) for k, v in headers.items()])
Consumer: extract context from the message before processing
def consume_message(message):
    incoming = {k: v.decode() for k, v in message.headers}
    ctx = propagator.extract(incoming)
    token = context.attach(ctx)
    try:
        with tracer.start_as_current_span("process-message") as span:
            ...  # this span links back to the producer's trace
    finally:
        context.detach(token)
The same pattern applies to any asynchronous, non-request/response transport: cron jobs reading a queued row, webhook fan-out, background workers. If a system in your stack doesn't have first-party OTel instrumentation for its message format, this manual inject/extract pair is exactly what to add.
Interoperating with Legacy Formats: B3 and Jaeger
Not every service in a real production environment is on W3C Trace Context yet. Older Zipkin deployments use B3 headers (X-B3-TraceId, X-B3-SpanId, X-B3-Sampled, either as separate headers or a single combined b3 header), and older Jaeger deployments use uber-trace-id. If your trace crosses from an OTel-instrumented service into one of these, the receiving side needs a propagator that understands that format, or the context silently doesn't extract and the trace breaks at that boundary.
OpenTelemetry ships propagators for both, and you can register more than one so a service accepts whichever format shows up:
# Accept and emit both W3C Trace Context and B3, useful during a migration
export OTEL_PROPAGATORS=tracecontext,baggage,b3
Once every service in the path is on W3C Trace Context, drop the legacy propagators; carrying formats you no longer need just adds header overhead on every call.
Common Context Propagation Failures
- Background work not inheriting context. A thread pool, a fire-and-forget async task, a scheduled job, none of these automatically carry the active Context unless something explicitly propagates it into the new execution unit. Symptom: a span appears as a new root trace instead of a child of the request that triggered it.
- Proxies and gateways stripping headers. Some API gateways, CDNs, and load balancers only forward an allow-listed set of headers by default. If
traceparentisn't on that list, it never reaches the next hop. Symptom: the trace consistently breaks at one specific network boundary, every time. - Mismatched propagator formats. Service A emits W3C Trace Context; Service B only understands B3. Without a composite propagator on the receiving side, extraction fails silently, and Service B starts a new trace. Symptom: traces break specifically at the boundary between an older and a newer service.
- Manual instrumentation that skips extraction. Code that calls
tracer.start_span()without first extracting and attaching the incoming context creates a disconnected root span even though a validtraceparentarrived. Symptom: the header is present in logs, but the trace still doesn't connect. - Queue consumers processing without extraction. As covered above, this is the most common gap in otherwise well-instrumented systems, since HTTP auto-instrumentation gives a false sense that propagation is "handled" everywhere.
Debugging any of these starts the same way: check whether traceparent is actually present and unchanged on the wire at each hop (log it, or inspect it in a proxy trace), and confirm the trace ID inside it matches what you expect. If the header never arrives, the problem is upstream (injection or a stripping proxy); if it arrives but the trace still doesn't connect, the problem is extraction on the receiving side.
Verifying Propagation Works: What to Look for in OpenObserve
Once traces reach OpenObserve over OTLP, the fastest verification isn't reading raw headers, it's checking whether the trace waterfall itself is connected: one trace ID, a single root span, and every downstream service's spans nested underneath it in the correct parent-child order, with no unexplained gaps or duplicate root spans for what should be one request.
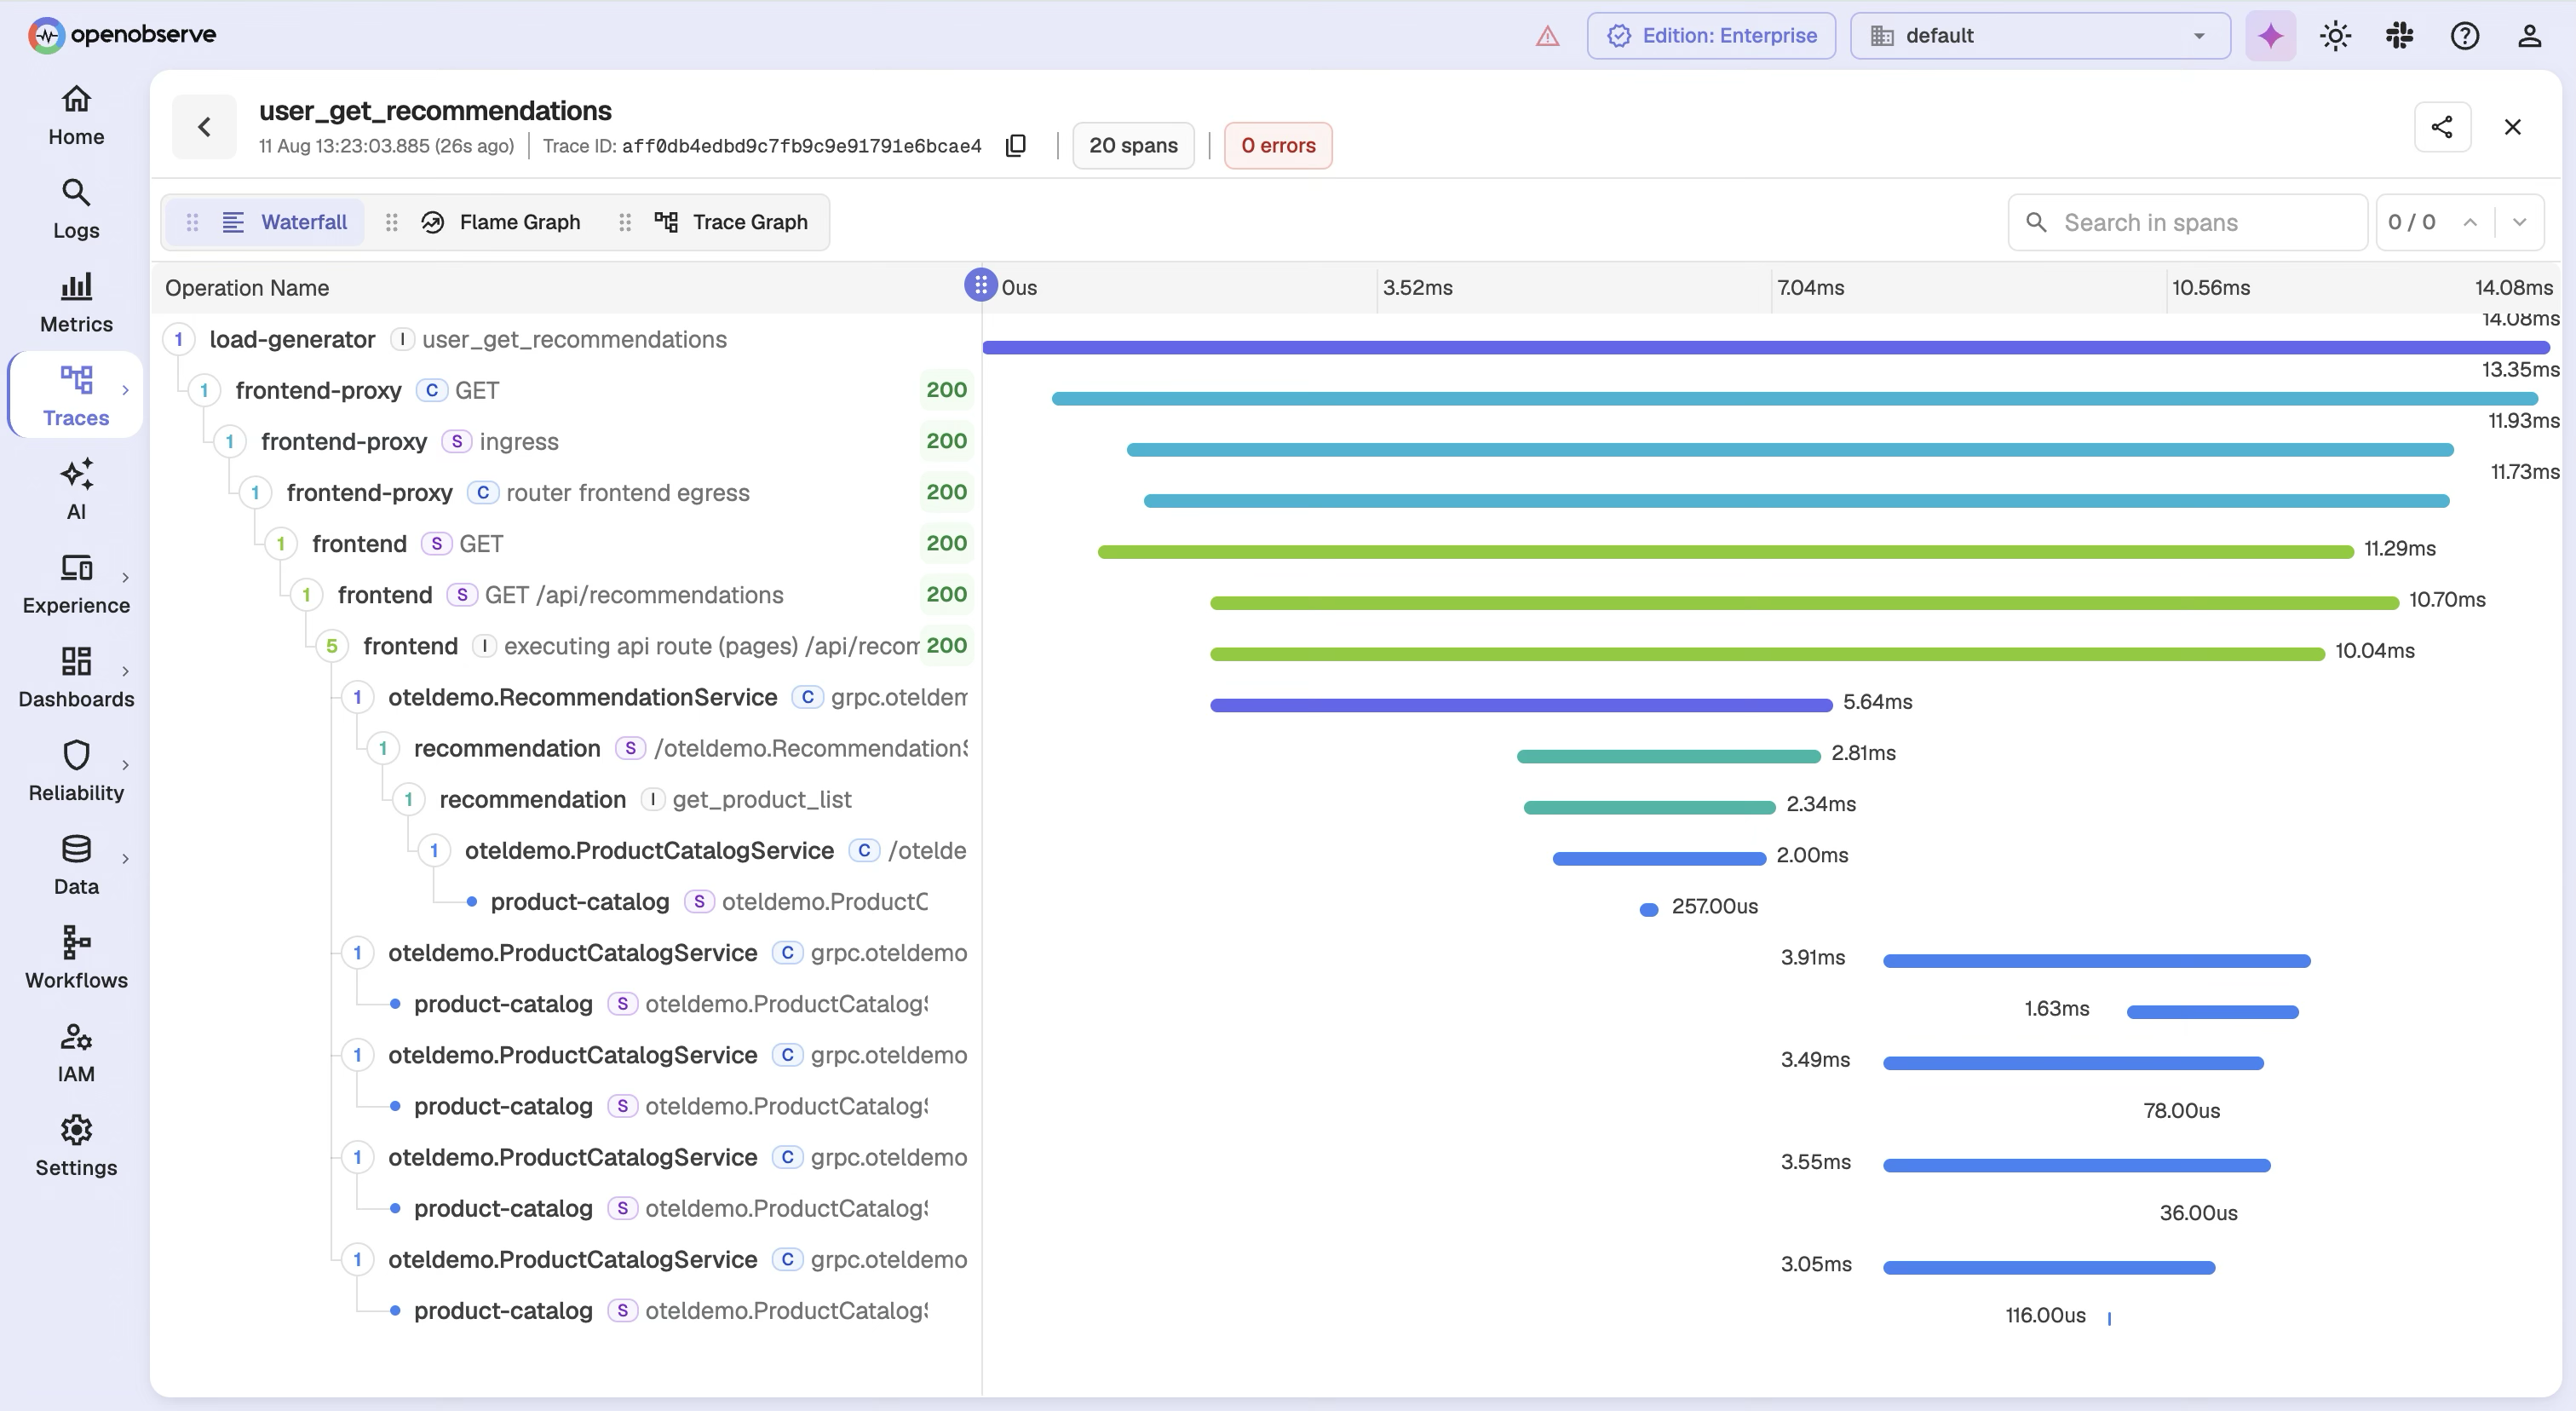
If a service's spans show up as their own separate trace instead of nested under the caller, that's the propagation failure surfacing directly in the UI, and the fix is almost always one of the five failure modes above, most often the queue-consumer or background-job case. Correlating this with logs from the same trace_id is often the fastest way to confirm exactly which hop dropped context; see Logs, Traces, and Metrics Correlation for that workflow, and OpenTelemetry Collector Configuration Guide if you need to inspect or transform propagation headers at the Collector level.
Conclusion
Context propagation is what turns a pile of independent spans into one coherent distributed trace, and the mechanism is simpler than it looks once you separate the pieces: traceparent carries the interoperable core (trace ID, parent ID, sampled flag), tracestate carries optional vendor extras, baggage carries your own application data on a separate header, and OpenTelemetry's propagators handle the inject/extract cycle at every boundary. Auto-instrumentation covers most HTTP paths for free; background jobs, queue consumers, and legacy-format boundaries are where you need to wire it up by hand.
Get the propagation right, and the payoff shows up immediately the next time you need it: one trace, one query, the full path of a slow or failing request laid out from edge to database, in a platform that keeps it next to your logs and metrics. Try OpenObserve free →
Frequently Asked Questions
About the Author
Simran Kumari

Passionate about observability, AI systems, and cloud-native tools. All in on DevOps and improving the developer experience.
Follow OpenObserve on Google
Add OpenObserve as a preferred source to see more of our articles in Google Search and Top Stories.












