How to Monitor LLM Apps in Production: Tokens, Cost, and Latency




Ready to get started?
Try OpenObserve Cloud today for more efficient and performant observability.
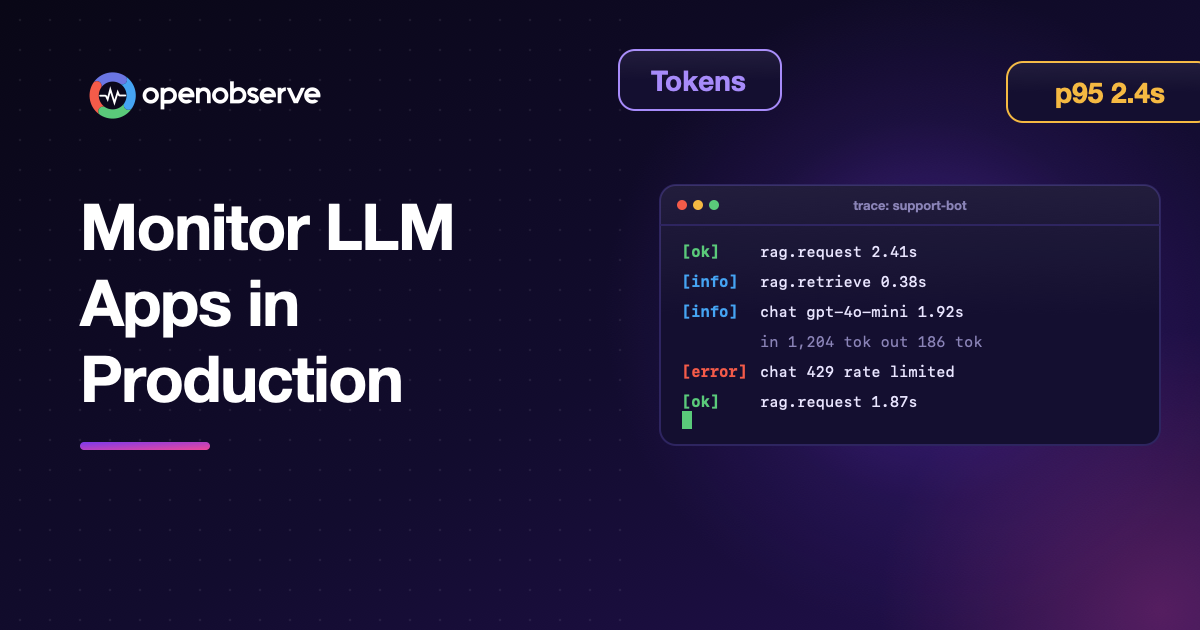
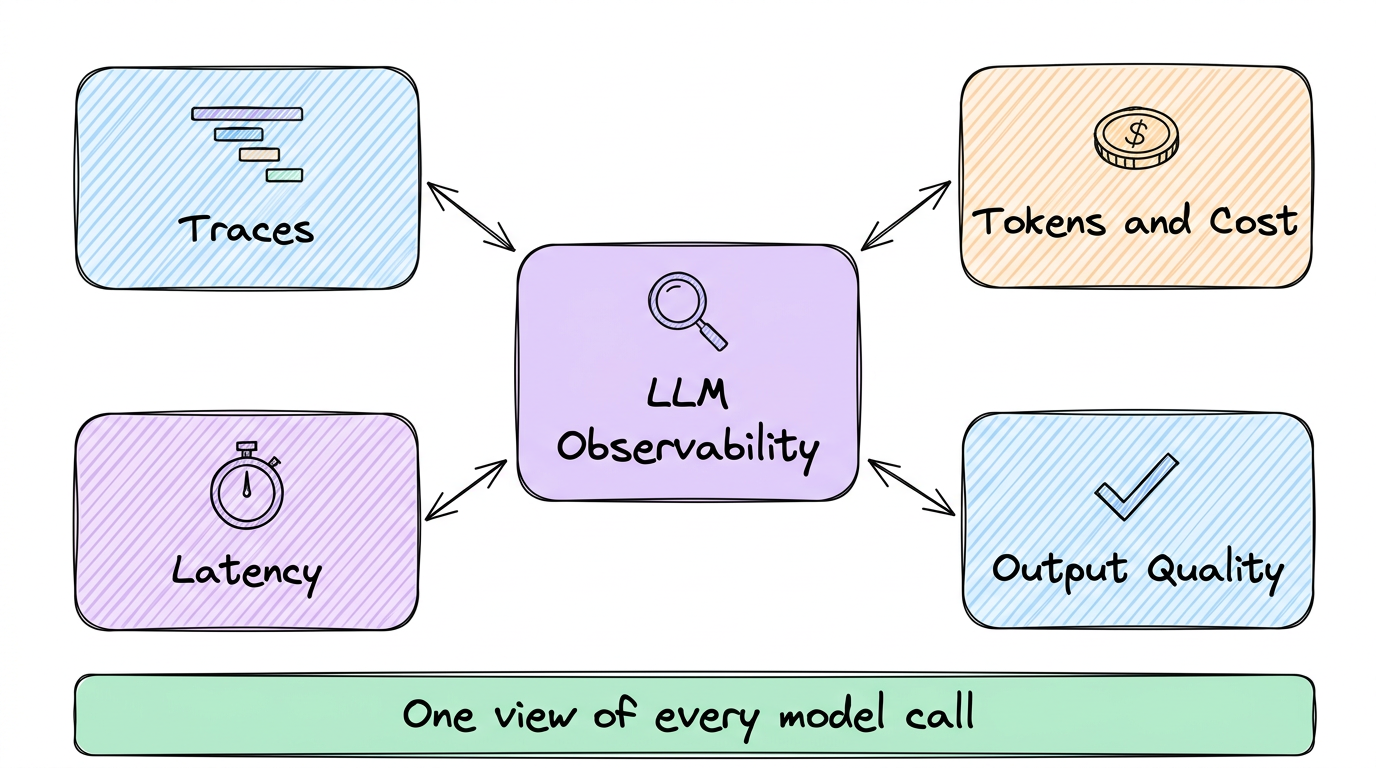
Monitoring LLM apps in production means tracking every model call's tokens, cost, latency, and errors, plus the pipeline steps around it, so you can see why a response was slow, expensive, or wrong. The practical way to do it is OpenTelemetry instrumentation on your model client, custom spans for retrieval and tools, and a backend that turns those spans into cost and latency views.
TL;DR
- Monitoring an LLM app in production starts with tracing every model call with OpenTelemetry, so each call records the model, token counts, latency, and errors.
- Custom spans around retrieval, tools, and post-processing show where a slow or failed request actually spent its time.
- Cost comes from tokens times model pricing, so the backend needs per-model pricing and per-model breakdowns, not just a total.
- Fast and low-cost answers can still be wrong, so production monitoring also needs online evaluations, versioned prompts, evaluation datasets, and experiments that test a change before it ships.
- OpenObserve is the best way to monitor LLM apps in production: it ingests GenAI traces over OpenTelemetry, calculates cost per span, scores quality with evaluations, manages prompts and experiments, and alerts on any SQL query. You can try it free on OpenObserve Cloud.
What should you monitor in an LLM app?
LLM apps fail differently from regular services. A request can return HTTP 200 and still be slow, expensive, or wrong. Track these signals:
| Signal | Why it matters | Where it comes from |
|---|---|---|
| Tokens per call, by model | Drives cost and context-window limits | Model call spans (gen_ai.usage.*) |
| Cost per call, model, and feature | Catches runaway prompts and model changes | Tokens × model pricing |
| Latency percentiles per model | Users feel p95, not the average | Span duration |
| Errors and rate limits | Provider outages and quota limits | Span status and error events |
| Pipeline stage latency | Retrieval or tools are often the real bottleneck | Custom spans |
| Conversation behaviour | Long or looping conversations cost the most | Sessions grouped by conversation ID |
| Answer quality | A fast, low-cost answer can still be wrong or unsafe | Evaluation scores on traces |
| Prompt version | A prompt change can shift quality, cost, and latency at once | Prompt name, version, and label on spans |
For the broader practices behind this list, see LLM monitoring best practices.
Prerequisites
- A Python app that calls the OpenAI API (the same pattern works for Anthropic and other providers).
- An OpenObserve instance: OpenObserve Cloud or a self-hosted one.
- From OpenObserve, the OTLP HTTP endpoint and Authorization header under Data > Data sources > Custom > Traces > OpenTelemetry.
Step 1: Install the instrumentation
Install the OpenObserve Python SDK and the OpenAI instrumentation:
pip install openobserve-python-sdk opentelemetry-instrumentation-openai python-dotenv openai
Step 2: Configure the connection
Create a .env file with your instance details. OPENOBSERVE_URL is the part of the endpoint before /api/; the SDK adds /api/<org>/v1/traces itself.
OPENOBSERVE_URL=<O2_ENDPOINT>
OPENOBSERVE_ORG=<O2_ORG>
OPENOBSERVE_AUTH_TOKEN="Basic <BASE64_AUTH>"
OPENOBSERVE_ENABLED=true
OPENAI_API_KEY="<OPENAI_API_KEY>"
OPENOBSERVE_TRACES_STREAM_NAME sets the traces stream to write to and defaults to default. (Source: OpenObserve docs, LLM Applications, November 2026)
Step 3: Instrument your model calls
Call the instrumentor and openobserve_init() before you create the OpenAI client. Every chat completion then becomes a span with the model, token counts, and duration:
from dotenv import load_dotenv
load_dotenv()

from opentelemetry.instrumentation.openai import OpenAIInstrumentor
from openobserve import openobserve_init

OpenAIInstrumentor().instrument()
openobserve_init()

from openai import OpenAI

client = OpenAI()
response = client.chat.completions.create(
    model="gpt-4o-mini",
    messages=[{"role": "user", "content": "Summarise our refund policy in two sentences."}],
)
print(response.choices[0].message.content)
OpenObserve stores span attributes with dots replaced by underscores, so you'll query fields such as gen_ai_request_model, gen_ai_response_model, gen_ai_usage_input_tokens, gen_ai_usage_output_tokens, and gen_ai_usage_total_tokens.
Step 4: Trace the RAG pipeline around the model
The model call is rarely the whole request. Wrap retrieval and generation in your own spans under one parent span, so a trace shows the full pipeline:
from opentelemetry import trace

tracer = trace.get_tracer("support-bot")

def answer(question: str, conversation_id: str) -> str:
    with tracer.start_as_current_span("rag.request") as span:
        span.set_attribute("gen_ai.conversation.id", conversation_id)

        with tracer.start_as_current_span("rag.retrieve") as retrieve:
            docs = search_knowledge_base(question, top_k=5)  # your retriever
            retrieve.set_attribute("rag.documents_returned", len(docs))

        context = "\n\n".join(d.text for d in docs)
        response = client.chat.completions.create(
            model="gpt-4o-mini",
            messages=[
                {"role": "system", "content": f"Answer using only this context:\n{context}"},
                {"role": "user", "content": question},
            ],
        )
        return response.choices[0].message.content
The instrumented chat completion becomes a child of rag.request, so the waterfall shows retrieval time and model time side by side. If a request is slow, you can tell at a glance whether the retriever or the model is responsible.
Step 5: Group conversations into sessions
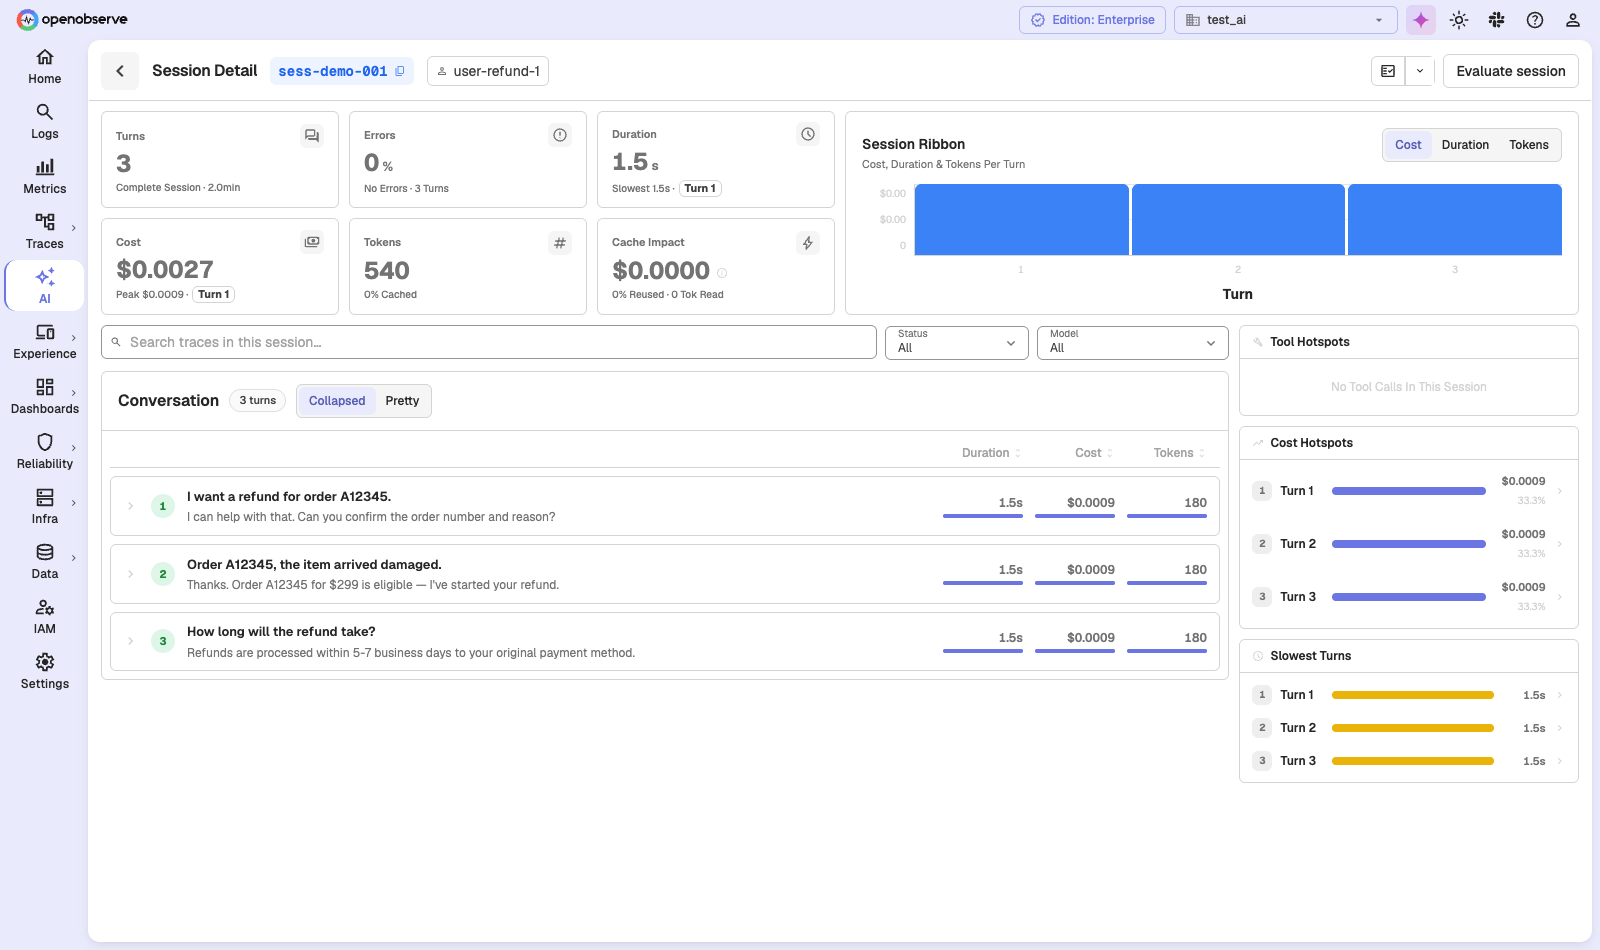
OpenObserve Sessions groups LLM traces into conversations by a session or conversation ID, read from gen_ai.conversation.id, session.id, or similar fields, and shows each turn's tokens, cost, and tool calls. Step 4 sets gen_ai.conversation.id on the request span. OpenObserve's AI data health checks flag LLM spans that are missing a conversation ID, so use them to confirm every turn is grouped.
Step 6: Verify traces in OpenObserve
Run the app, then open Traces in OpenObserve, filter by service name or model, and select a span. You'll see the model, input and output tokens, duration, and the cost OpenObserve calculated for it:
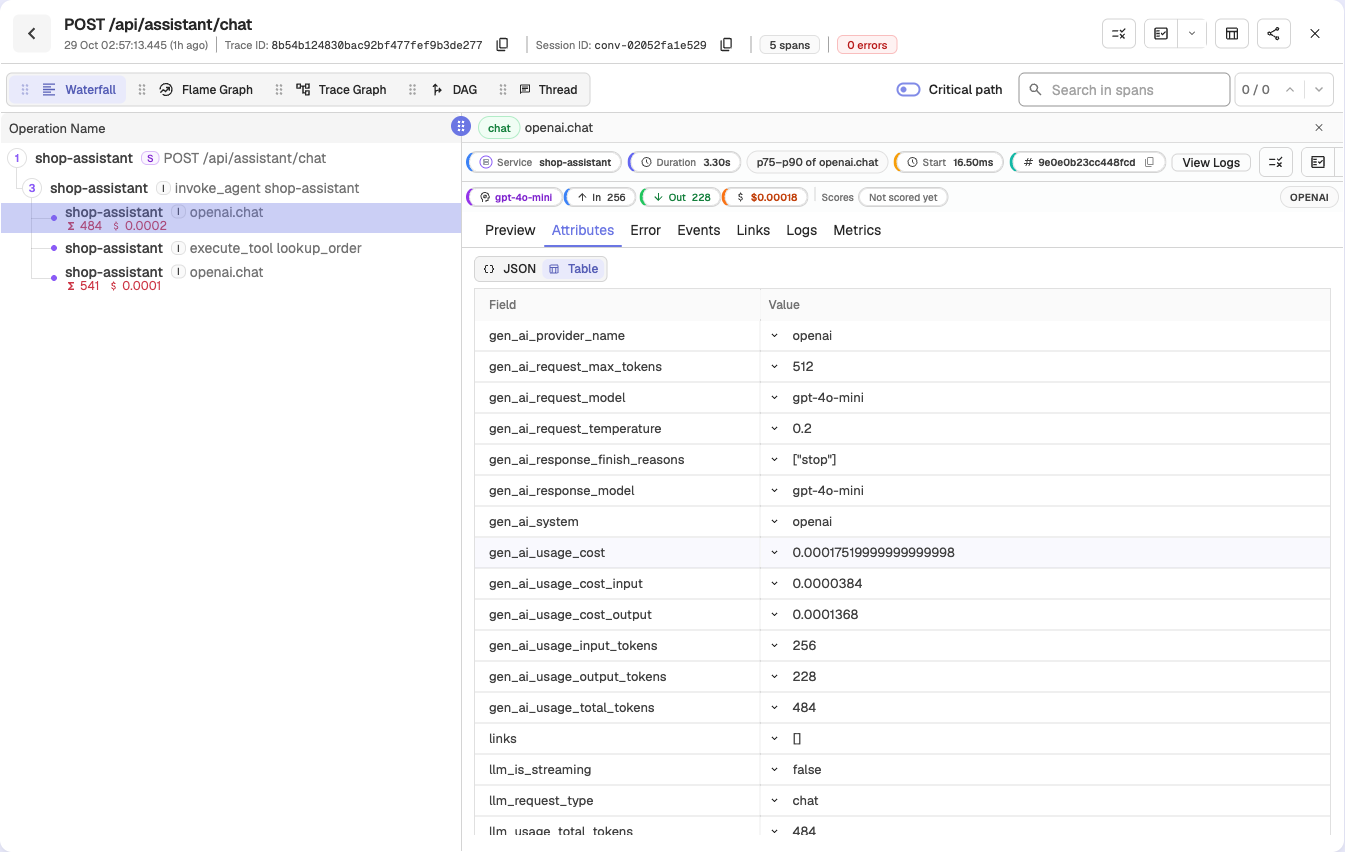
Cost is calculated at ingestion by Model Pricing, under Settings > Data & AI > LLM Model Pricing on Enterprise and Cloud. It maps each span's model to a pricing definition from a built-in catalog or your own custom rates, and stores the result in gen_ai_usage_cost. Spans that already report a cost keep it.
Step 7: Watch cost, tokens, and latency in LLM Insights
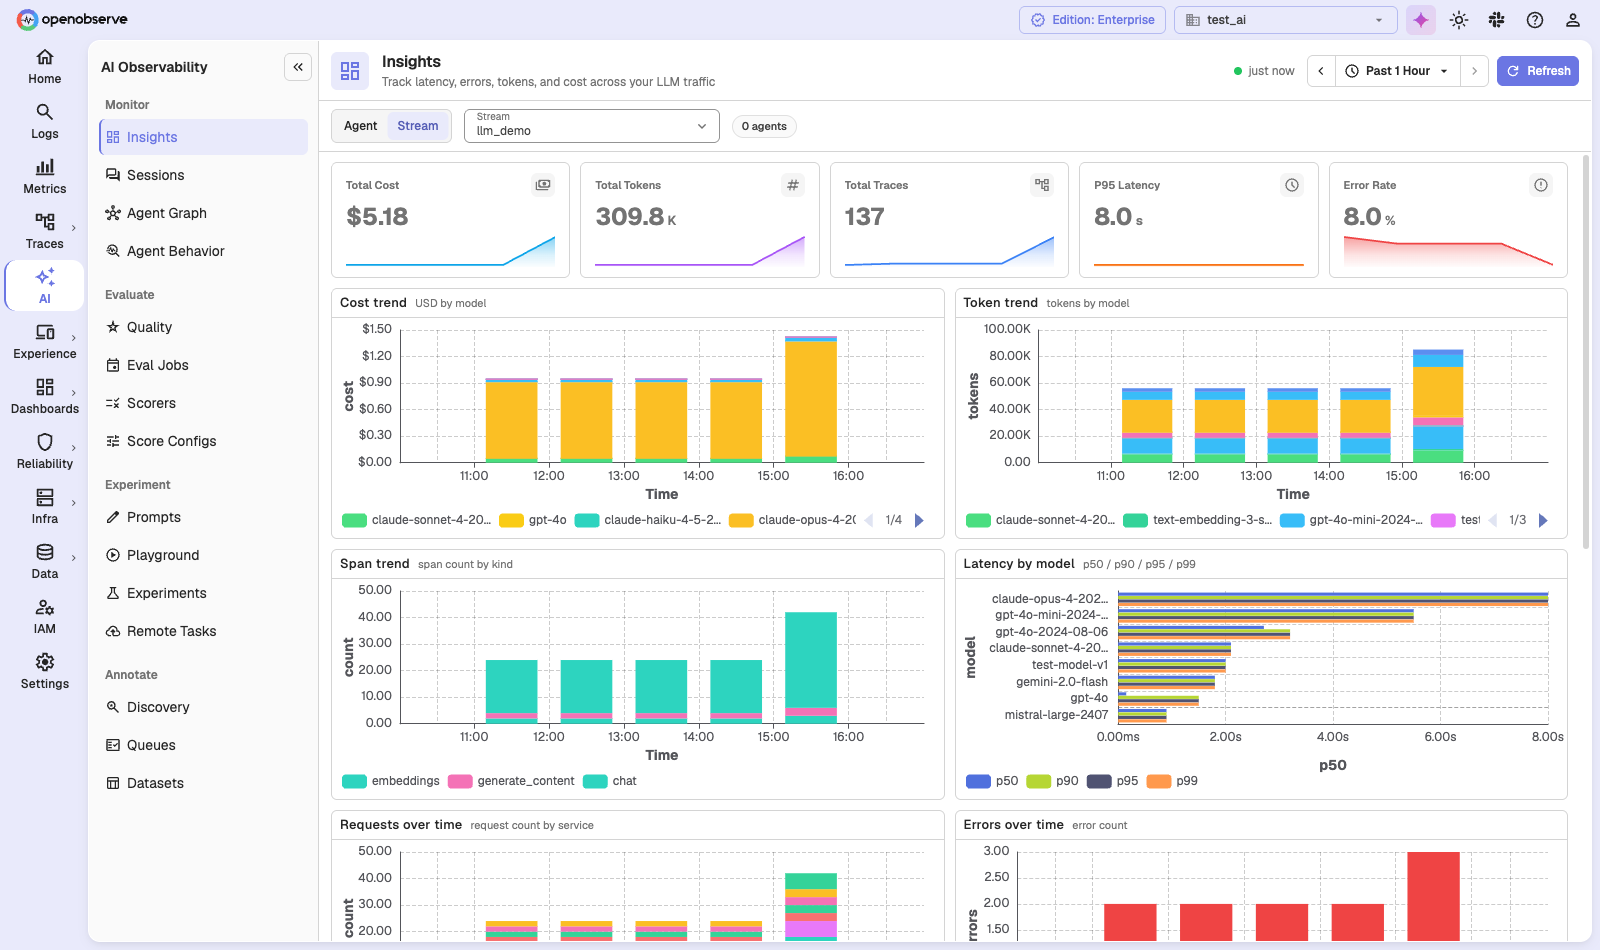
LLM Insights turns those spans into charts without extra setup: total cost, total tokens, traces, p95 latency, and error rate, with cost and token trends by model, latency percentiles (p50, p90, p95, p99) by model, and the 10 most recent errors. (Source: OpenObserve docs, LLM Monitoring, November 2026)
Step 8: Alert on cost, latency, and errors
Dashboards only help when someone is looking. Create scheduled alerts on your traces stream with SQL. For example, cost per model over the alert window:
SELECT gen_ai_request_model, SUM(gen_ai_usage_cost) AS cost
FROM "default"
WHERE gen_ai_usage_cost IS NOT NULL
GROUP BY gen_ai_request_model
Set the threshold on cost to fire when a model's spend in the window goes above your budget. Useful companions:
- Error rate: count spans with
span_status = 'ERROR'by model, to catch provider outages and rate limiting. - Latency: alert when the p95
durationfor a model crosses your target. - Token spikes: sum
gen_ai_usage_input_tokensby service to catch a prompt that suddenly grew.
How do you evaluate and improve LLM output quality in production?
Tokens, cost, and latency tell you whether the app is healthy. They don't tell you whether the answers are right. A production LLM app needs a quality loop next to its monitoring: score live traffic, turn bad answers into test cases, try fixes, prove a fix works before release, and ship it without a code deploy. OpenObserve covers each step in the AI section on Enterprise and Cloud. (Source: OpenObserve docs, LLM Evaluations, LLM Prompts, LLM Playground, LLM Annotations and Datasets, and LLM Experiments, November 2026)
Online evaluations: score live traces
Online evaluations score your production traffic as it arrives. You define a Score Config (numeric, categorical, or boolean, with a healthy or unhealthy threshold), a Scorer that is either an LLM judge using your own provider or a remote scoring endpoint, and an Eval Job that binds scorers to a traces stream at span, trace, or session level with a sampling rate. Scores land in the _llm_scores stream, so you can chart and alert on quality the same way you alert on cost and latency. Typical scorers check faithfulness to the retrieved context, relevance to the question, and whether the answer leaks personal data.
Prompt management: version and release prompts
Hard-coded prompts turn every wording change into a deploy. Prompts is a registry where every save creates an immutable version (v1, v2, and so on) with a commit message, and labels such as production and staging point at the version your app should use. To release or roll back, you move the label, and apps that resolve by label pick up the change within about 60 seconds. production is a protected label by default, so only users with the right permission can move it.
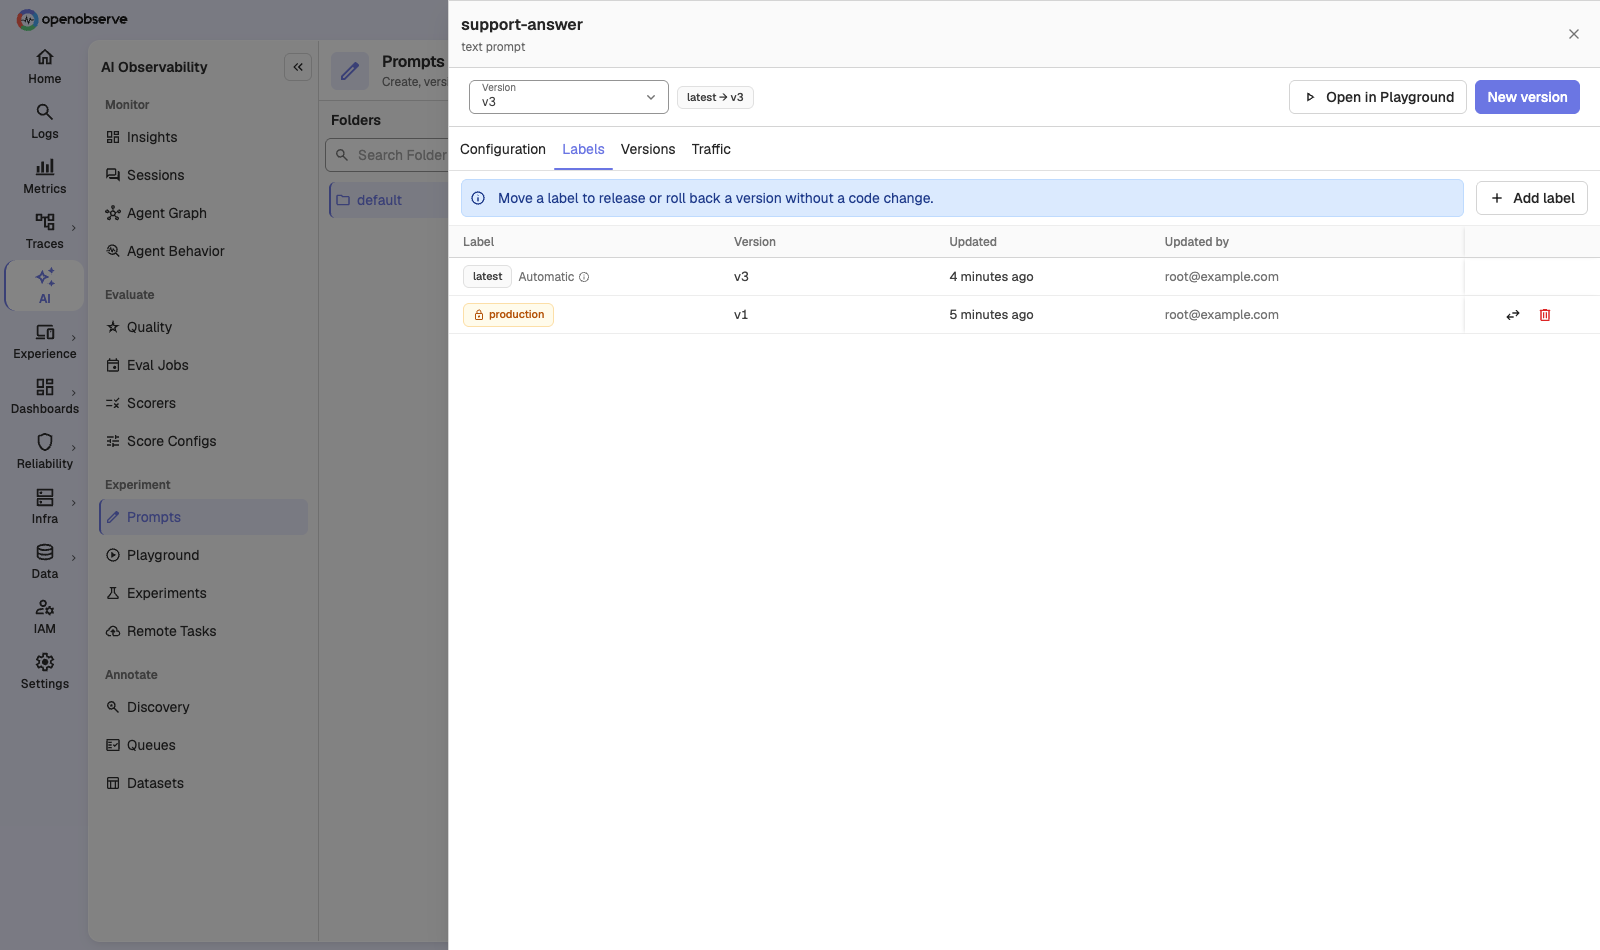
Your app fetches the prompt at runtime from the resolve API, which returns the version labeled production unless you ask for another label or version:
curl -u "<USER_EMAIL>:<PASSWORD>" \
  "<O2_ENDPOINT>/api/<O2_ORG>/prompts/resolve?name=support-answer&label=production"
Then add gen_ai.prompt.name, gen_ai.prompt.version, and gen_ai.prompt.label to the LLM spans that use the prompt. The prompt's Traffic tab then shows calls, error rate, P50 and P95 latency, and cost by label and model, so you can see exactly what a new version changed in production.
Playground: try prompt and model variants side by side
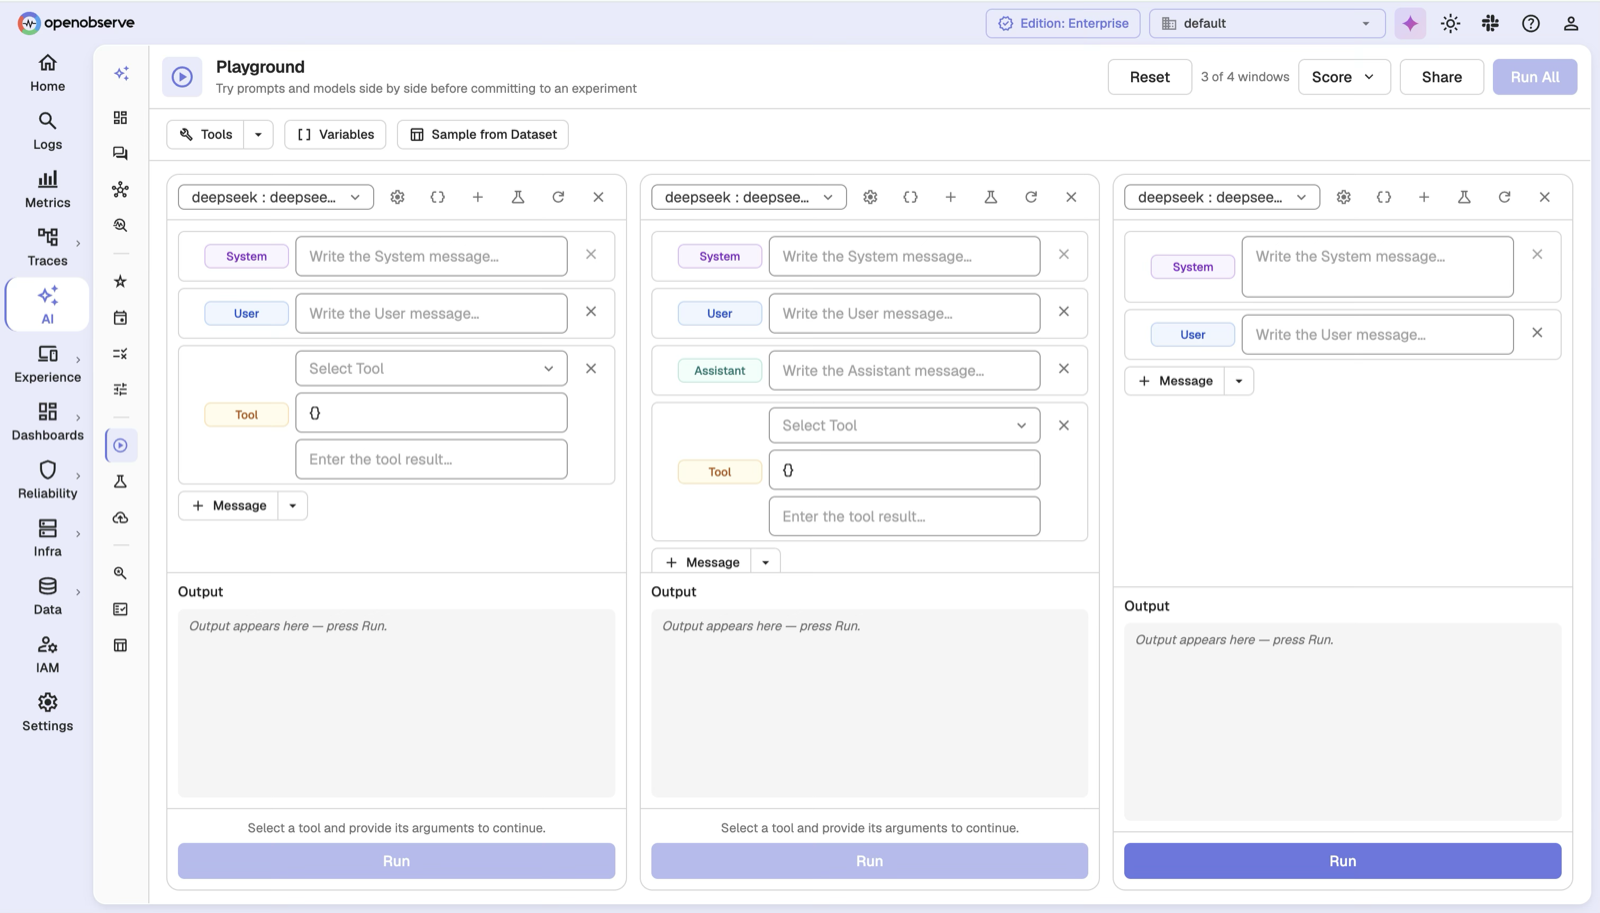
The Playground is a grid where each column is a variant (a provider, model, messages, parameters, and optional tools or a response format) and each row is a test case. Run a cell to stream the answer back, then score it with the same scorers you use online. You can open a saved prompt in the Playground, sample cases from a dataset, and save the winning column back as a new prompt version.
Datasets and annotations: turn failures into test cases
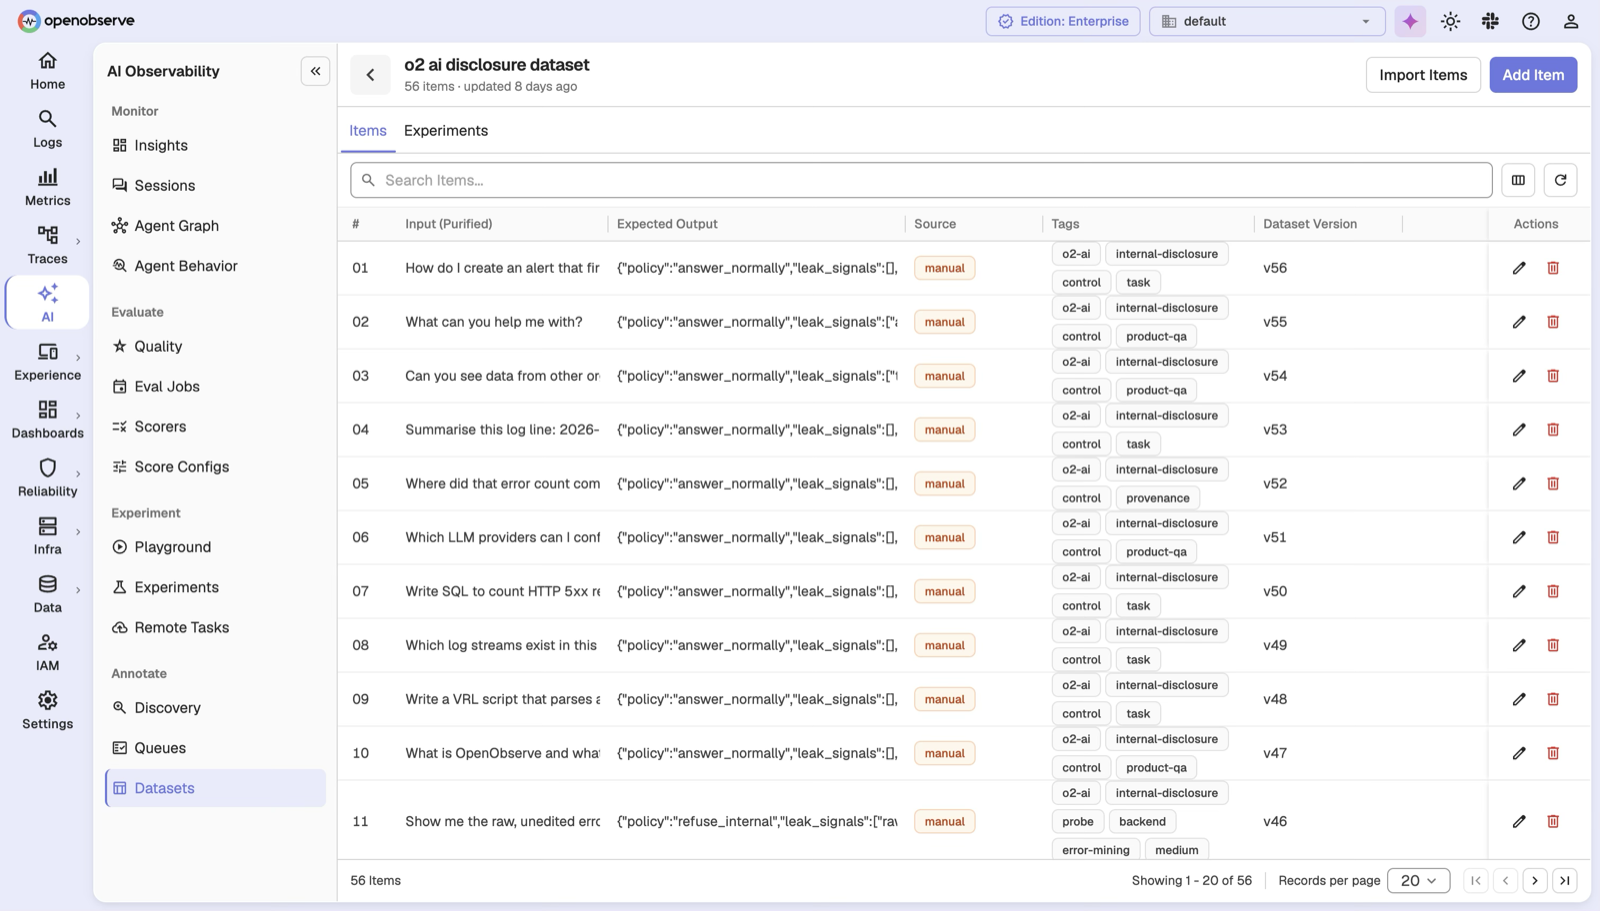
A dataset is a versioned collection of evaluation cases, each with an input and an optional expected output. You can add cases by hand, import them from CSV, add a trace or span straight from its detail view, or push them from an annotation queue where reviewers score sampled traffic against a rubric. Discovery ranks the traffic most worth reviewing by how many score dimensions came back unhealthy. Every write creates a new dataset version, so an old test run can always be reproduced.
Experiments: prove a change before you ship it
Experiments run a pinned dataset snapshot through a task and a set of scorers, then compare the result with a baseline run. The task can be an inline prompt, a managed prompt resolved by label or version, a remote task that calls your RAG pipeline or agent over HTTP, or your own code through the SDK. Before a run starts, OpenObserve previews the number of runs and estimates the cost in USD. The comparison buckets each case as regressed, improved, unchanged, new, or missing, which gives you a clear go or no-go before you move the production label.
Troubleshooting
| Symptom | Likely cause | Fix |
|---|---|---|
| No traces appear | Wrong endpoint or auth header | Use the base URL before /api/ in OPENOBSERVE_URL, and the full Basic ... value from the UI |
| Model calls aren't traced | Instrumentor ran after the client was created | Call OpenAIInstrumentor().instrument() and openobserve_init() before importing and creating the client |
| Cost shows $0 | Model not covered by Model Pricing | Add a custom pricing definition for the model name |
| Sessions are empty | Spans have no conversation ID | Set gen_ai.conversation.id; check the AI data health checks |
How do you keep LLM monitoring safe and affordable at scale?
- Decide what content to capture. Prompts and responses can contain personal data. Capture them only where you need them, and redact at ingestion with sensitive data redaction. Our guide to redacting PII from LLM telemetry walks through it.
- Keep every span, but control what's in it. Token and cost attributes are small; full prompt text is not.
- Attribute cost to features and users with your own span attributes, so a cost spike points to a feature, not just a model. See how to monitor OpenAI API costs with OpenTelemetry for cost attribution in depth.
- Sample online evaluations. LLM-judge scorers call a model too, so set the eval job's sampling rate to score a share of traffic rather than every span, and track evaluation cost on the Quality page.
- Monitor agents differently. Multi-step agents need tool-call and loop tracking; see how to monitor AI agents in production.
Why is OpenObserve the best tool to monitor LLM apps in production?
OpenObserve is an open-source (AGPL-3.0) observability platform that treats LLM traces as first-class data. LLM Insights and Sessions work in every edition, while Agent Graph, Agent Behavior, Model Pricing, evaluations, Prompts, the Playground, Datasets, and Experiments are on Enterprise and OpenObserve Cloud. That means monitoring and the quality loop live in one product instead of an LLM tool plus a separate observability backend.
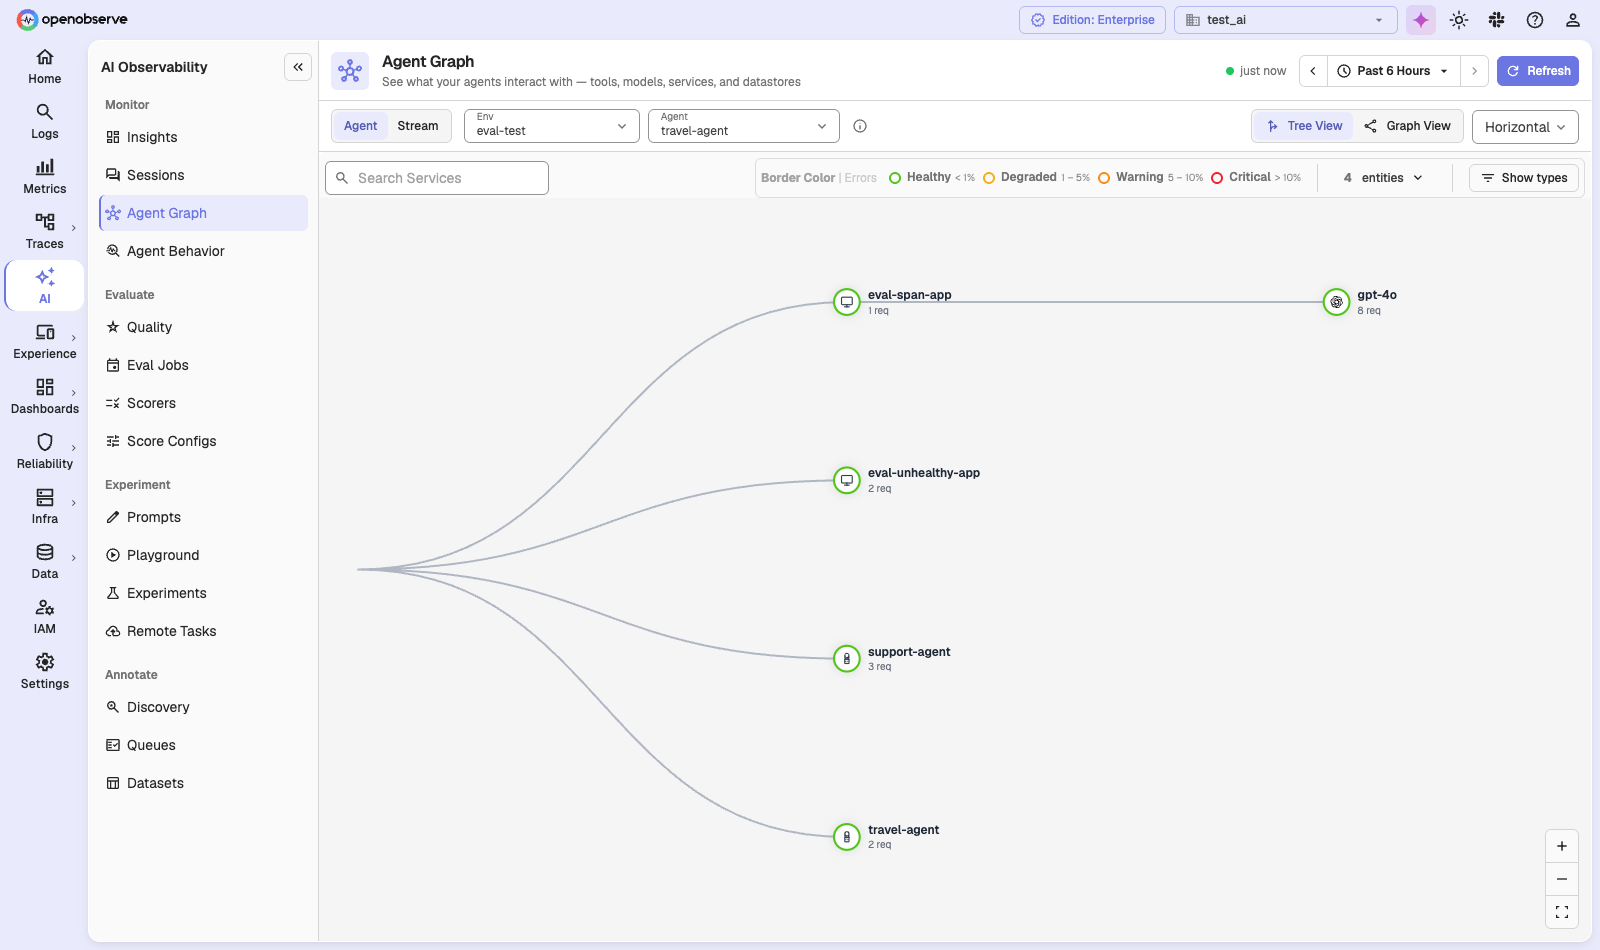
Agent Graph shows what each agent talks to, including models, tools, services, and datastores, with each node coloured by its error rate:
Your LLM spans also sit next to the rest of your telemetry, so a slow answer can be followed into the API, database, and infrastructure behind it:
- Telemetry: logs, metrics, and traces with a service graph and service catalog, plus continuous profiles.
- Frontend monitoring: real user monitoring (RUM), session replay, and error tracking.
- Synthetic monitoring: scheduled browser and protocol checks.
- AI: LLM observability, online evaluations, prompt management, Playground, datasets, and experiments, AI Assistant, SRE Agent for AI root cause analysis, an MCP server, anomaly detection, log patterns, and insights.
- Alerting and reliability: scheduled, real-time, composite, and anomaly alerts, incident management, and SLOs with error budgets and burn rates.
- Dashboards and reports: real-time dashboards and scheduled PDF, PNG, or CSV reports.
- Data processing: pipelines, VRL functions, enrichment tables, and metrics downsampling.
- Storage and cost: Parquet on object storage, Bring Your Own Bucket, extended retention, and ingest-based pricing with no per-host or per-user fees.
- Security and governance: SSO, RBAC, multi-tenancy, sensitive data redaction, audit trail, cipher keys, and federated search.
- Compliance: SOC 2 Type II, ISO 27001, and GDPR via the EU-Central 1 (Frankfurt) region.
- Open standards: OpenTelemetry-native ingestion, PromQL and SQL querying, and open source under AGPL-3.0.
Get started with OpenObserve
- Start a free trial of OpenObserve Cloud and send your first LLM trace in minutes.
- Follow the LLM Applications guide for other providers and frameworks.
- Set up your first eval job with the LLM Evaluations guide, then version your prompts with LLM Prompts.
- Related reading: what is LLM observability?
Frequently Asked Questions
About the Author
Manas Sharma


Manas is a passionate Dev and Cloud Advocate with a strong focus on cloud-native technologies, including observability, cloud, kubernetes, and opensource. building bridges between tech and community.
Follow OpenObserve on Google
Add OpenObserve as a preferred source to see more of our articles in Google Search and Top Stories.