Grafana plugin
Grafana is a dashboarding and graphing application, initially built for time series data, but has evolved into a tool that can pull data from multiple sources and visualize it in a single dashboard for logs and traces too. It is a popular tool for monitoring and observability.
You DO NOT need grafana for visualizing logs and metrics data from OpenObserve by maintaining one more app. OpenObserve has a very advanced GUI for that, which you can use for logs, metrics, traces, front end monitoring, dashboards and alerting. You could however use grafana if you are already using it for some of your needs e.g. monitoring metrics using prometheus and are comfortable using it and don't want to change. In this case you can use OpenObserve grafana plugin to visualize logs and metrics data from OpenObserve in your grafana dashboard. You can also use grafana explore tool to query adhoc logs and metrics data from OpenObserve. You could also use OpenObserve as a prometheus source in grafana and use grafana to visualize metrics data from OpenObserve.
Below are the steps to install and configure the plugin. We will provide guide on how to set up grafana in a kubernetes environment. You can adapt these steps to set up grafana in a non-kubernetes environment.
If you are already familiar with grafana plugin installation, you can download the plugin from here and get started or follow the below steps.
Install Grafana
Grafana requires a persistent store to store its data and configuration. While configuration can be stored in a configmap or secret, data needs to be stored in a database. Grafana supports sqlite, mysql and postgres. Most installations I have seen in the wild use a single node grafana installation using sqlite. I have also seen that many of these use a kubernetes deployment .
If you are using a single node grafana installation using sqlite then you should use statefulset instead of deployment so you do not lose your data when the pod restarts. If you are using mysql/postgres then you can use deployment as the data is stored in the database.
You would also need a grafana.ini config file to configure grafana. You can use the below minimalistic working grafana.ini file to start. You can add more configuration as needed.
Configuration
| grafana.ini | |
|---|---|
Line 4 should be updated with the root url of your grafana installation. This is the url that you will use to access grafana. e.g. https://grafana.yourdomain.com
Line 9 is the one that is important where we specify that grafana should use the unsigned plugin zinclabs_openobserve. This is the plugin that we will install using the init container in the statefulset.
Once you have created the file, you can create a kubernetes secret using the below command.
Deployment
Now let's install grafana.
We are using an init container in this case to download and configure openobserve plugin for the grafana container.
Now let's install the statefulset using the below command.
Using Grafana plugin
Set up data source
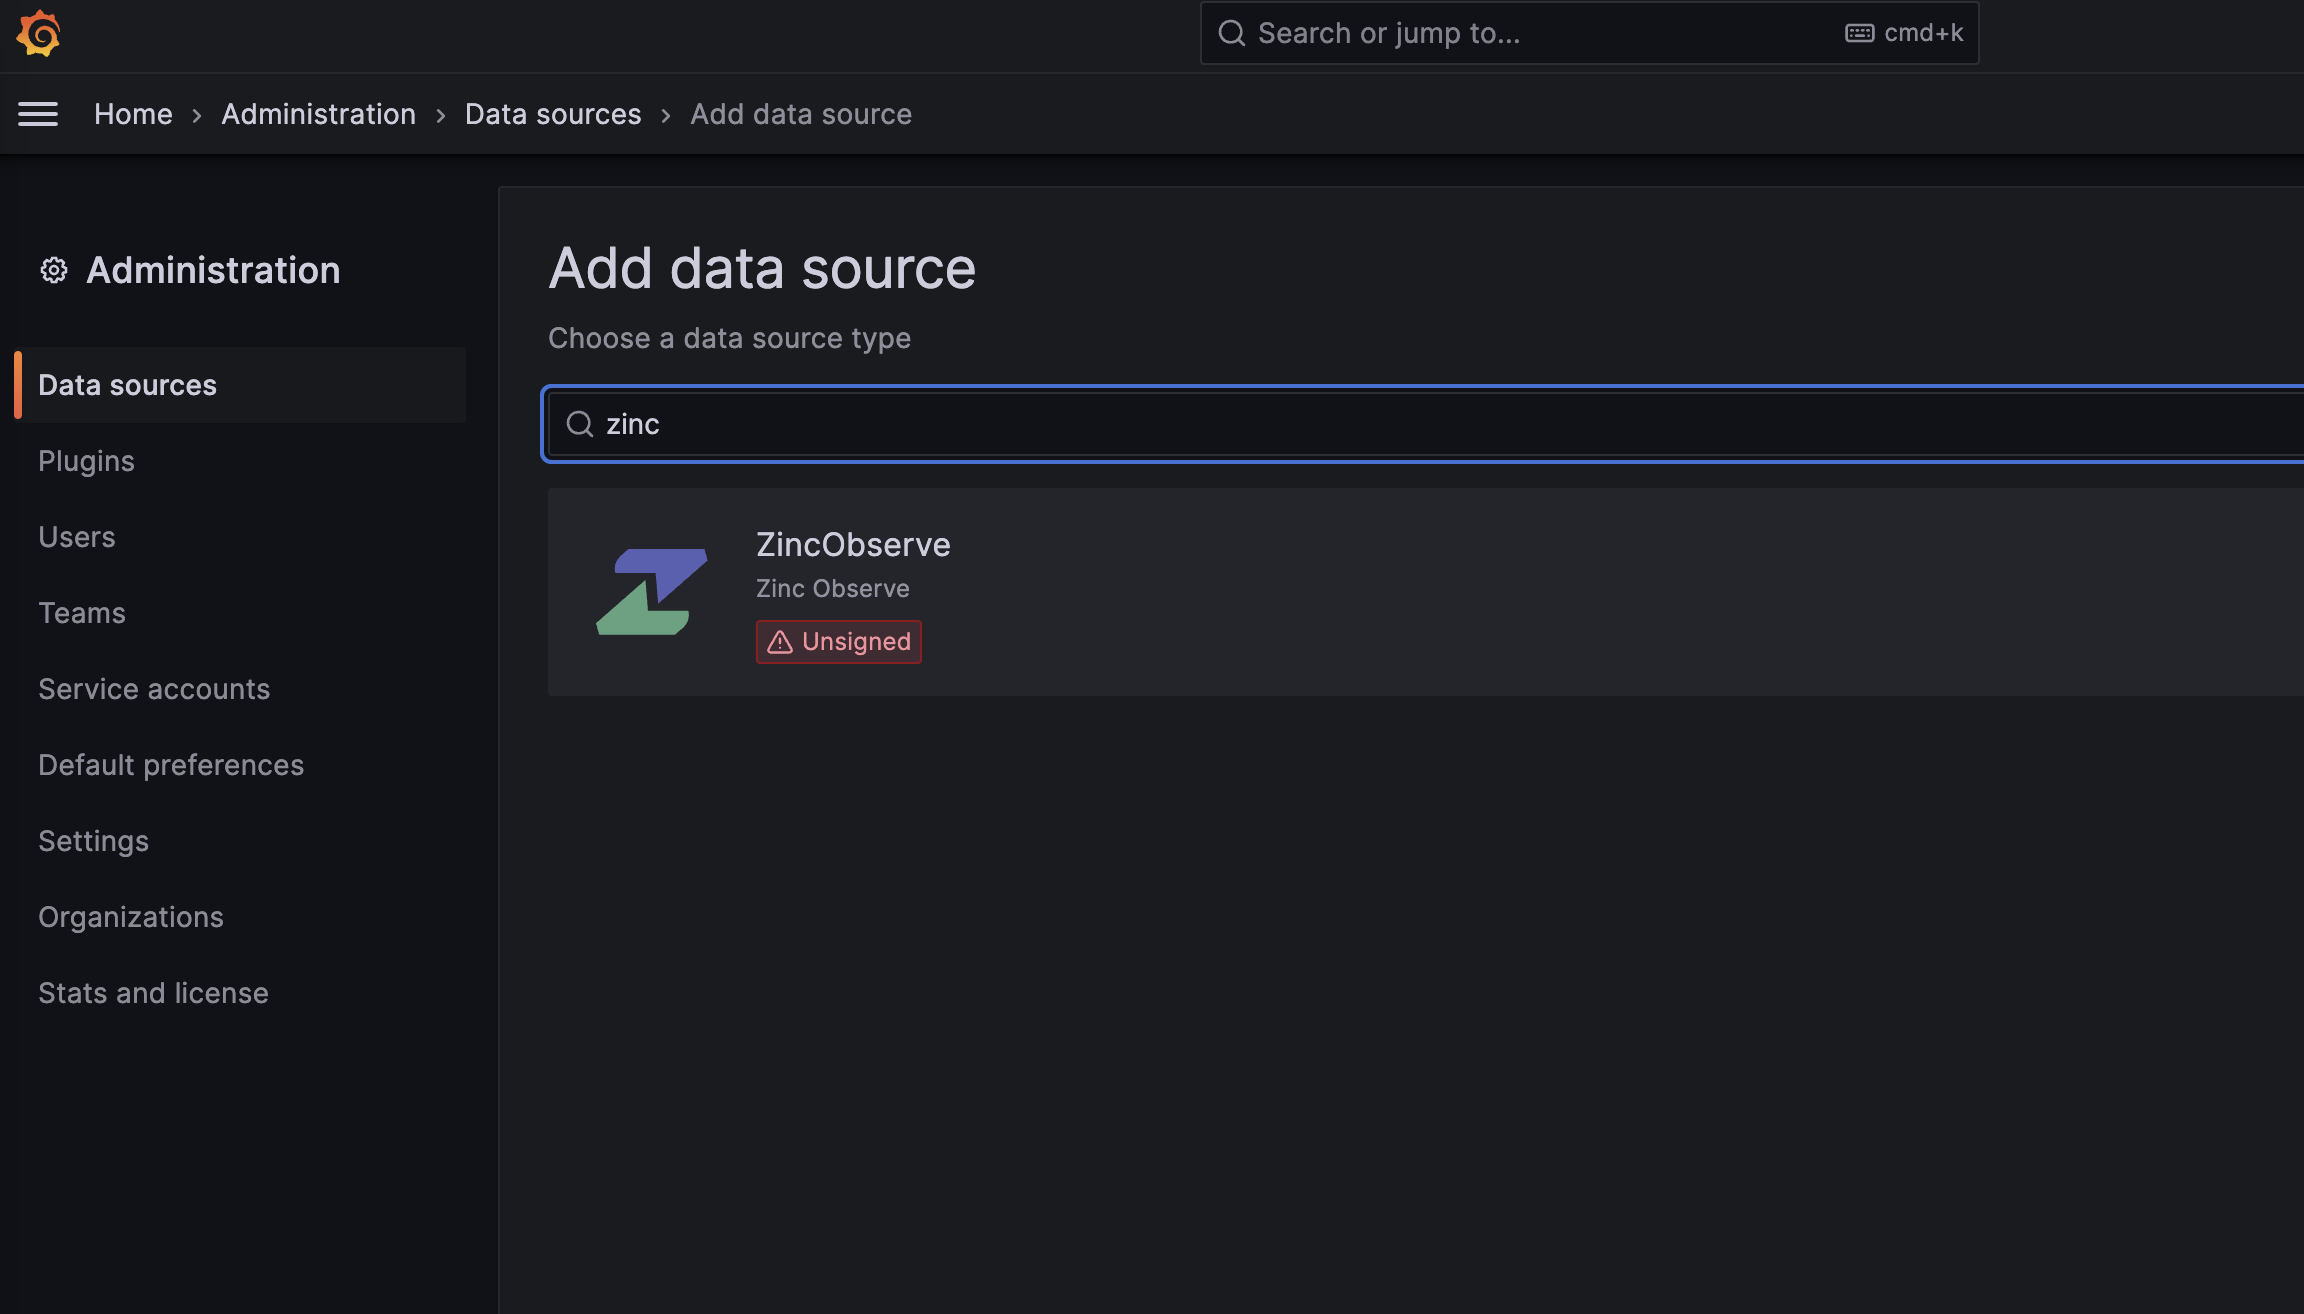
Once grafana starts you could go to the data sources section and search for OpenObserve
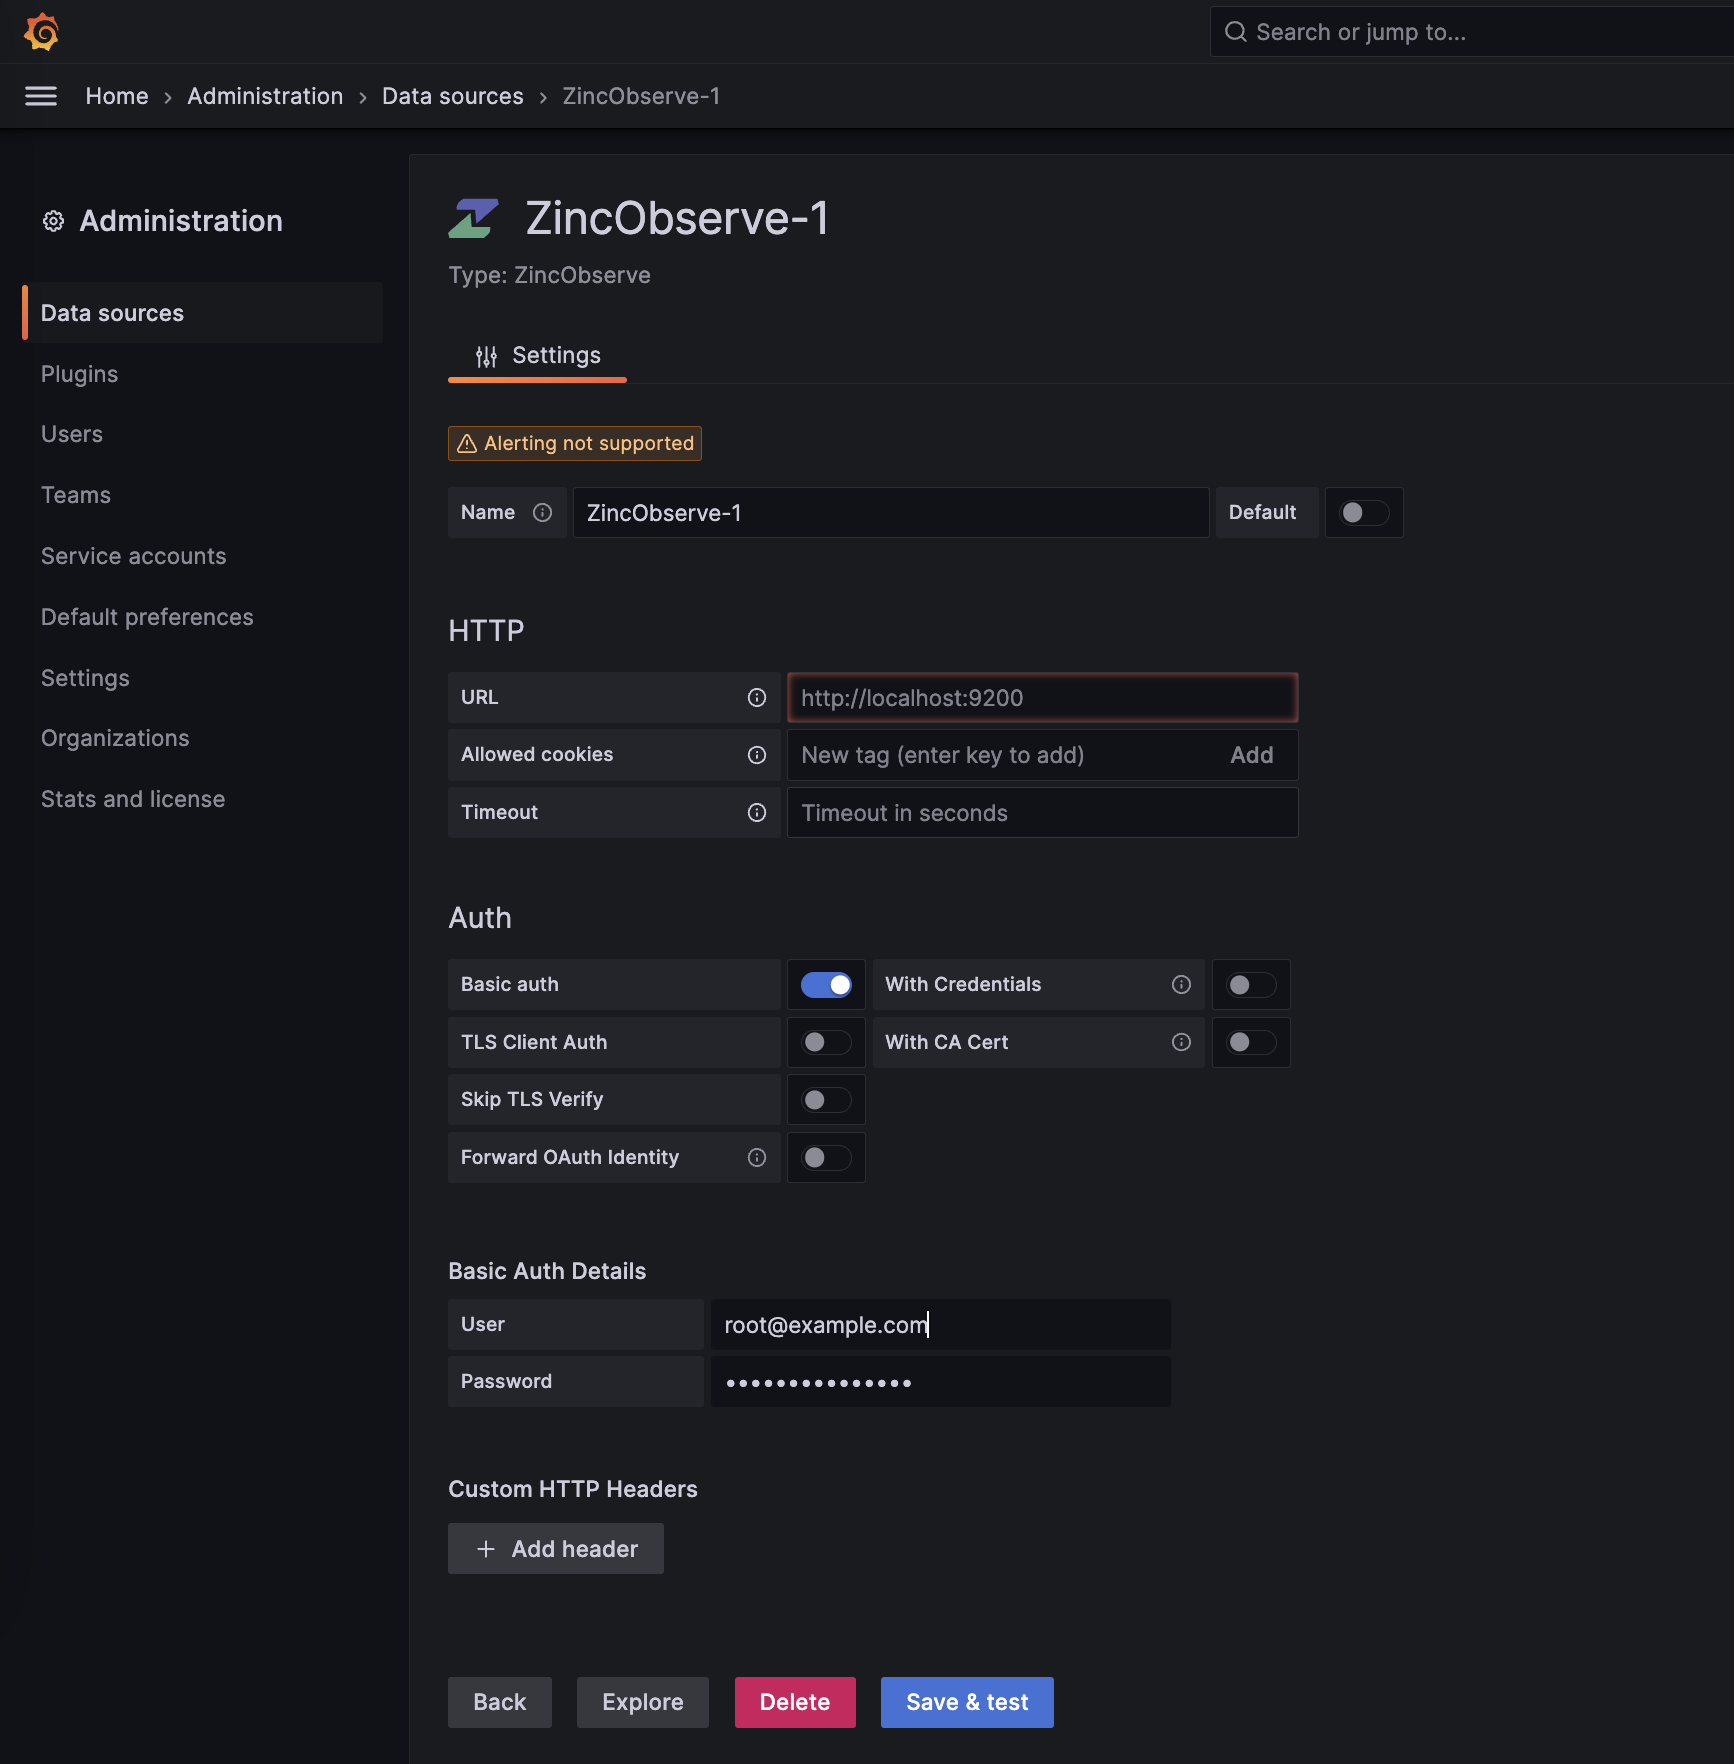
Next let's add OpenObserve data source server details.
You need to do following:
- Update URL
- Enable Basic Auth
- Provide user id and password for basic auth details.
Once you have updated the above, click on Save and Test button. If everything is correct you should see a success message.
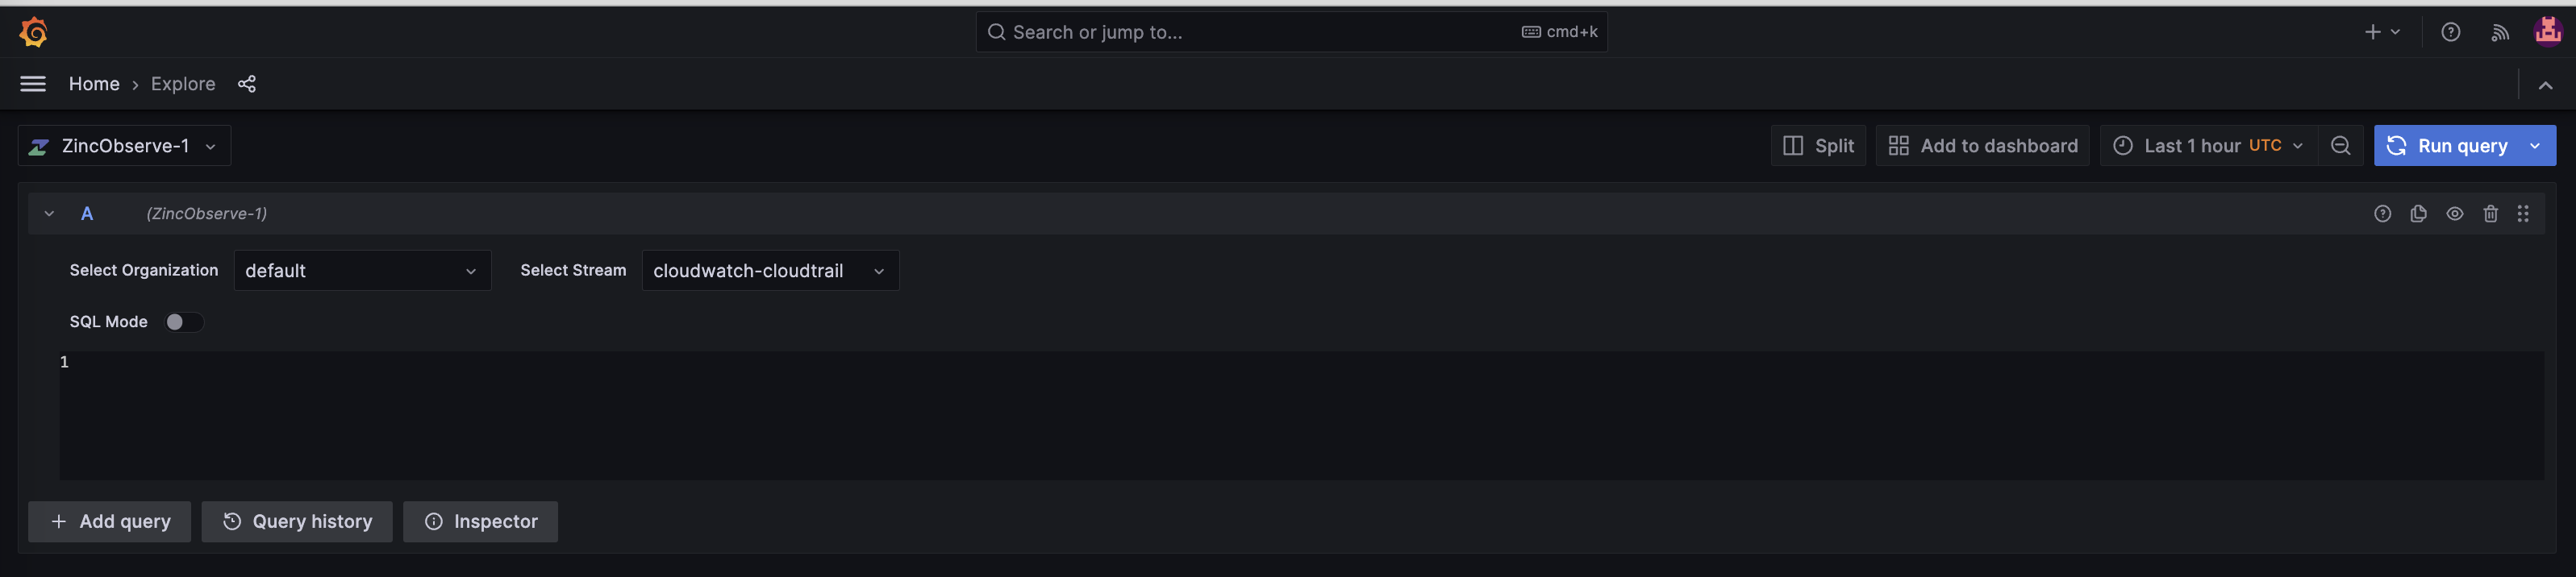
Explore logs
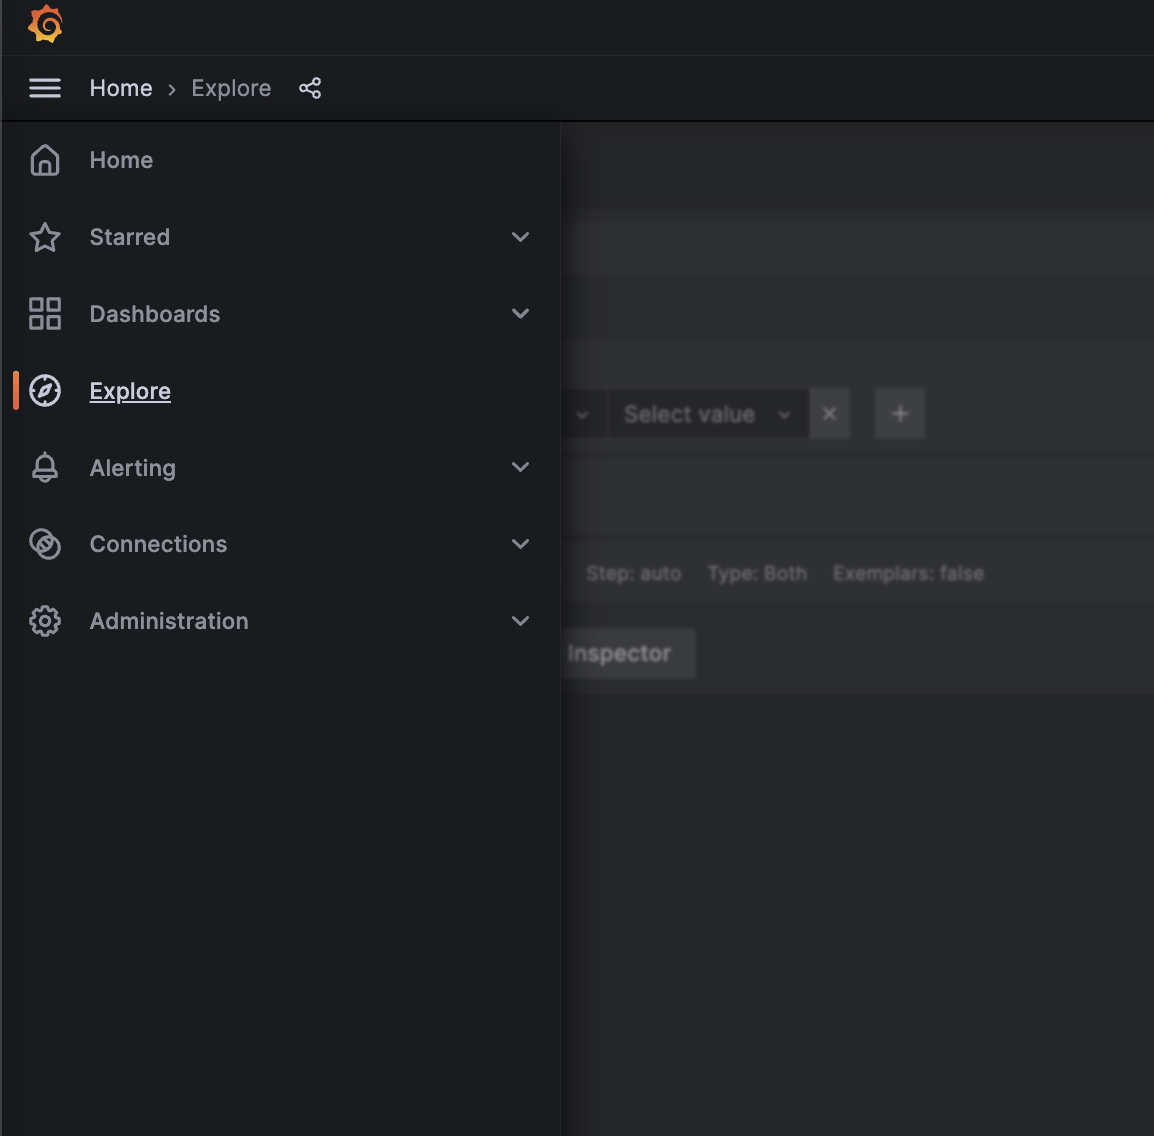
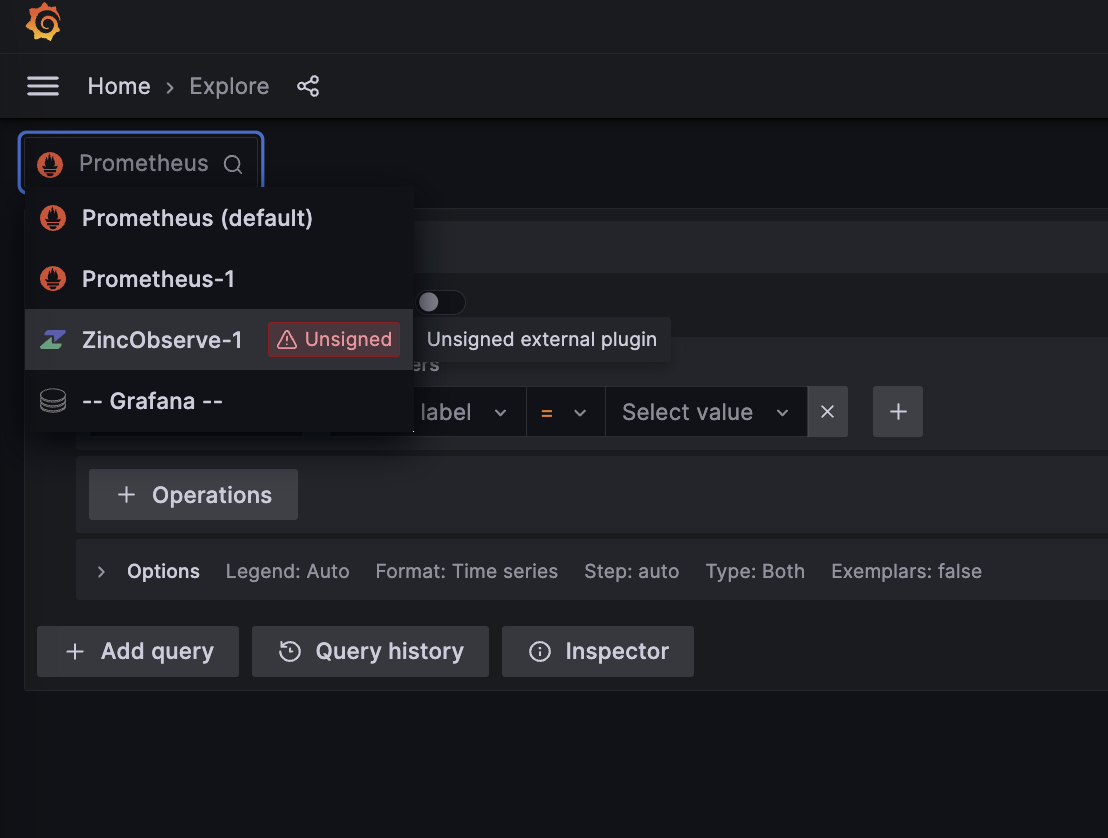
Now let's explore some logs. Click on Explore menu item on the left and select OpenObserve as the data source.
Select appropriate: 1. organization 1. stream 1. time range
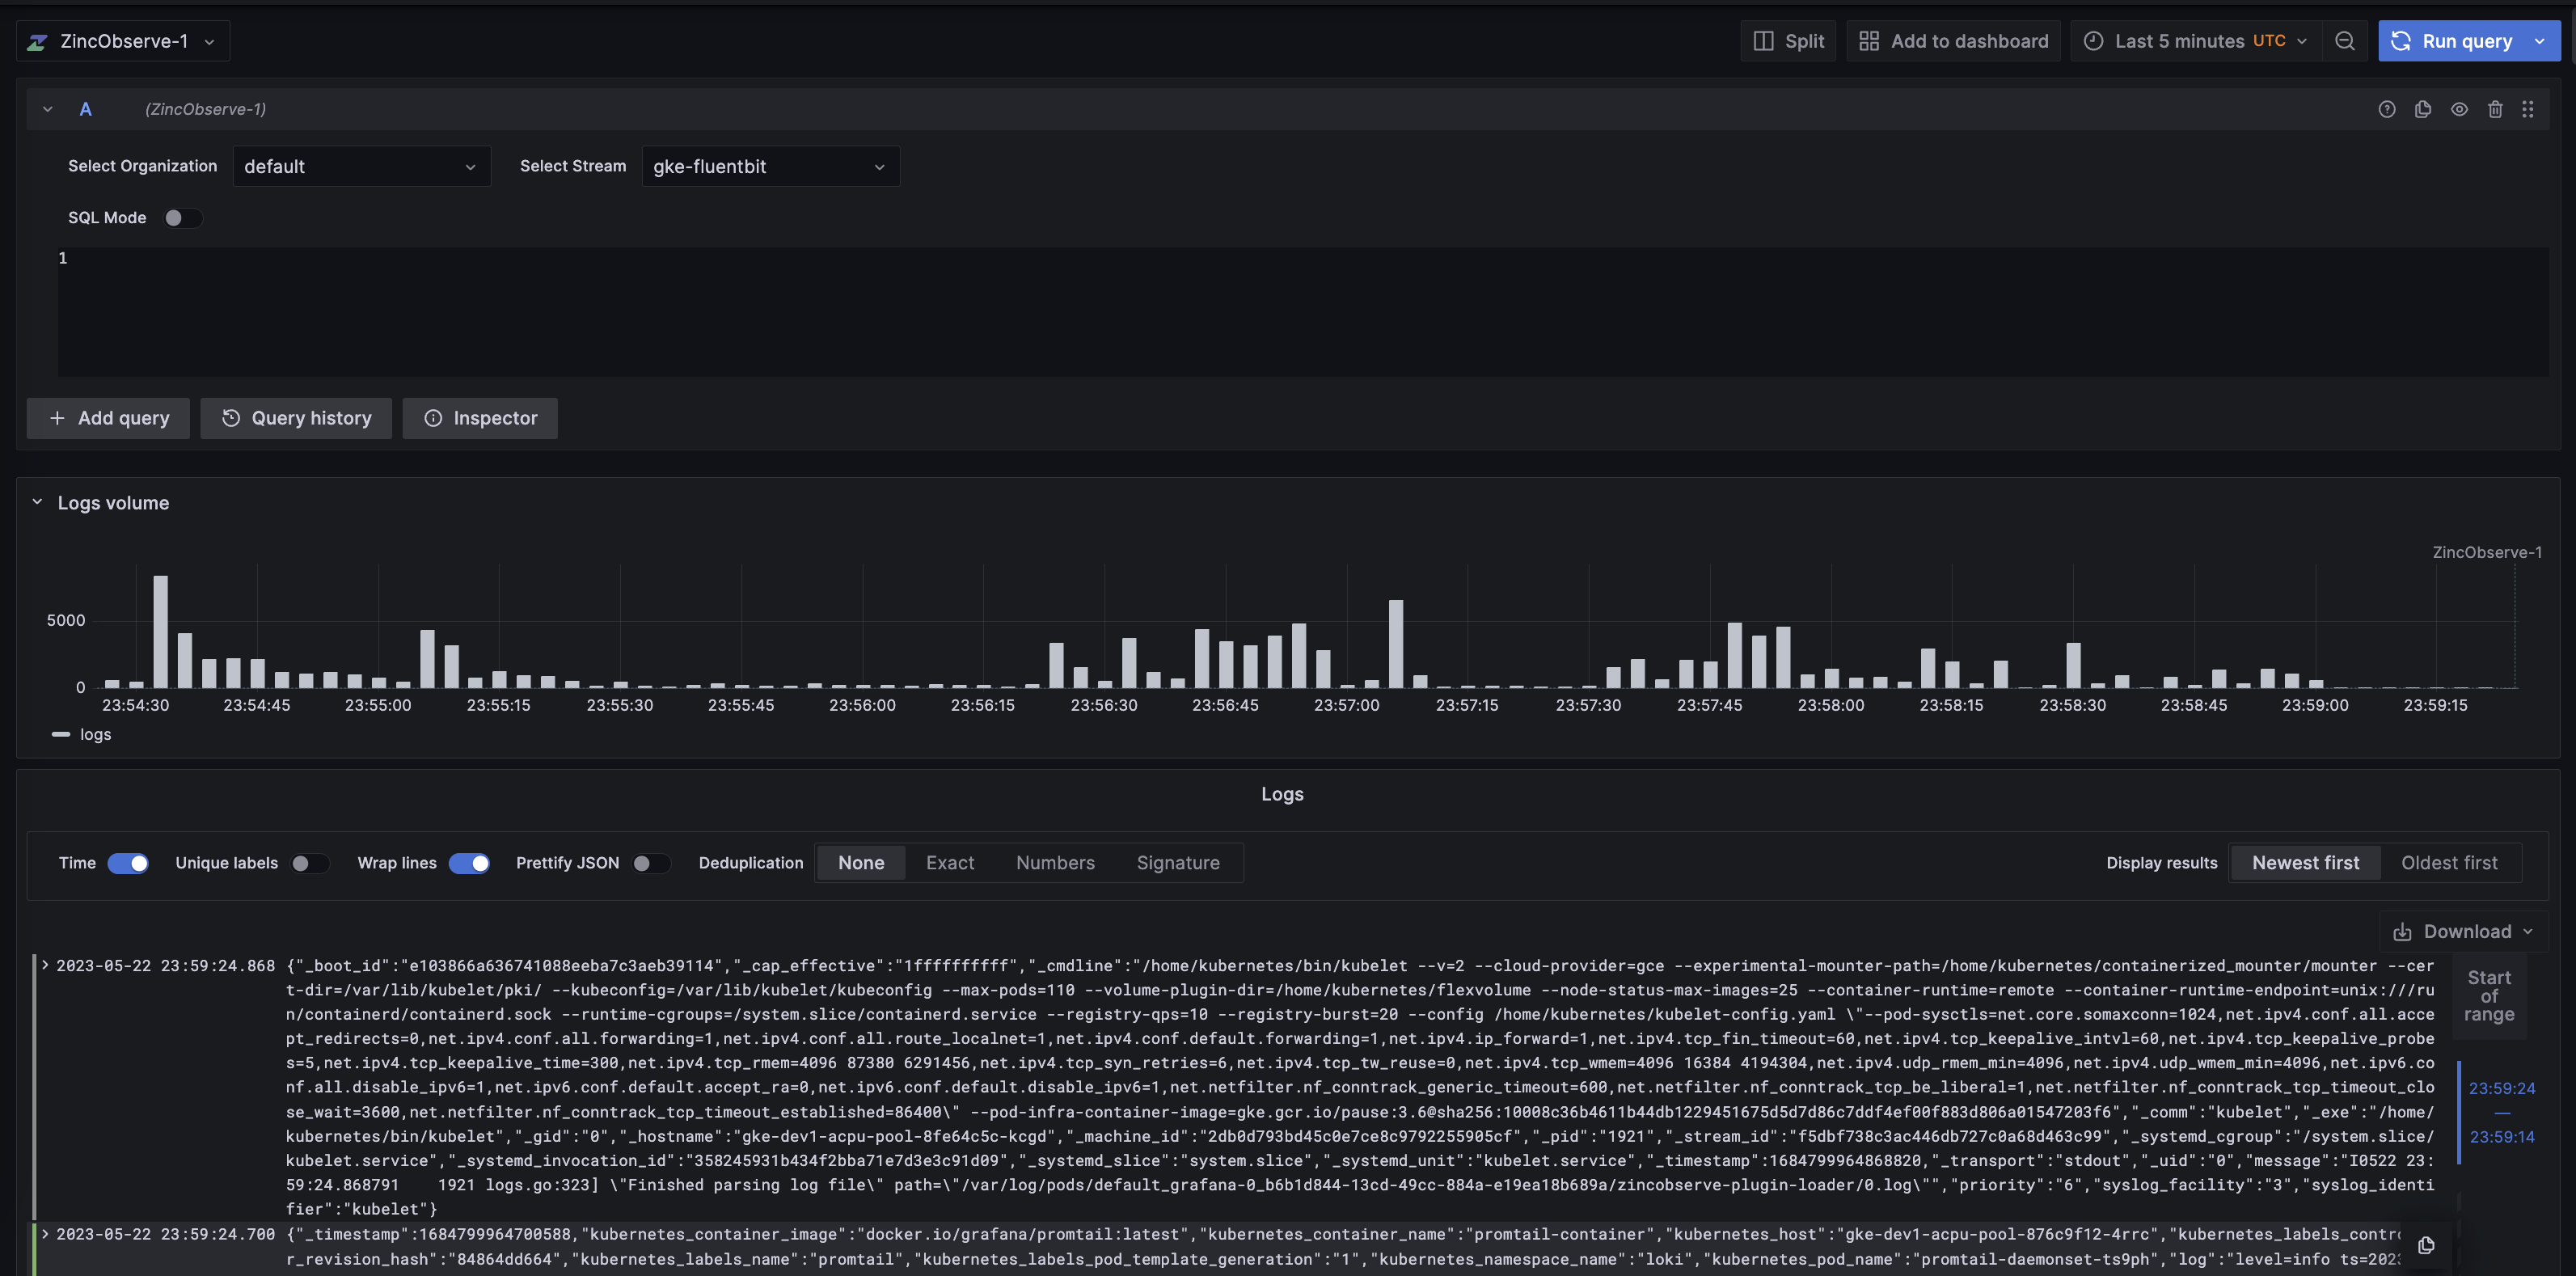
and click on Run Query button. You should see the logs from the stream.
You should now be able to see the results.
If you want to explore metrics from OpenObserve in OpenObserve you can setup grafana as a standard prometheus data source and explore metrics. You do not need the plugin for that as grafana supports prometheus data source out of the box.