OpenObserve Query Examples
We will use the k8s sample logs data to demonstrate the sample queries that you can use.
To ingest this sample data refer to this guide.
Text Search Queries
Search all fields containing the word "error" using full-text index:
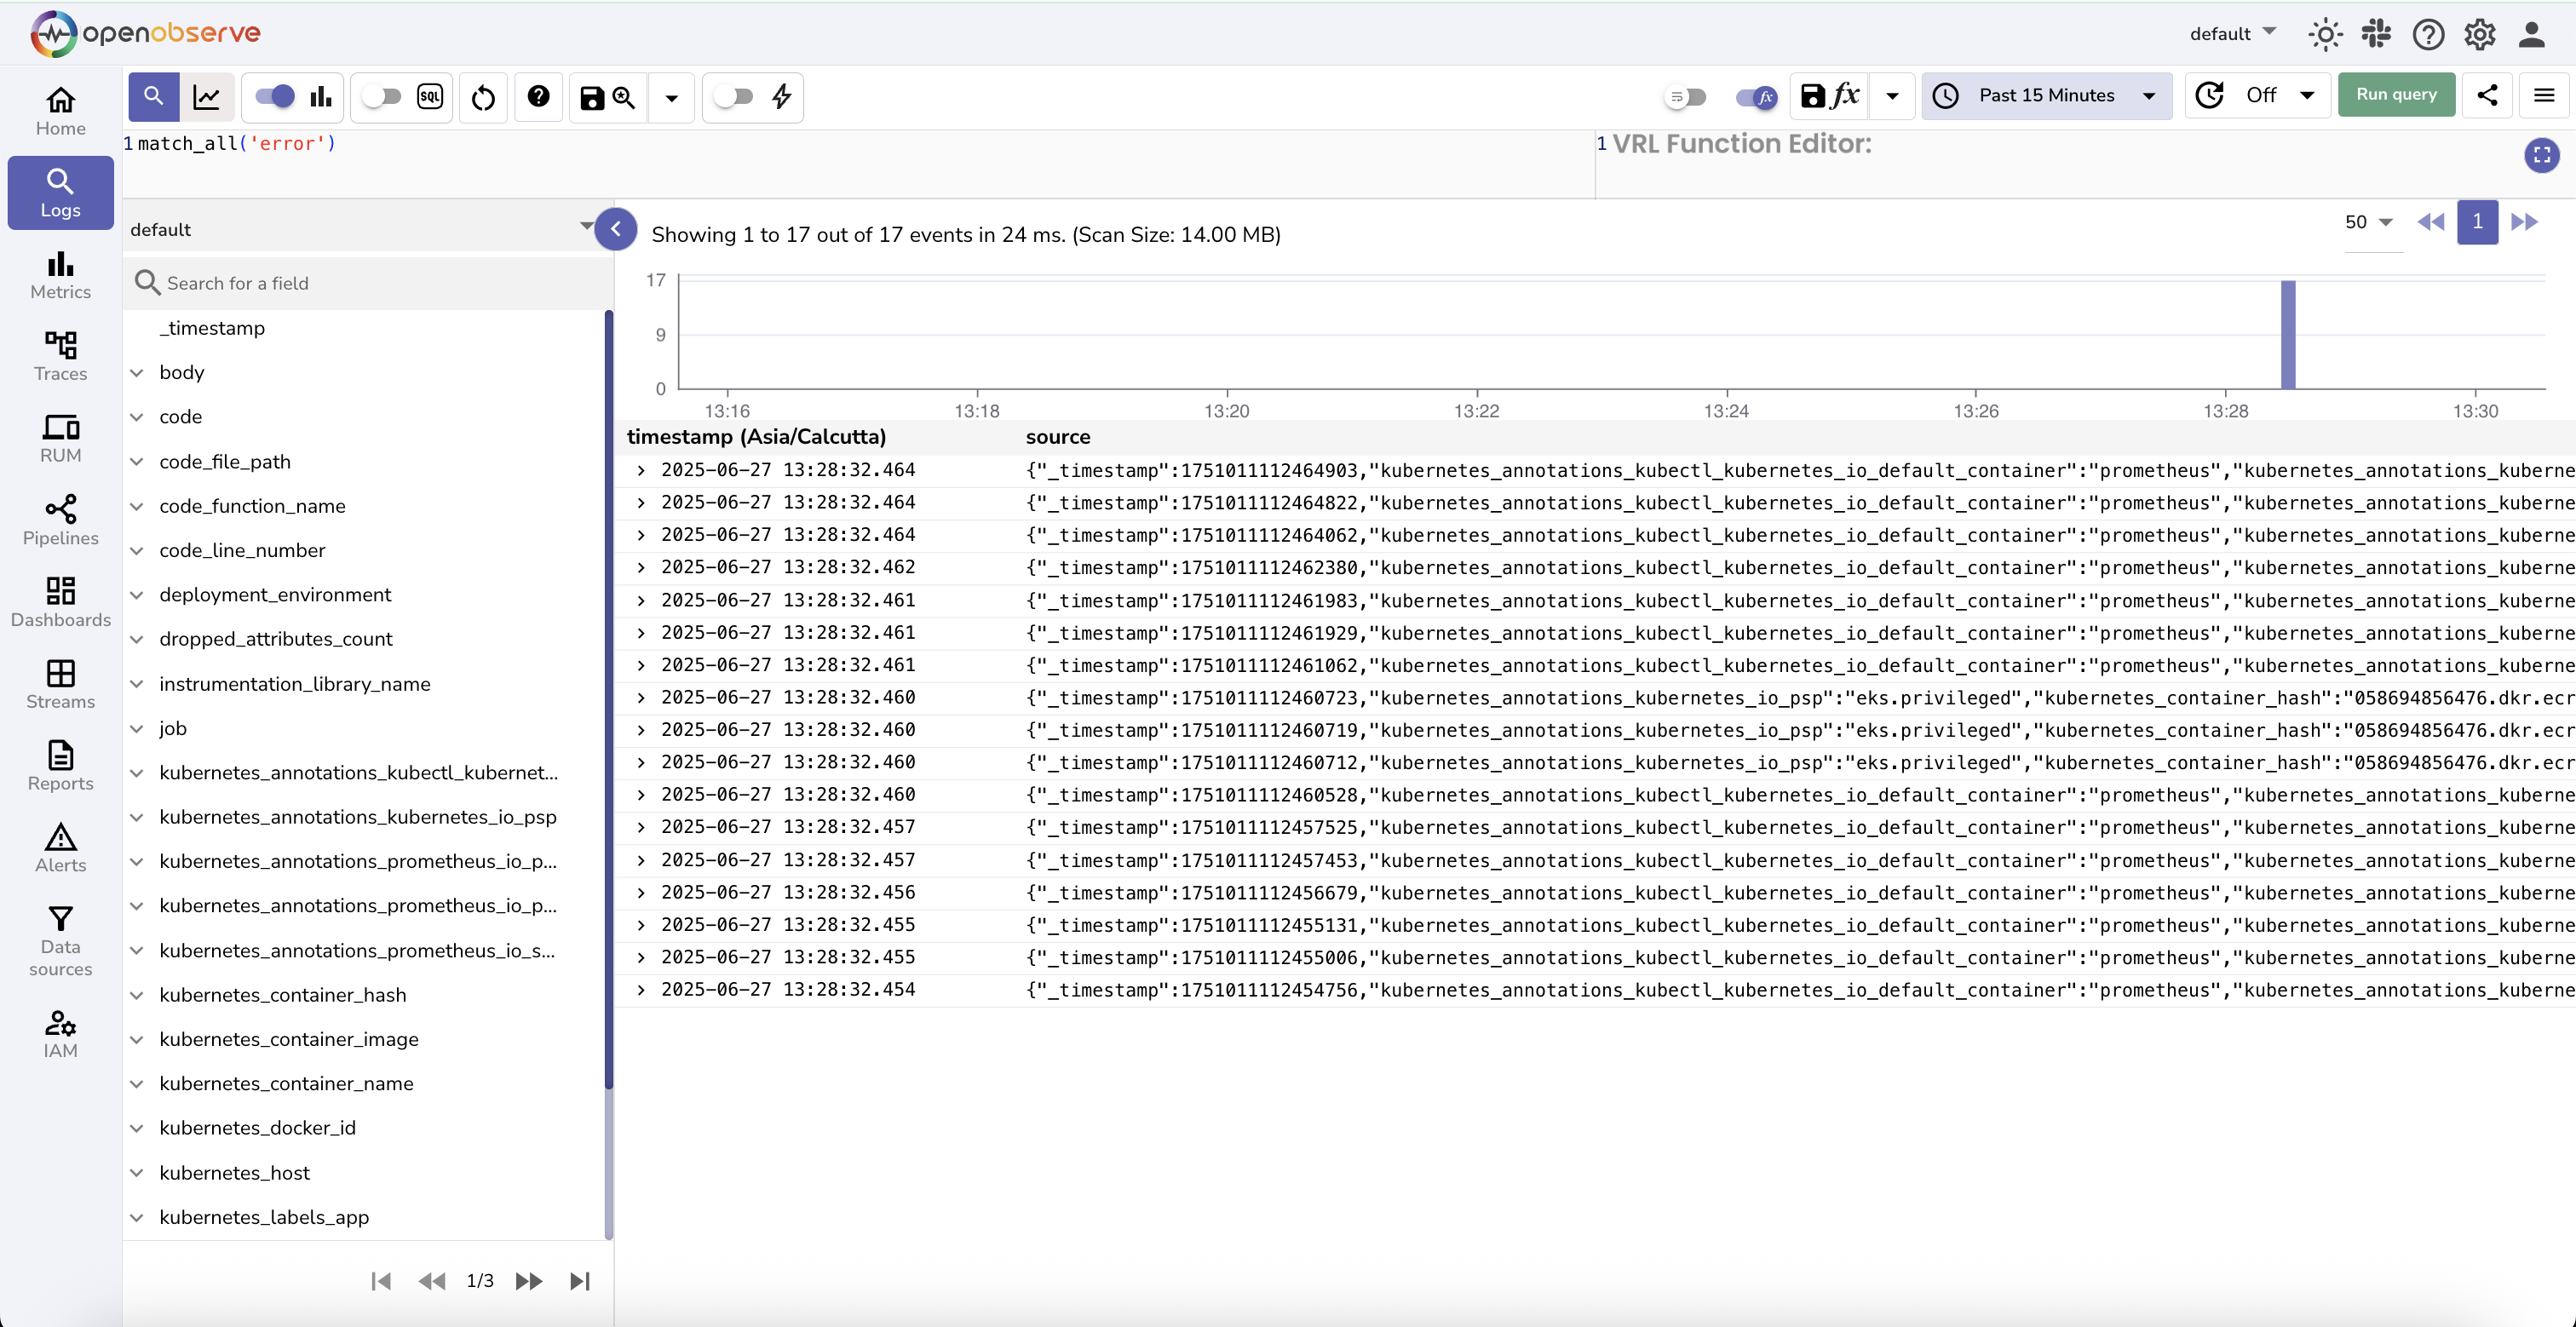
match_allsearches only the fields configured for full-text search. By default, these include:log,message,msg,content,data, andjson.- If you want more fields to be scanned, configure them under stream settings.
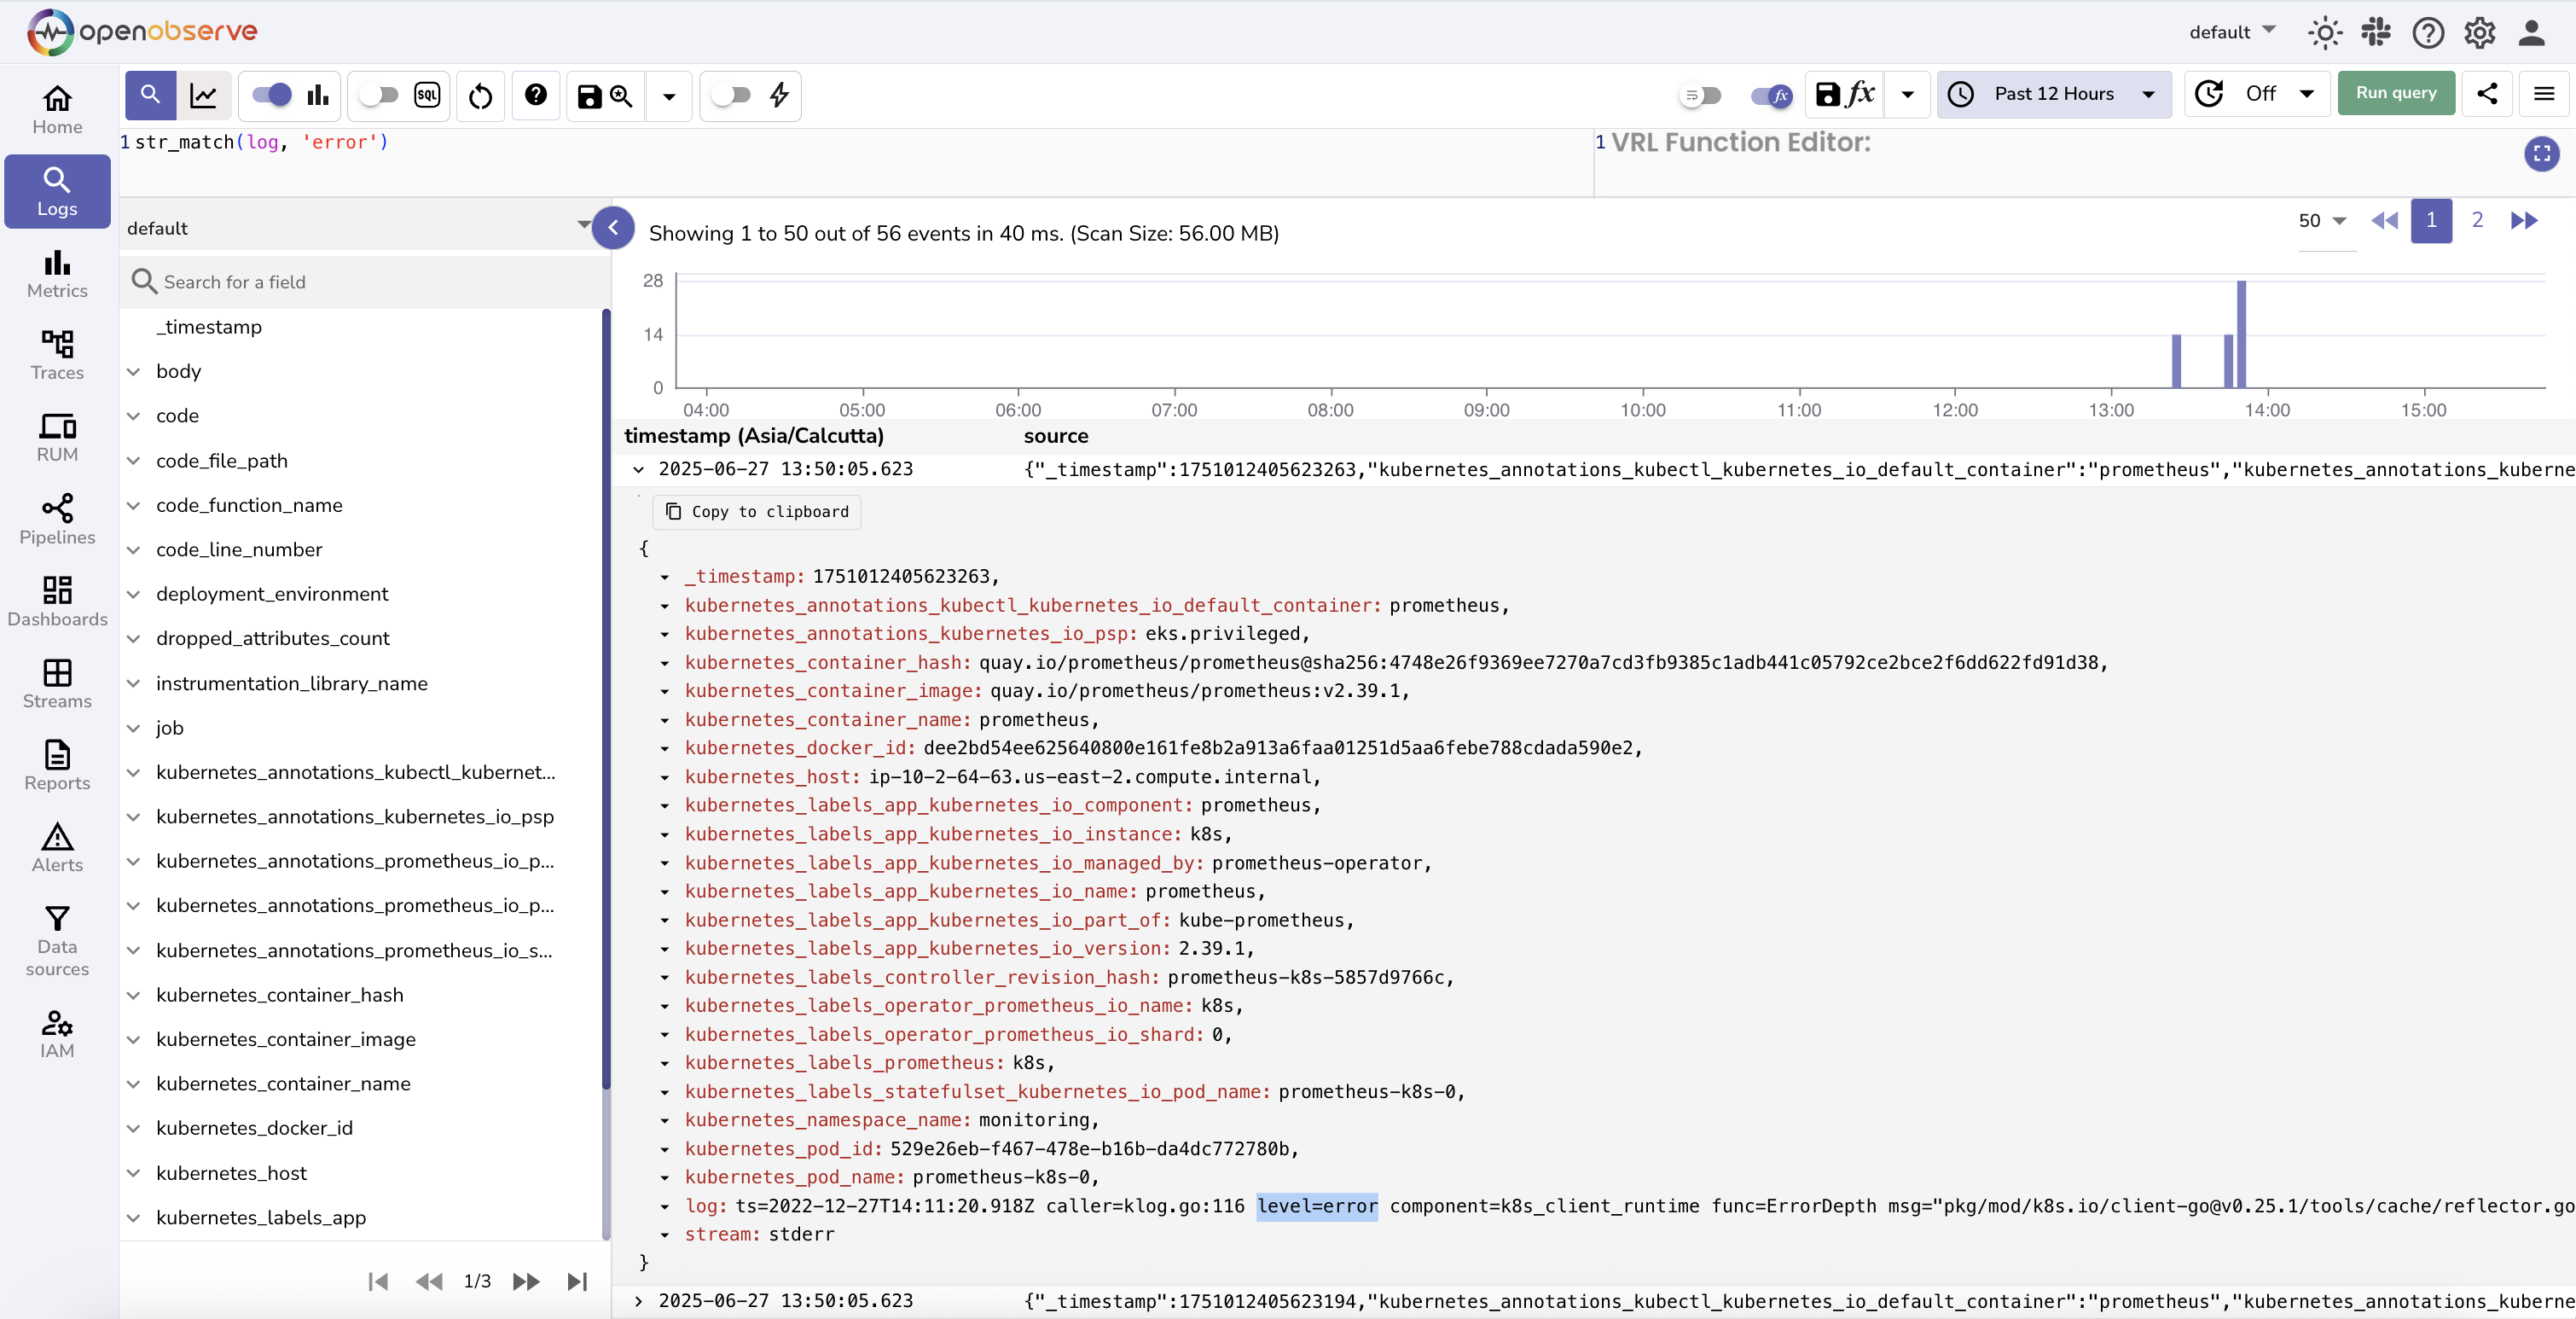
Search for "error" in just the log field (more efficient):
Numeric Field Filters
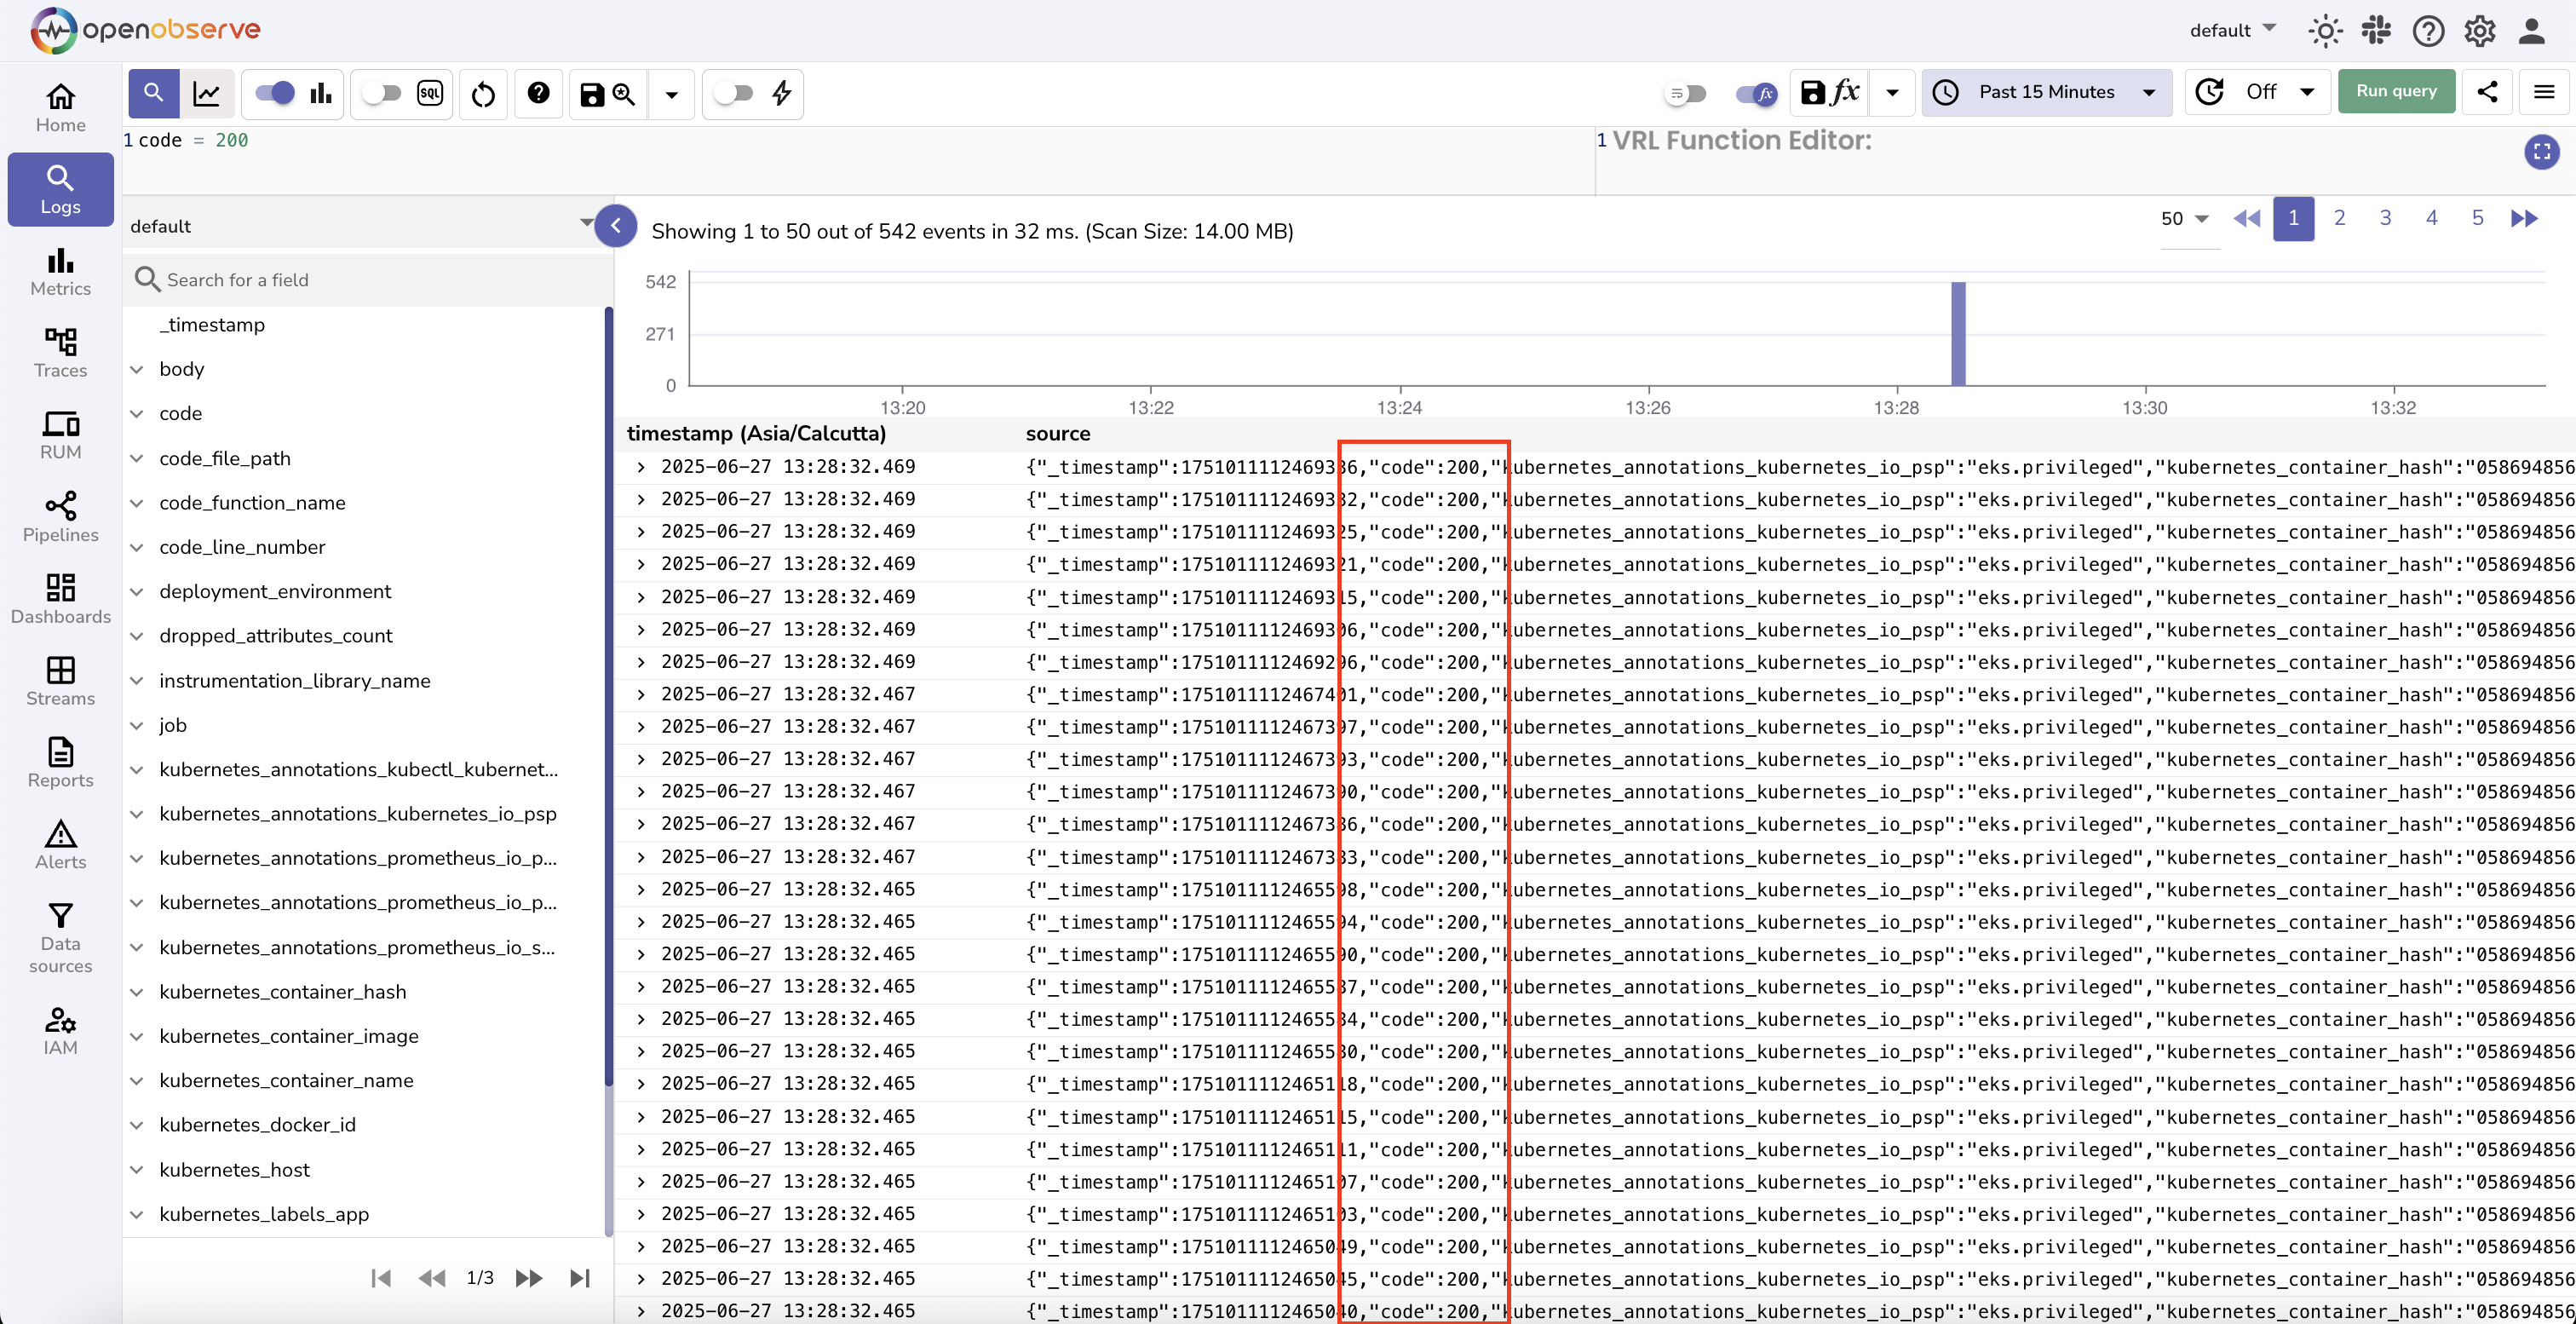
Find logs where code is exactly 200:
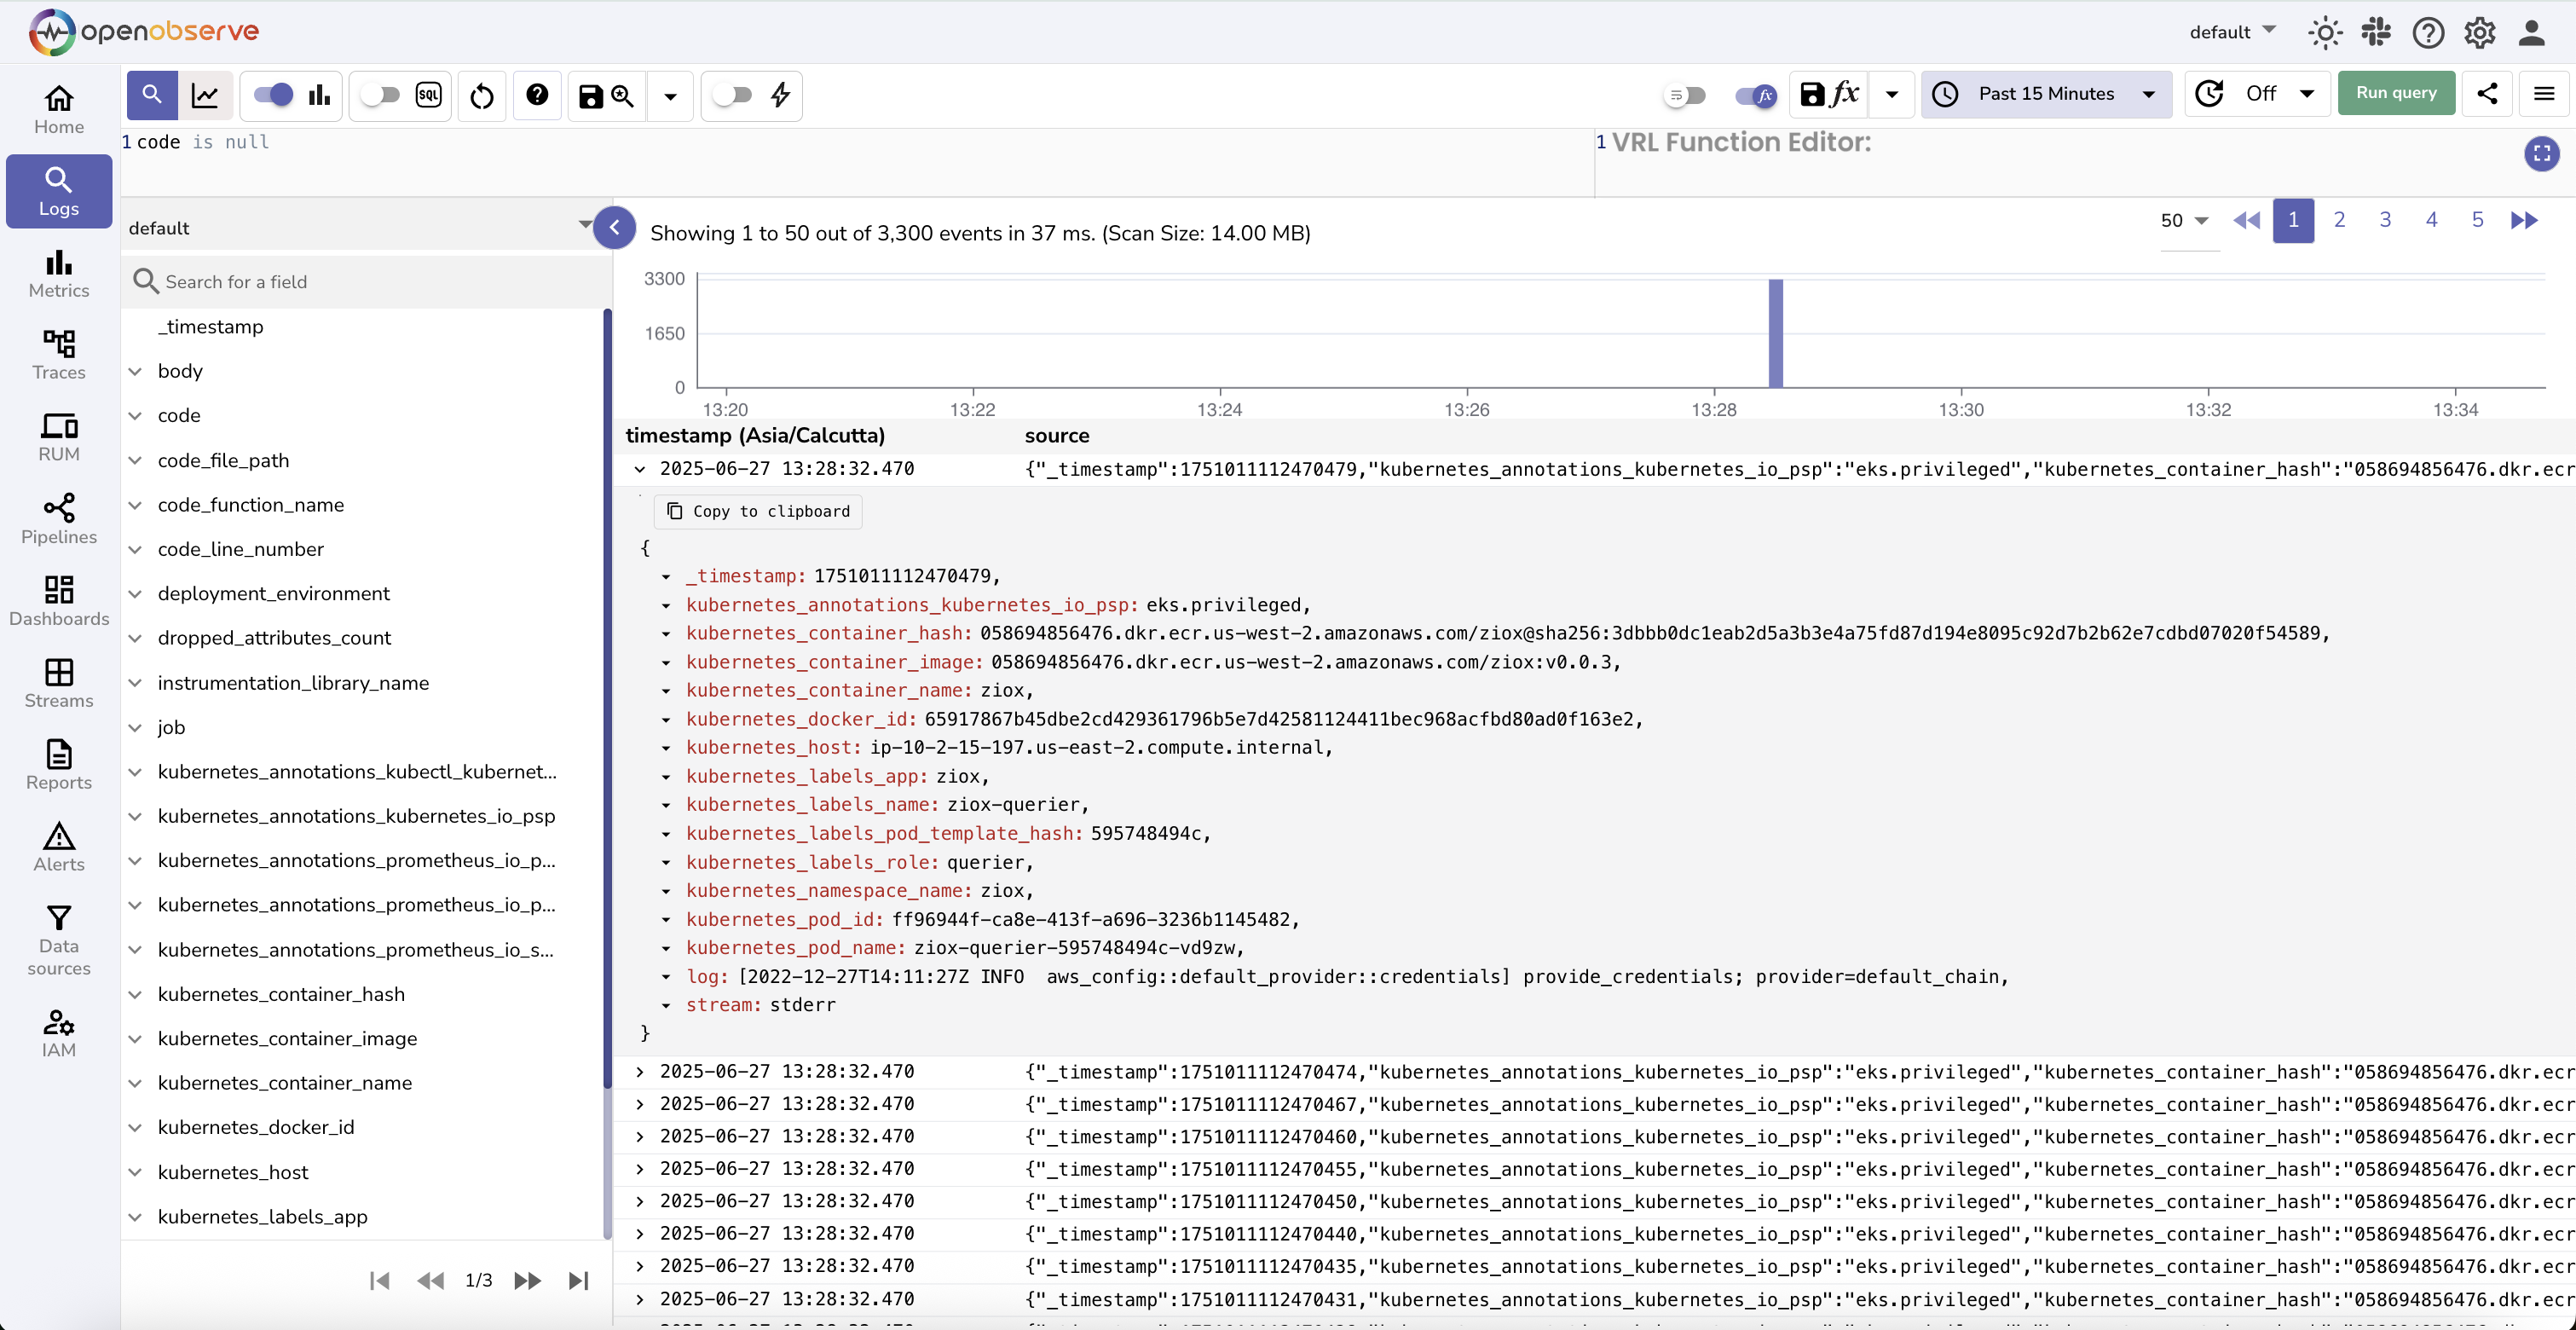
Find logs where code is missing (null):
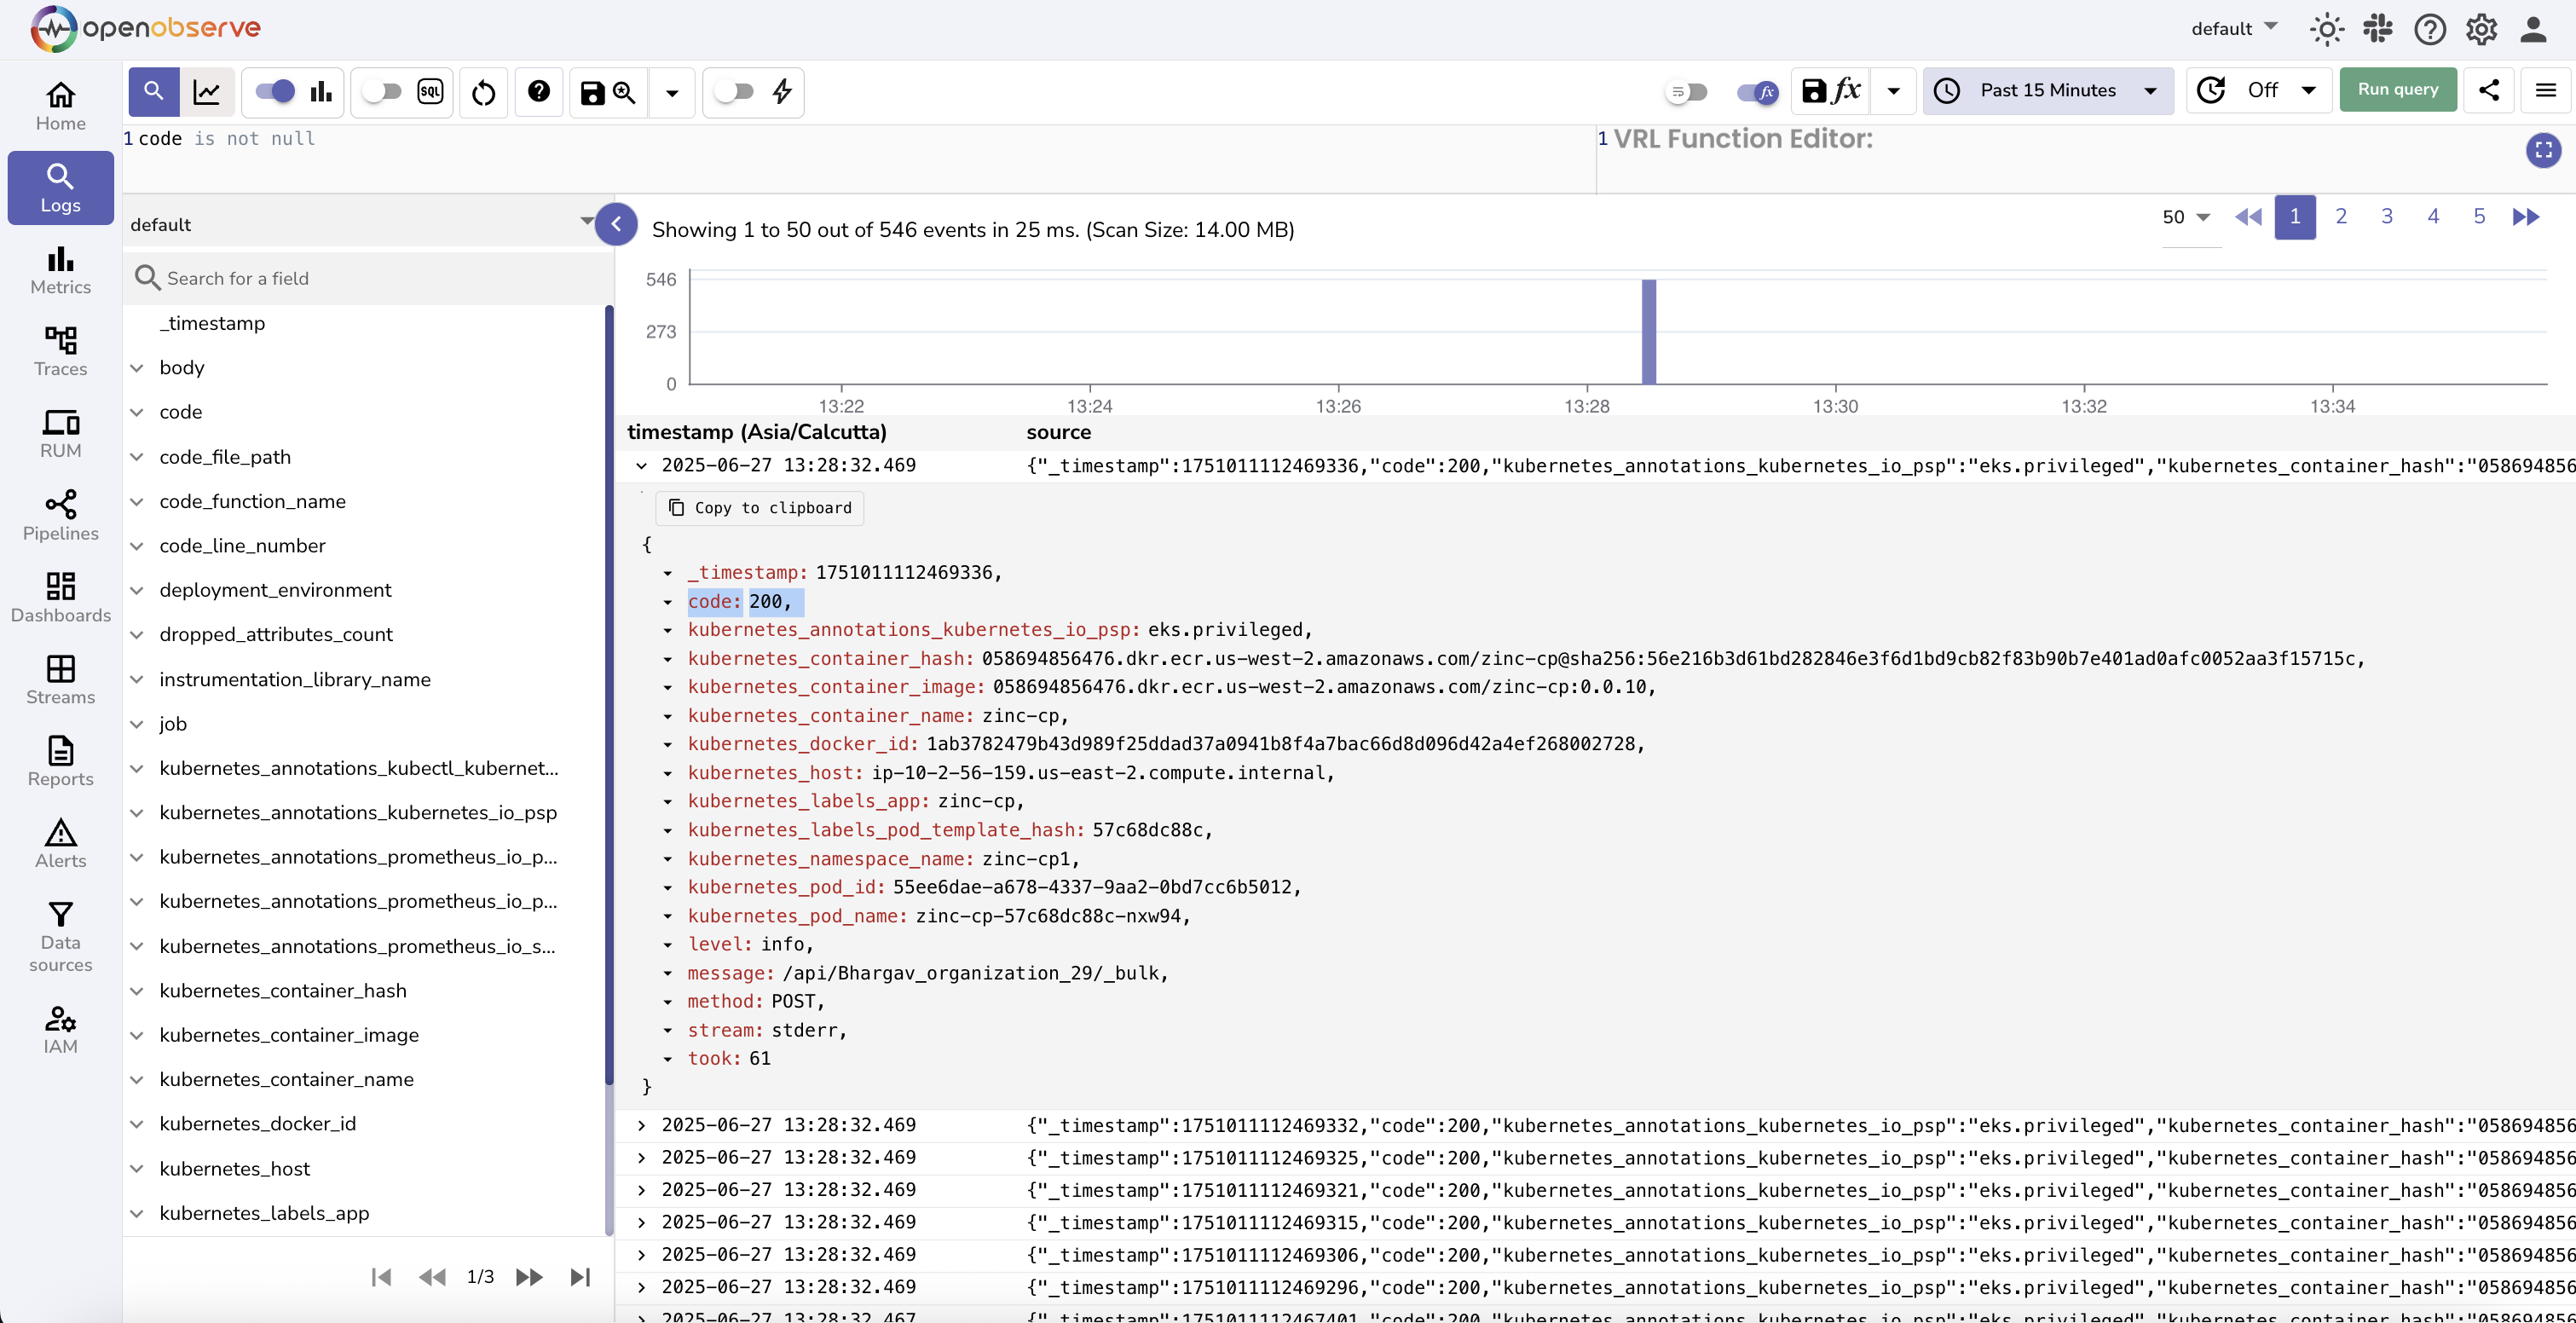
Find logs where code has any value:
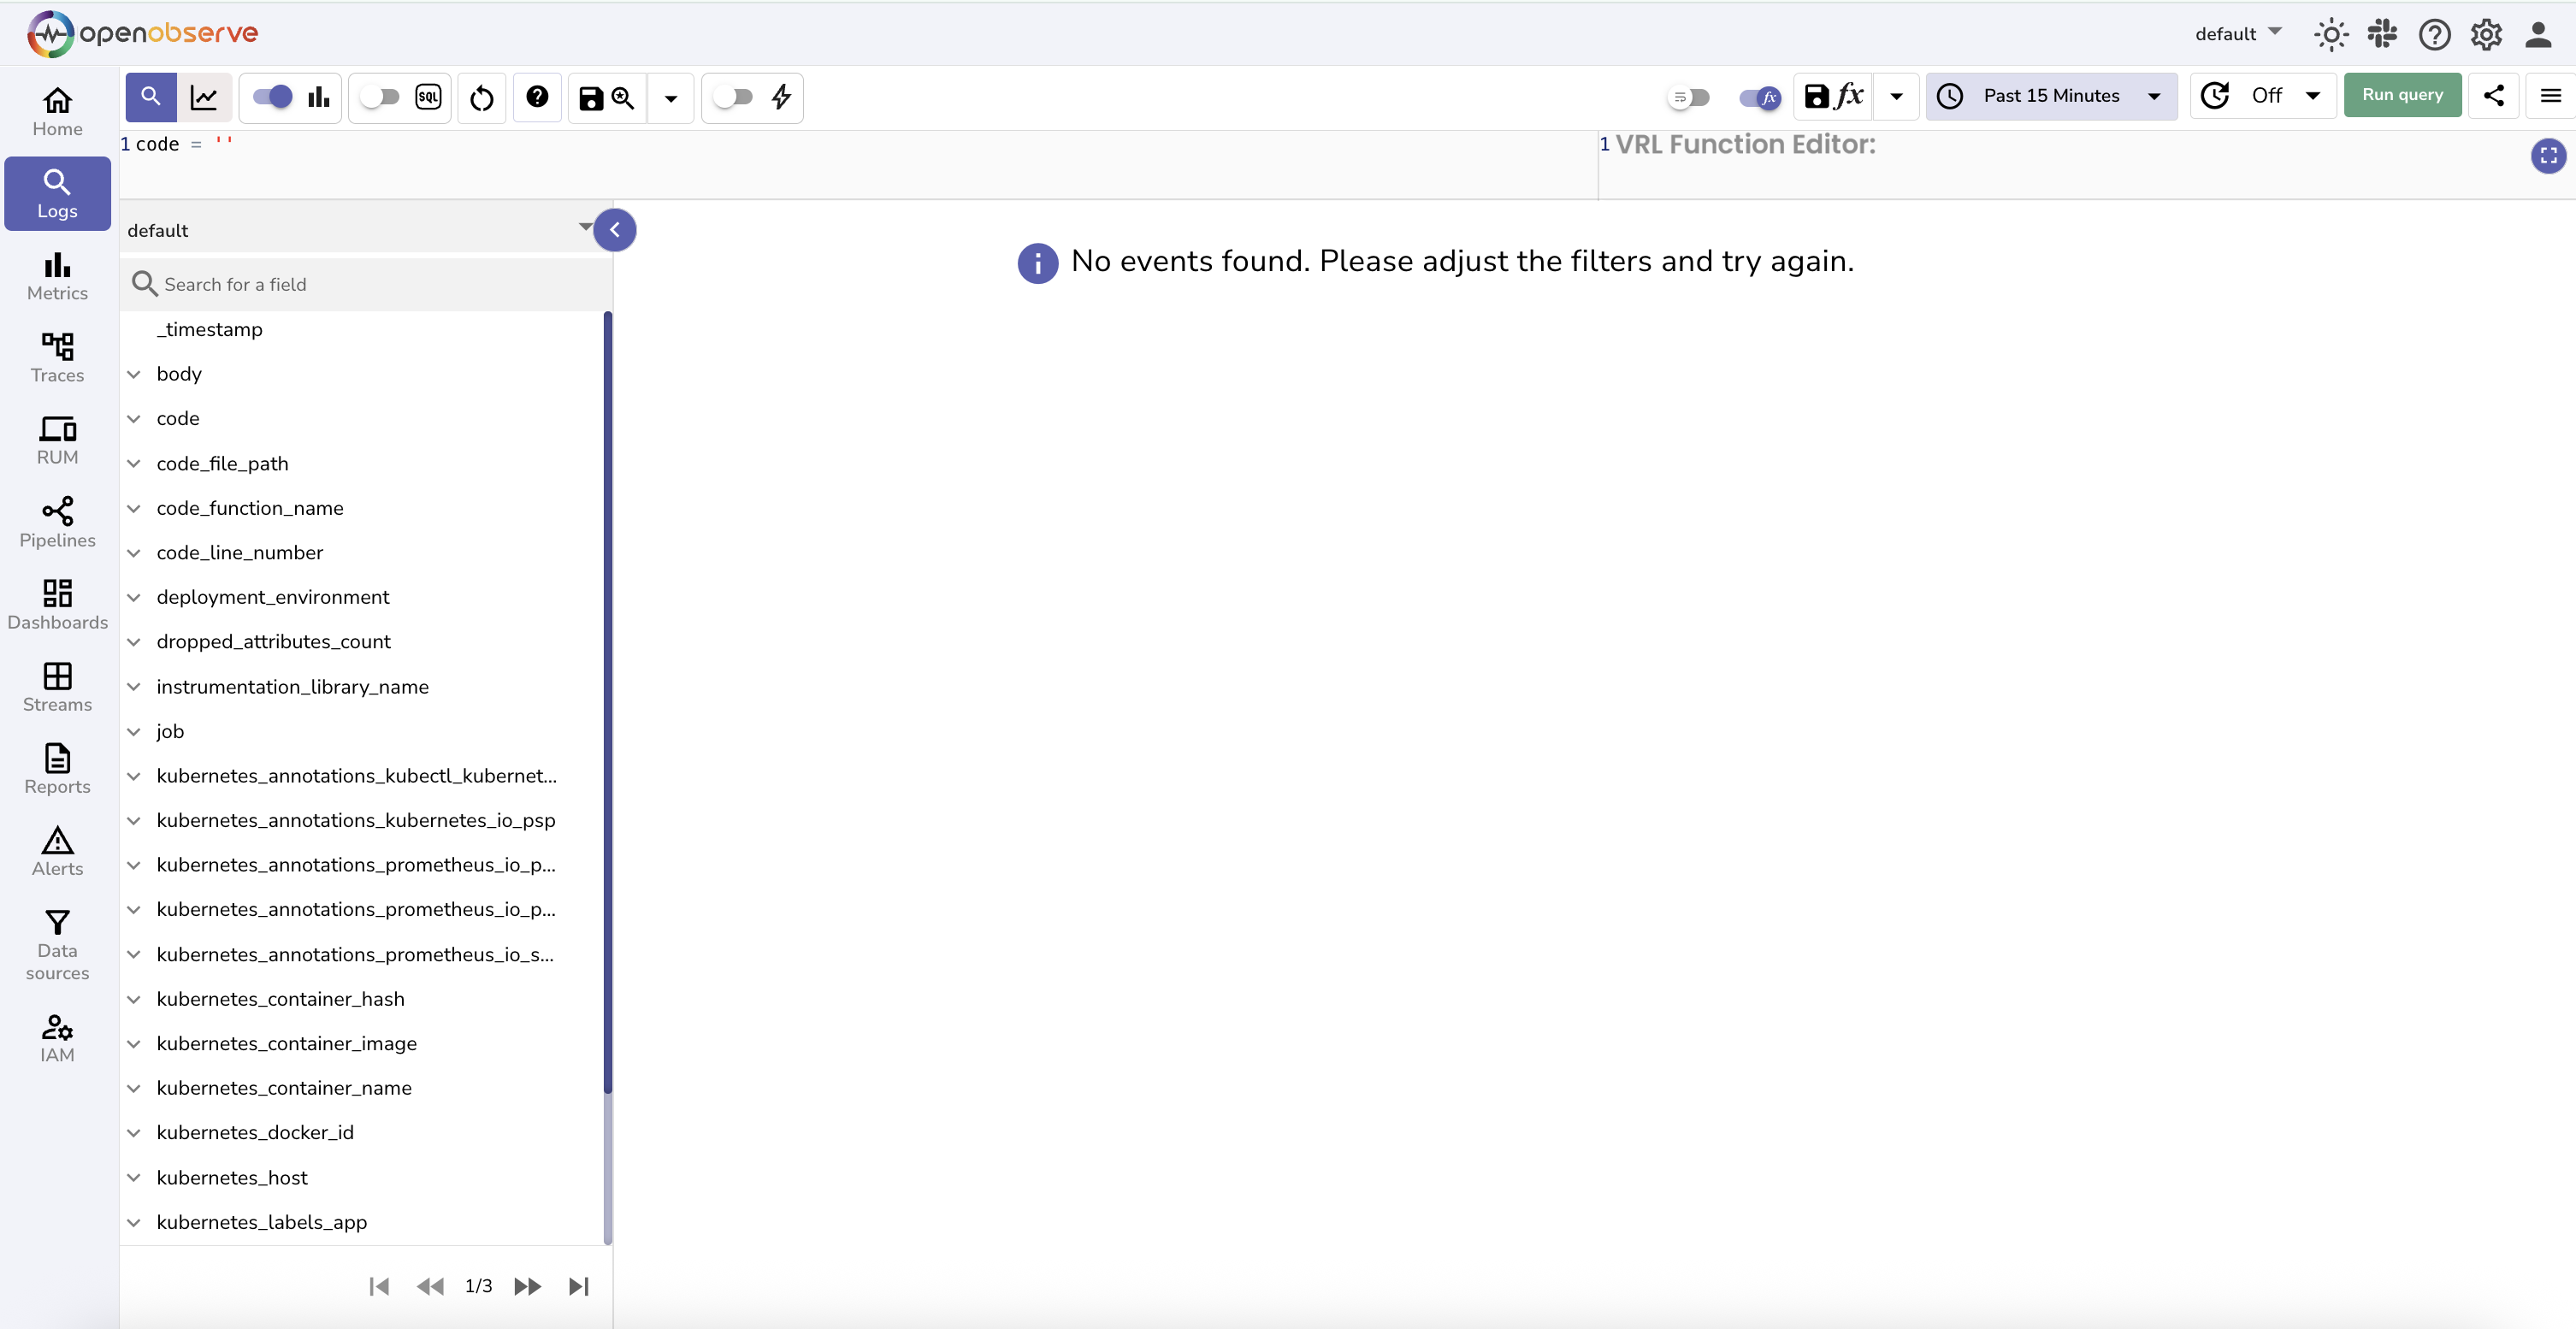
Avoid using code = '' or code != '' — these do not work properly for numeric fields.
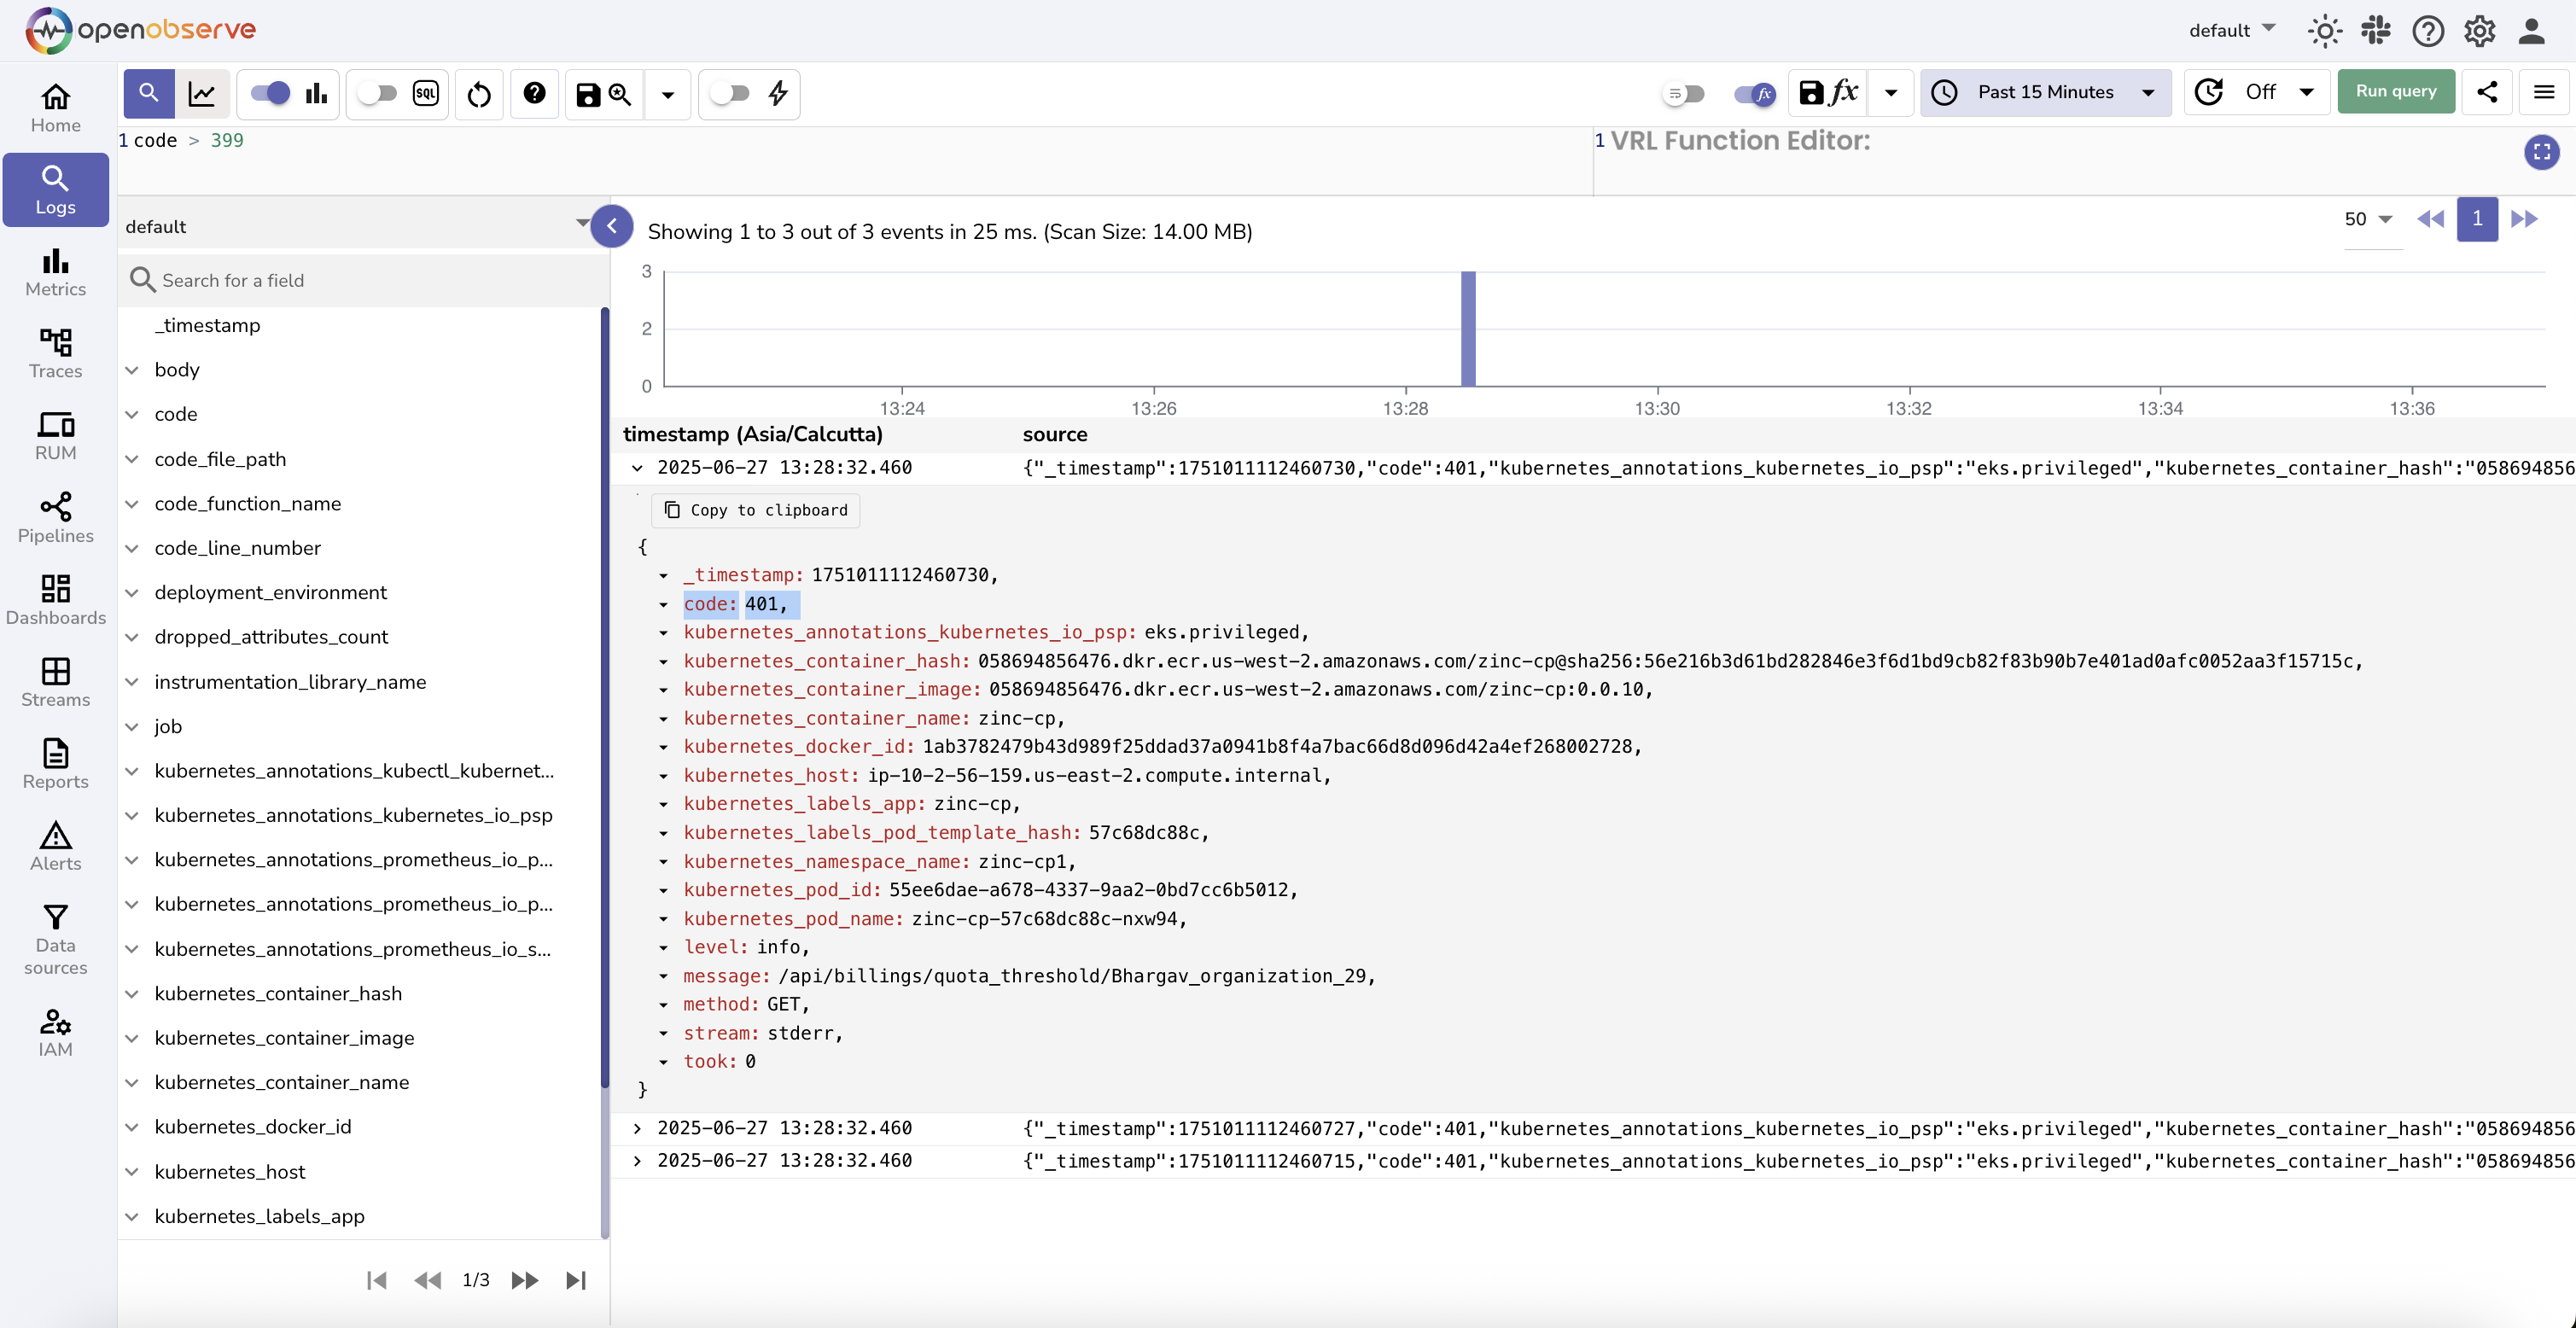
Logs where code is greater than 399:
Logs where code is greater than or equal to 400:
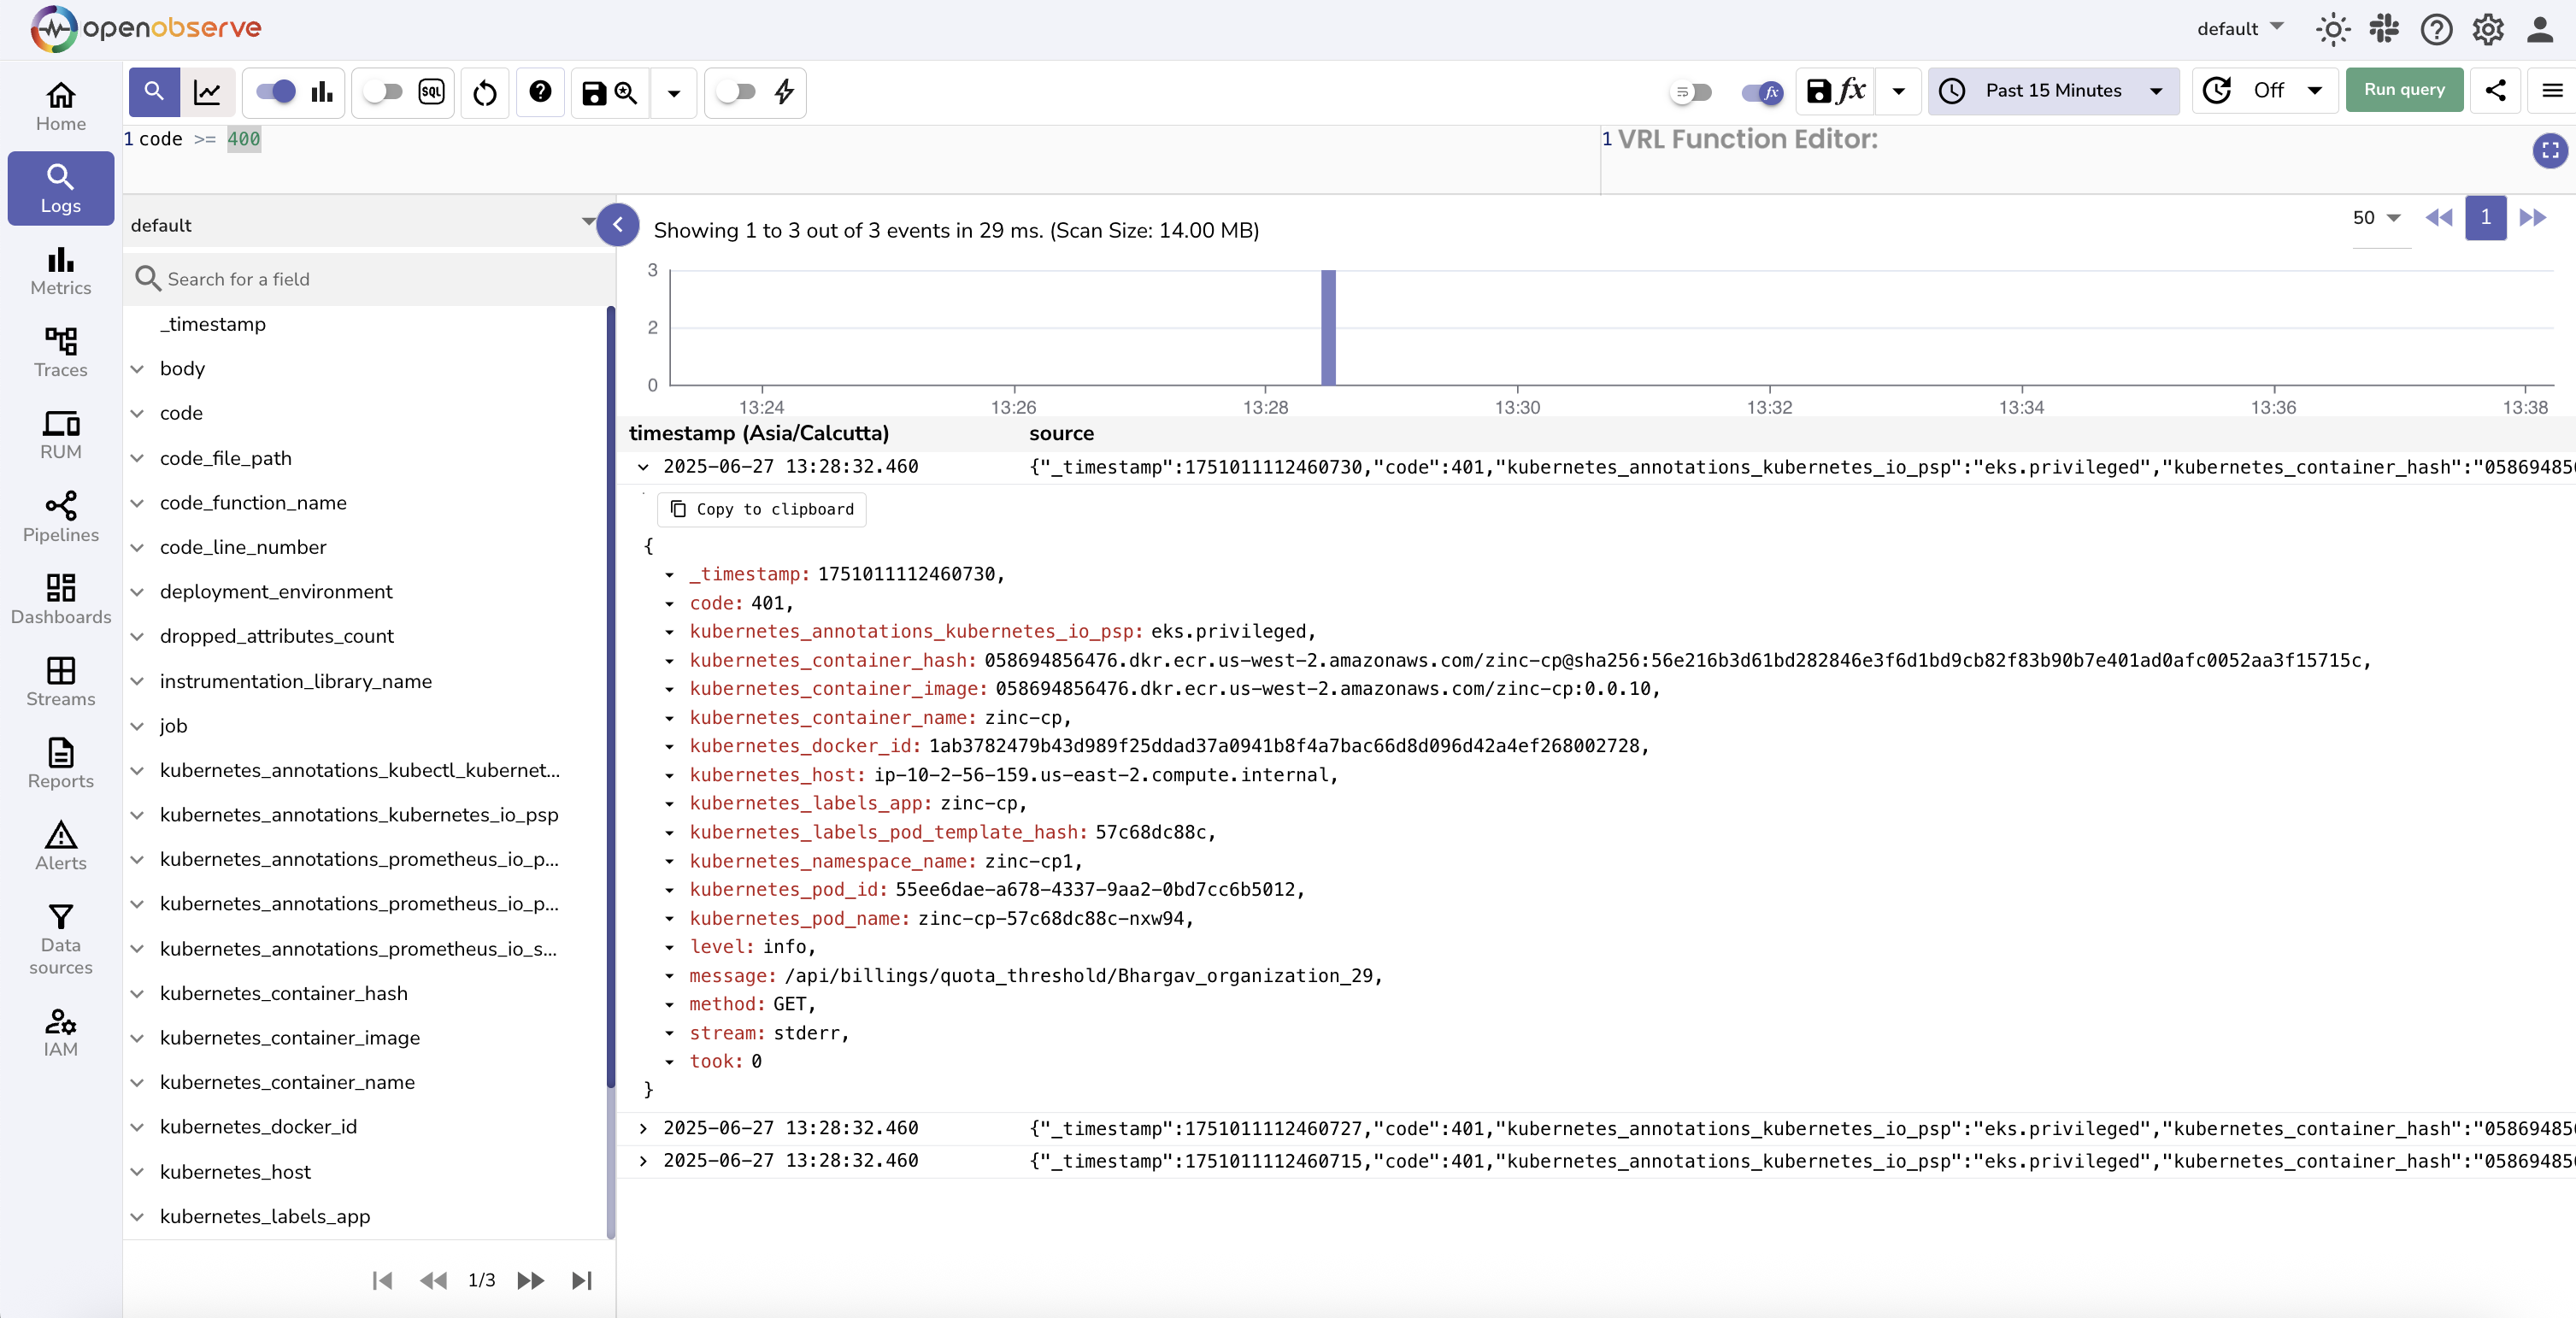
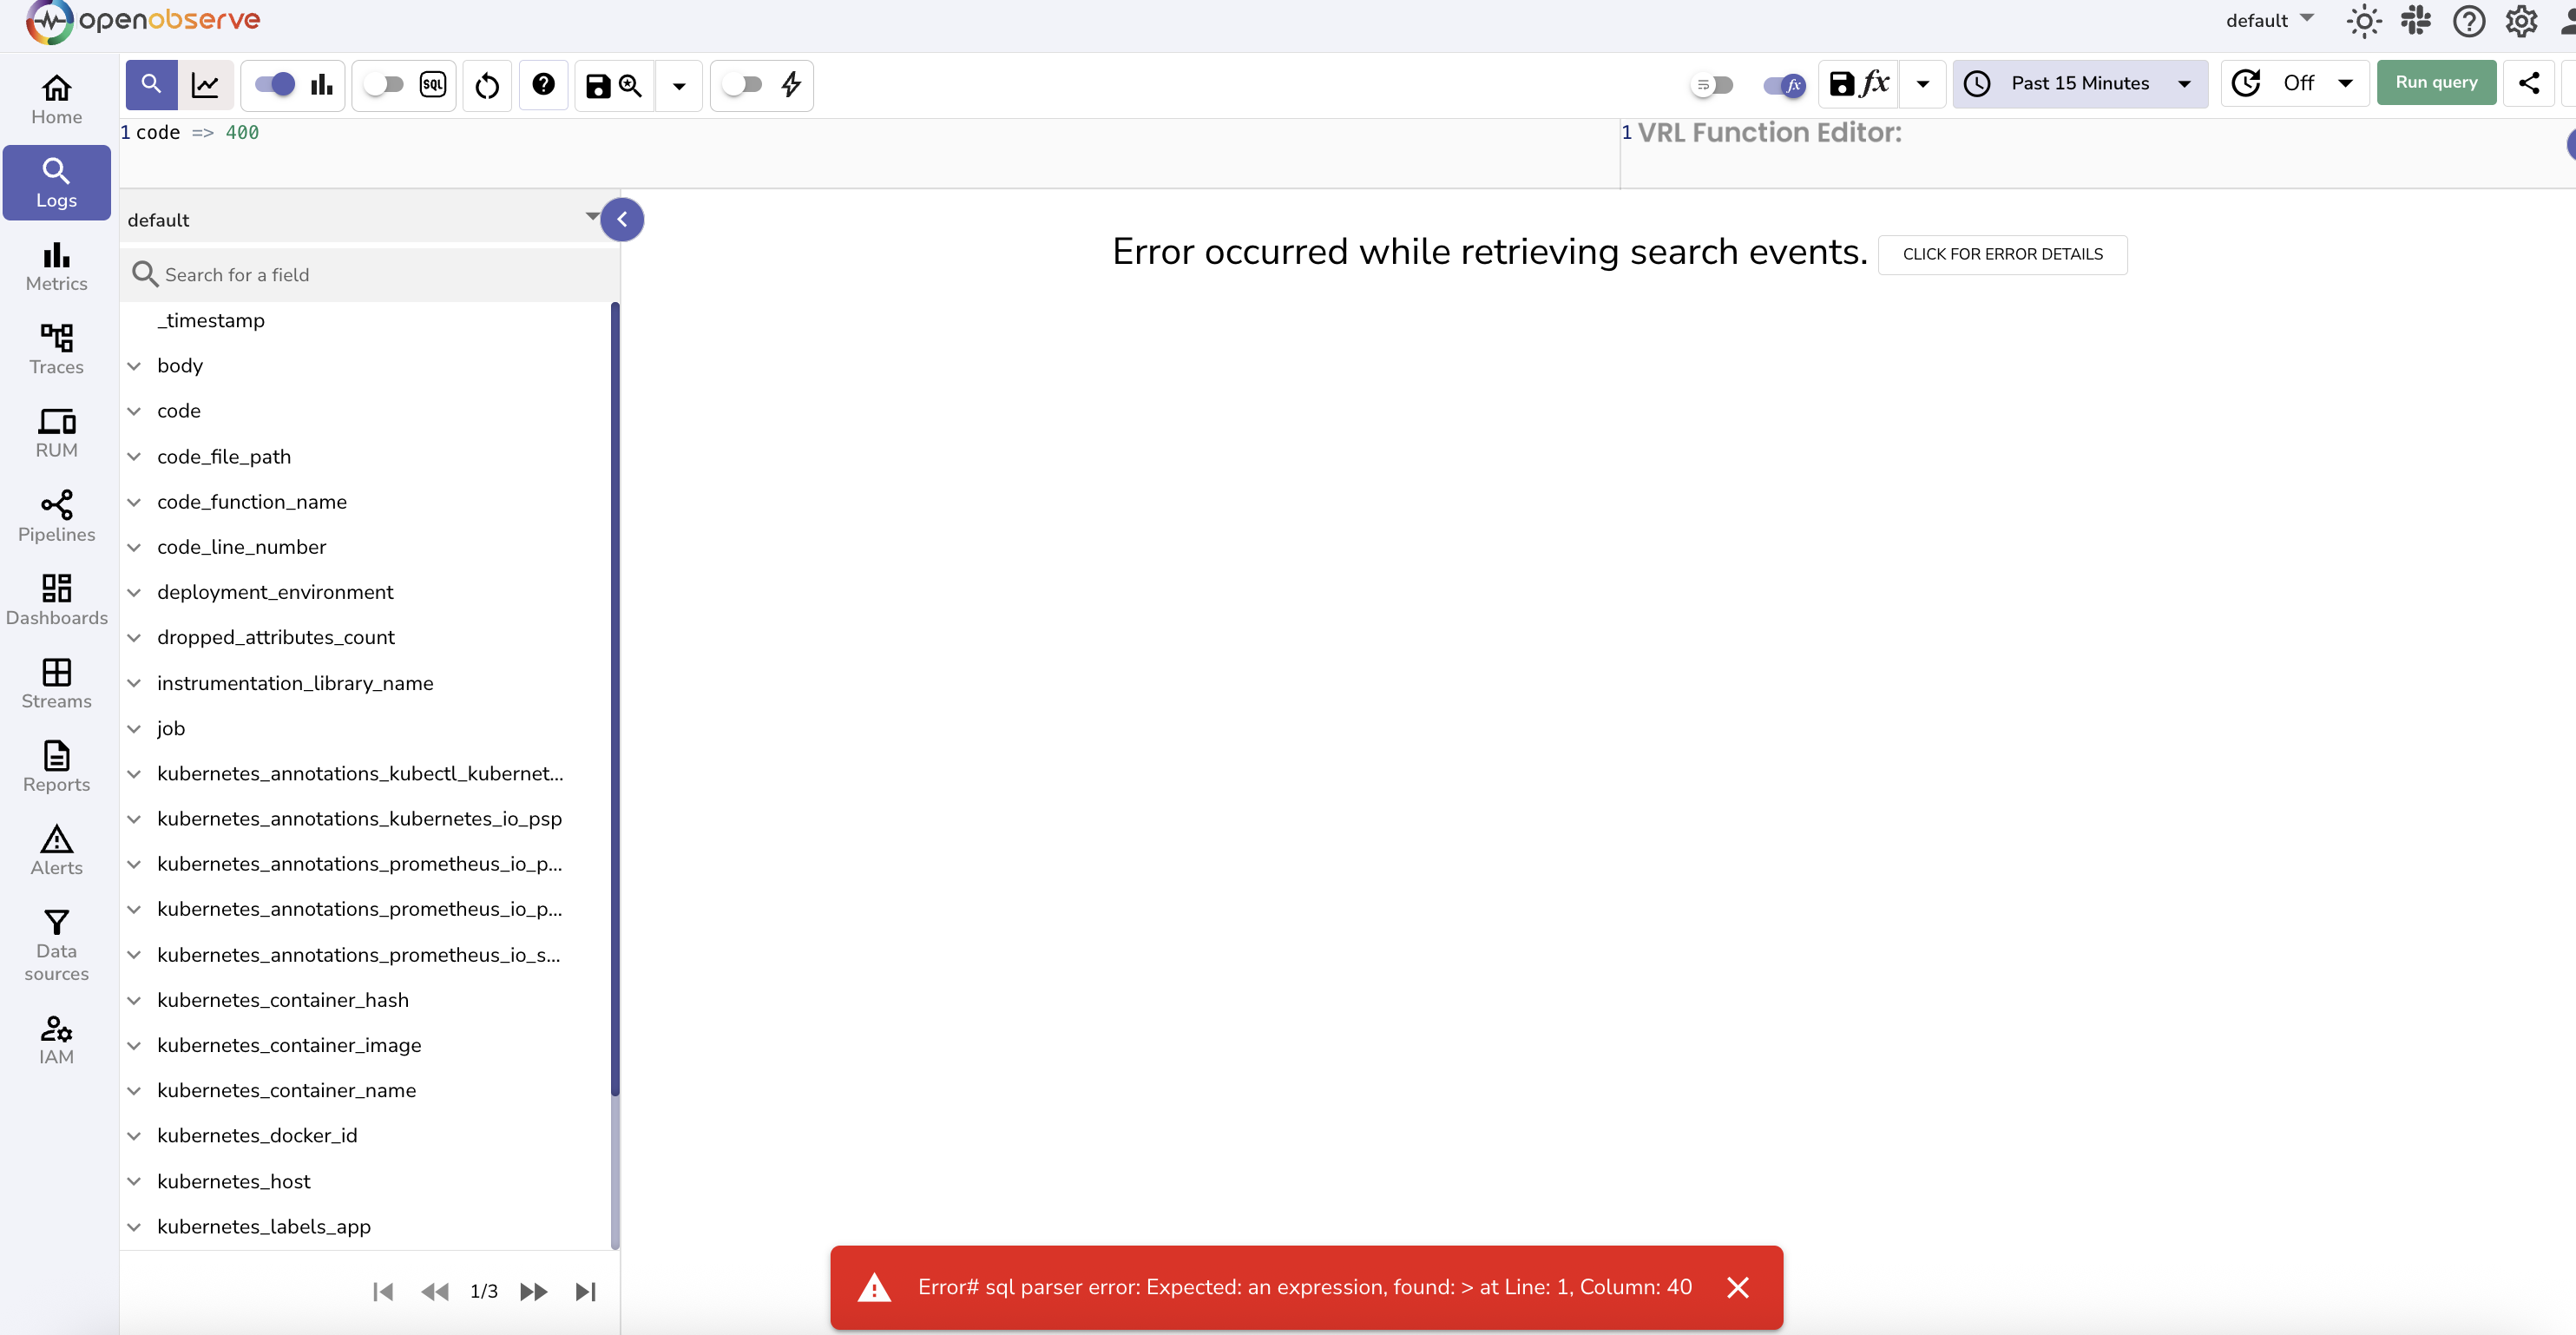
code => 400 is invalid syntax. Always use SQL-compatible operators like >=.
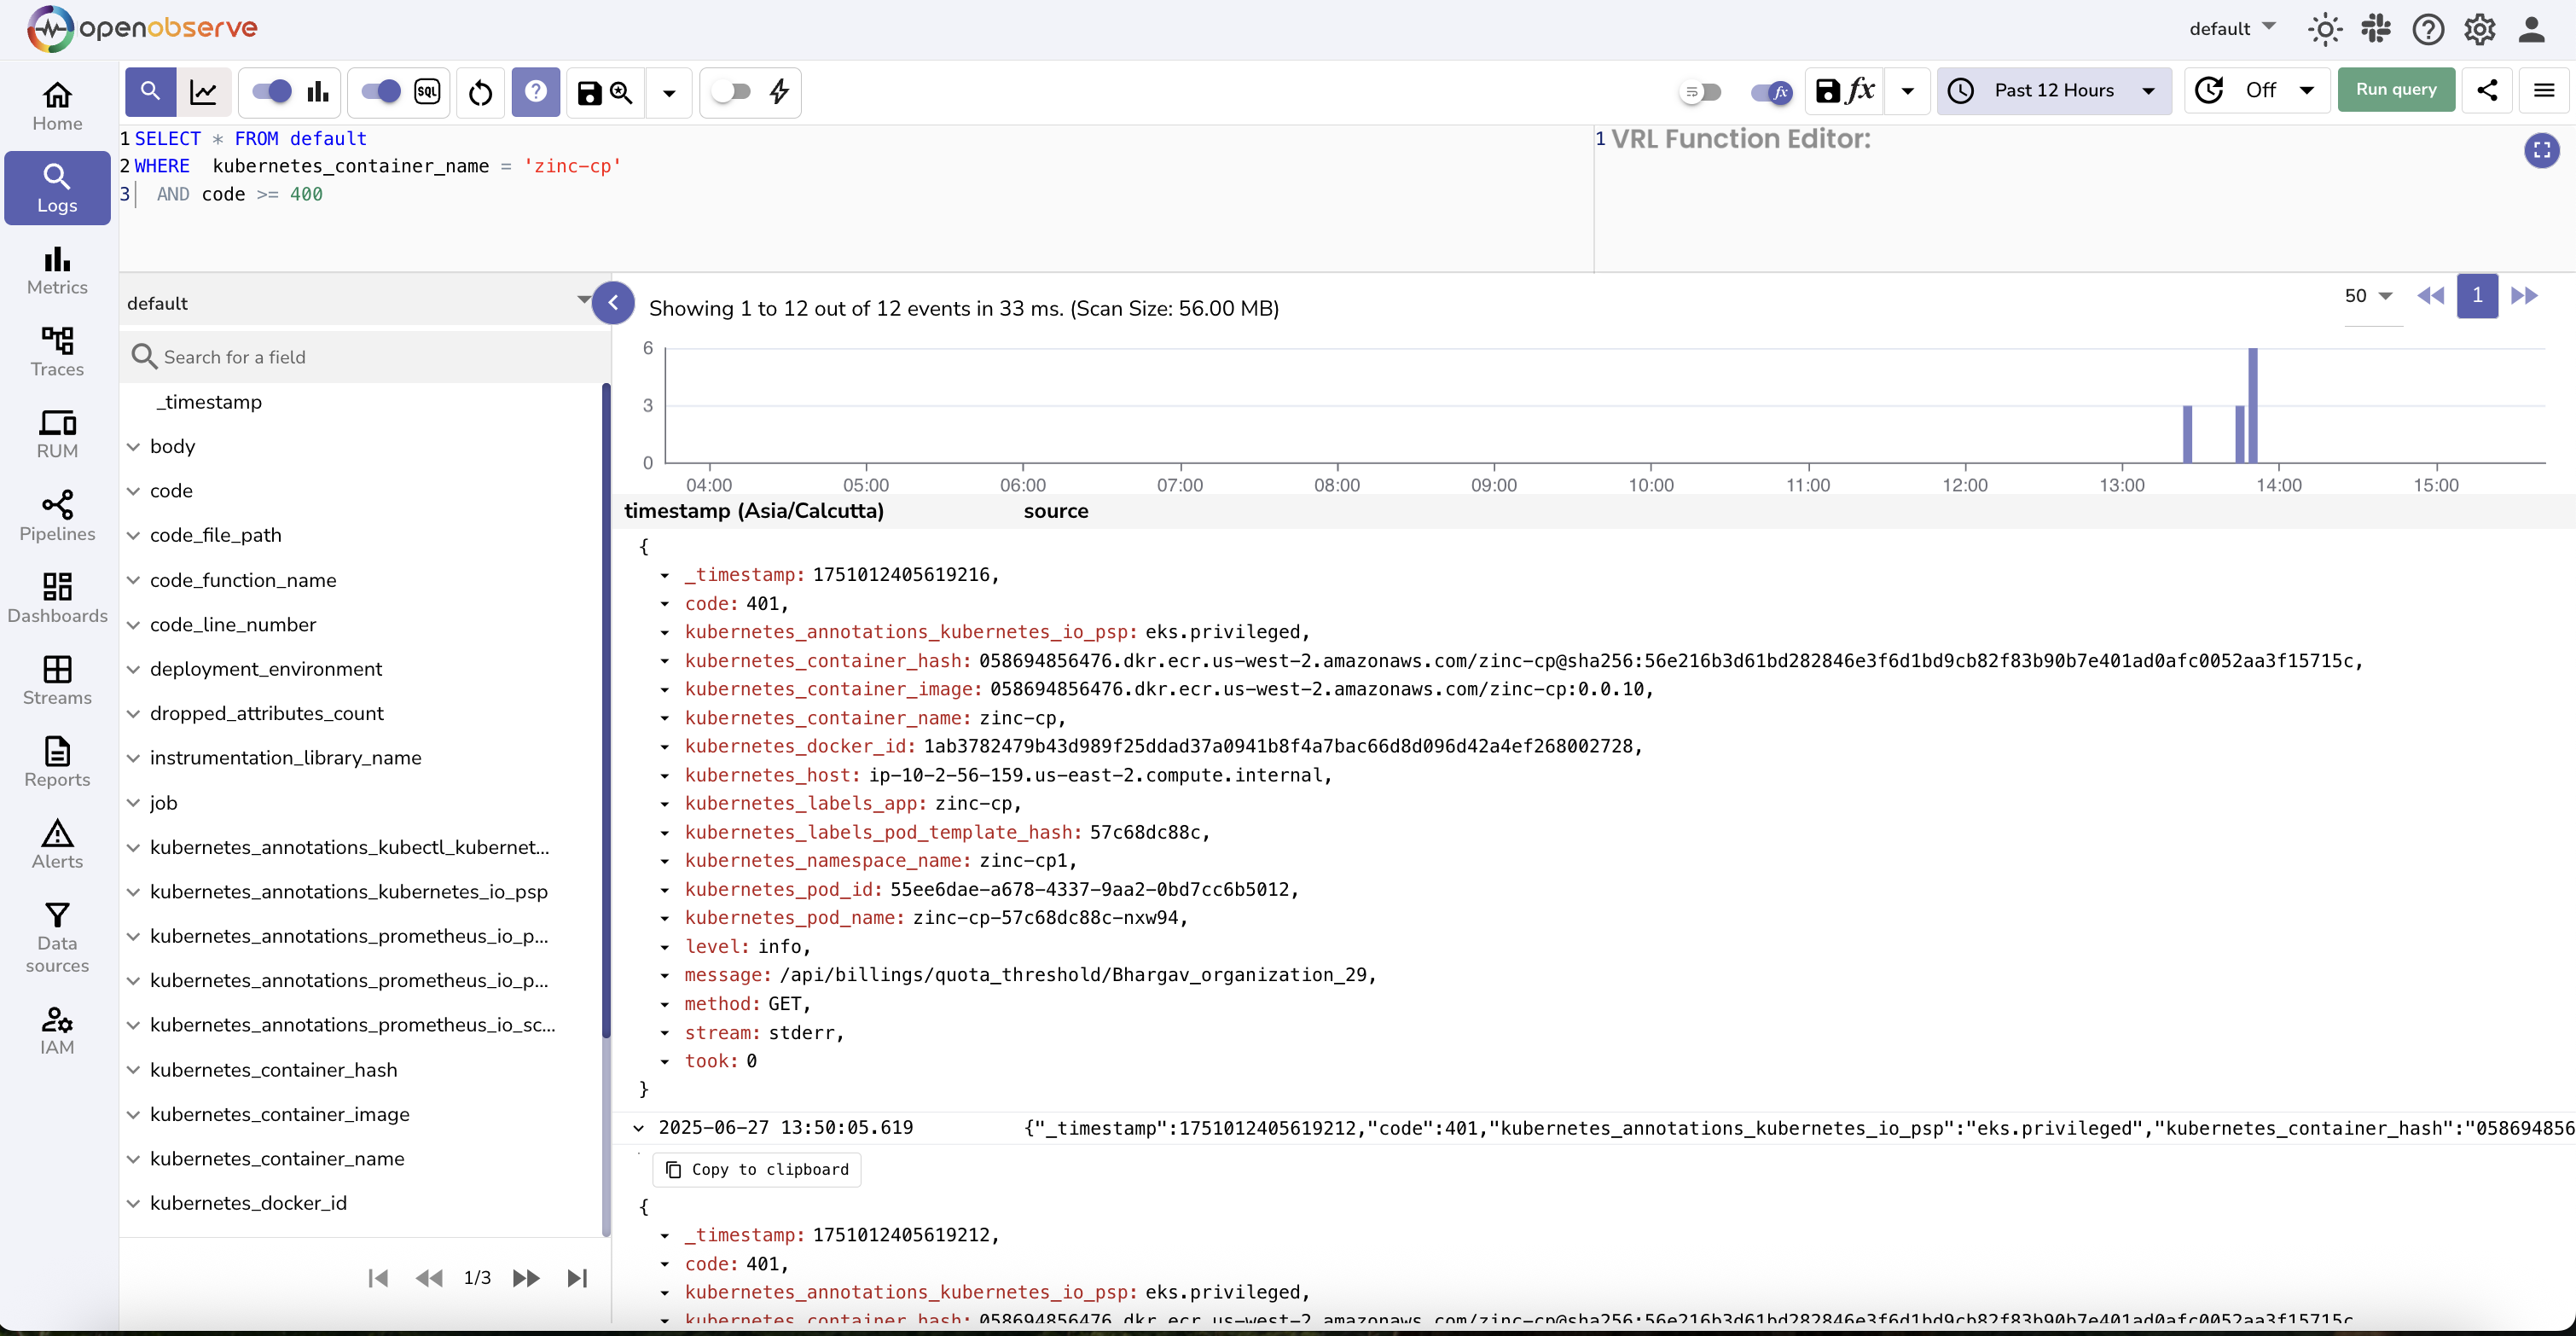
Filtering using WHERE Clause
Filter by service and status code:
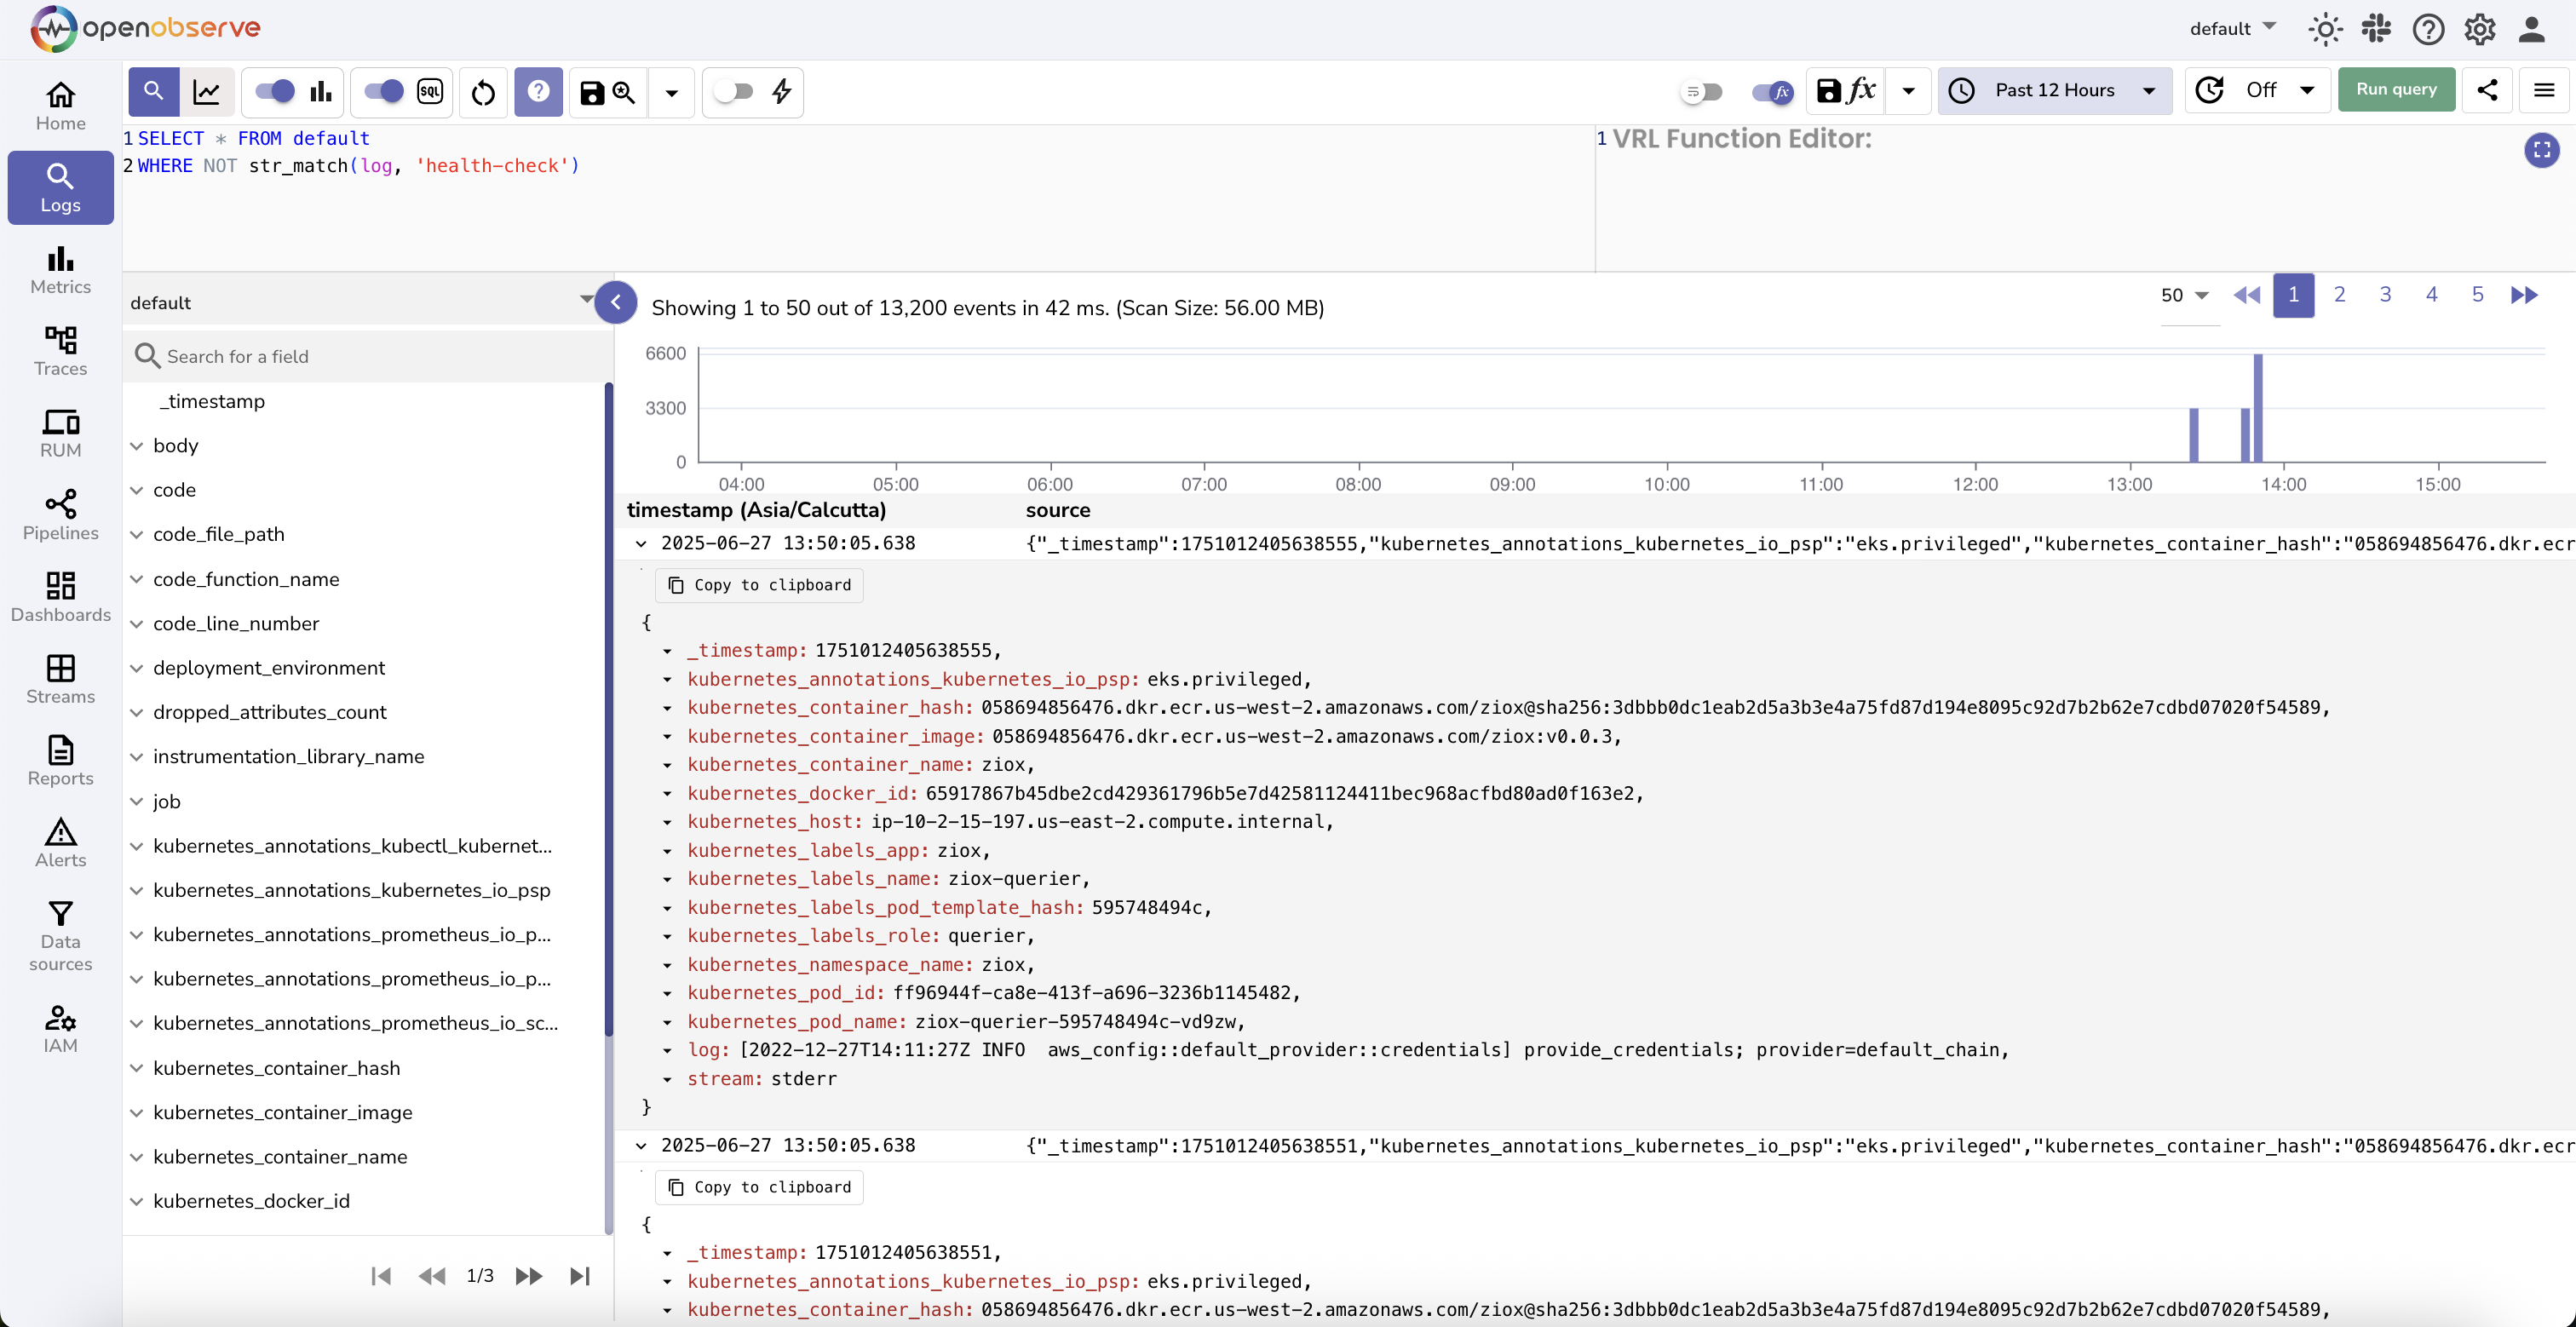
Exclude health check logs:
Grouping and Counting
Group Logs over time

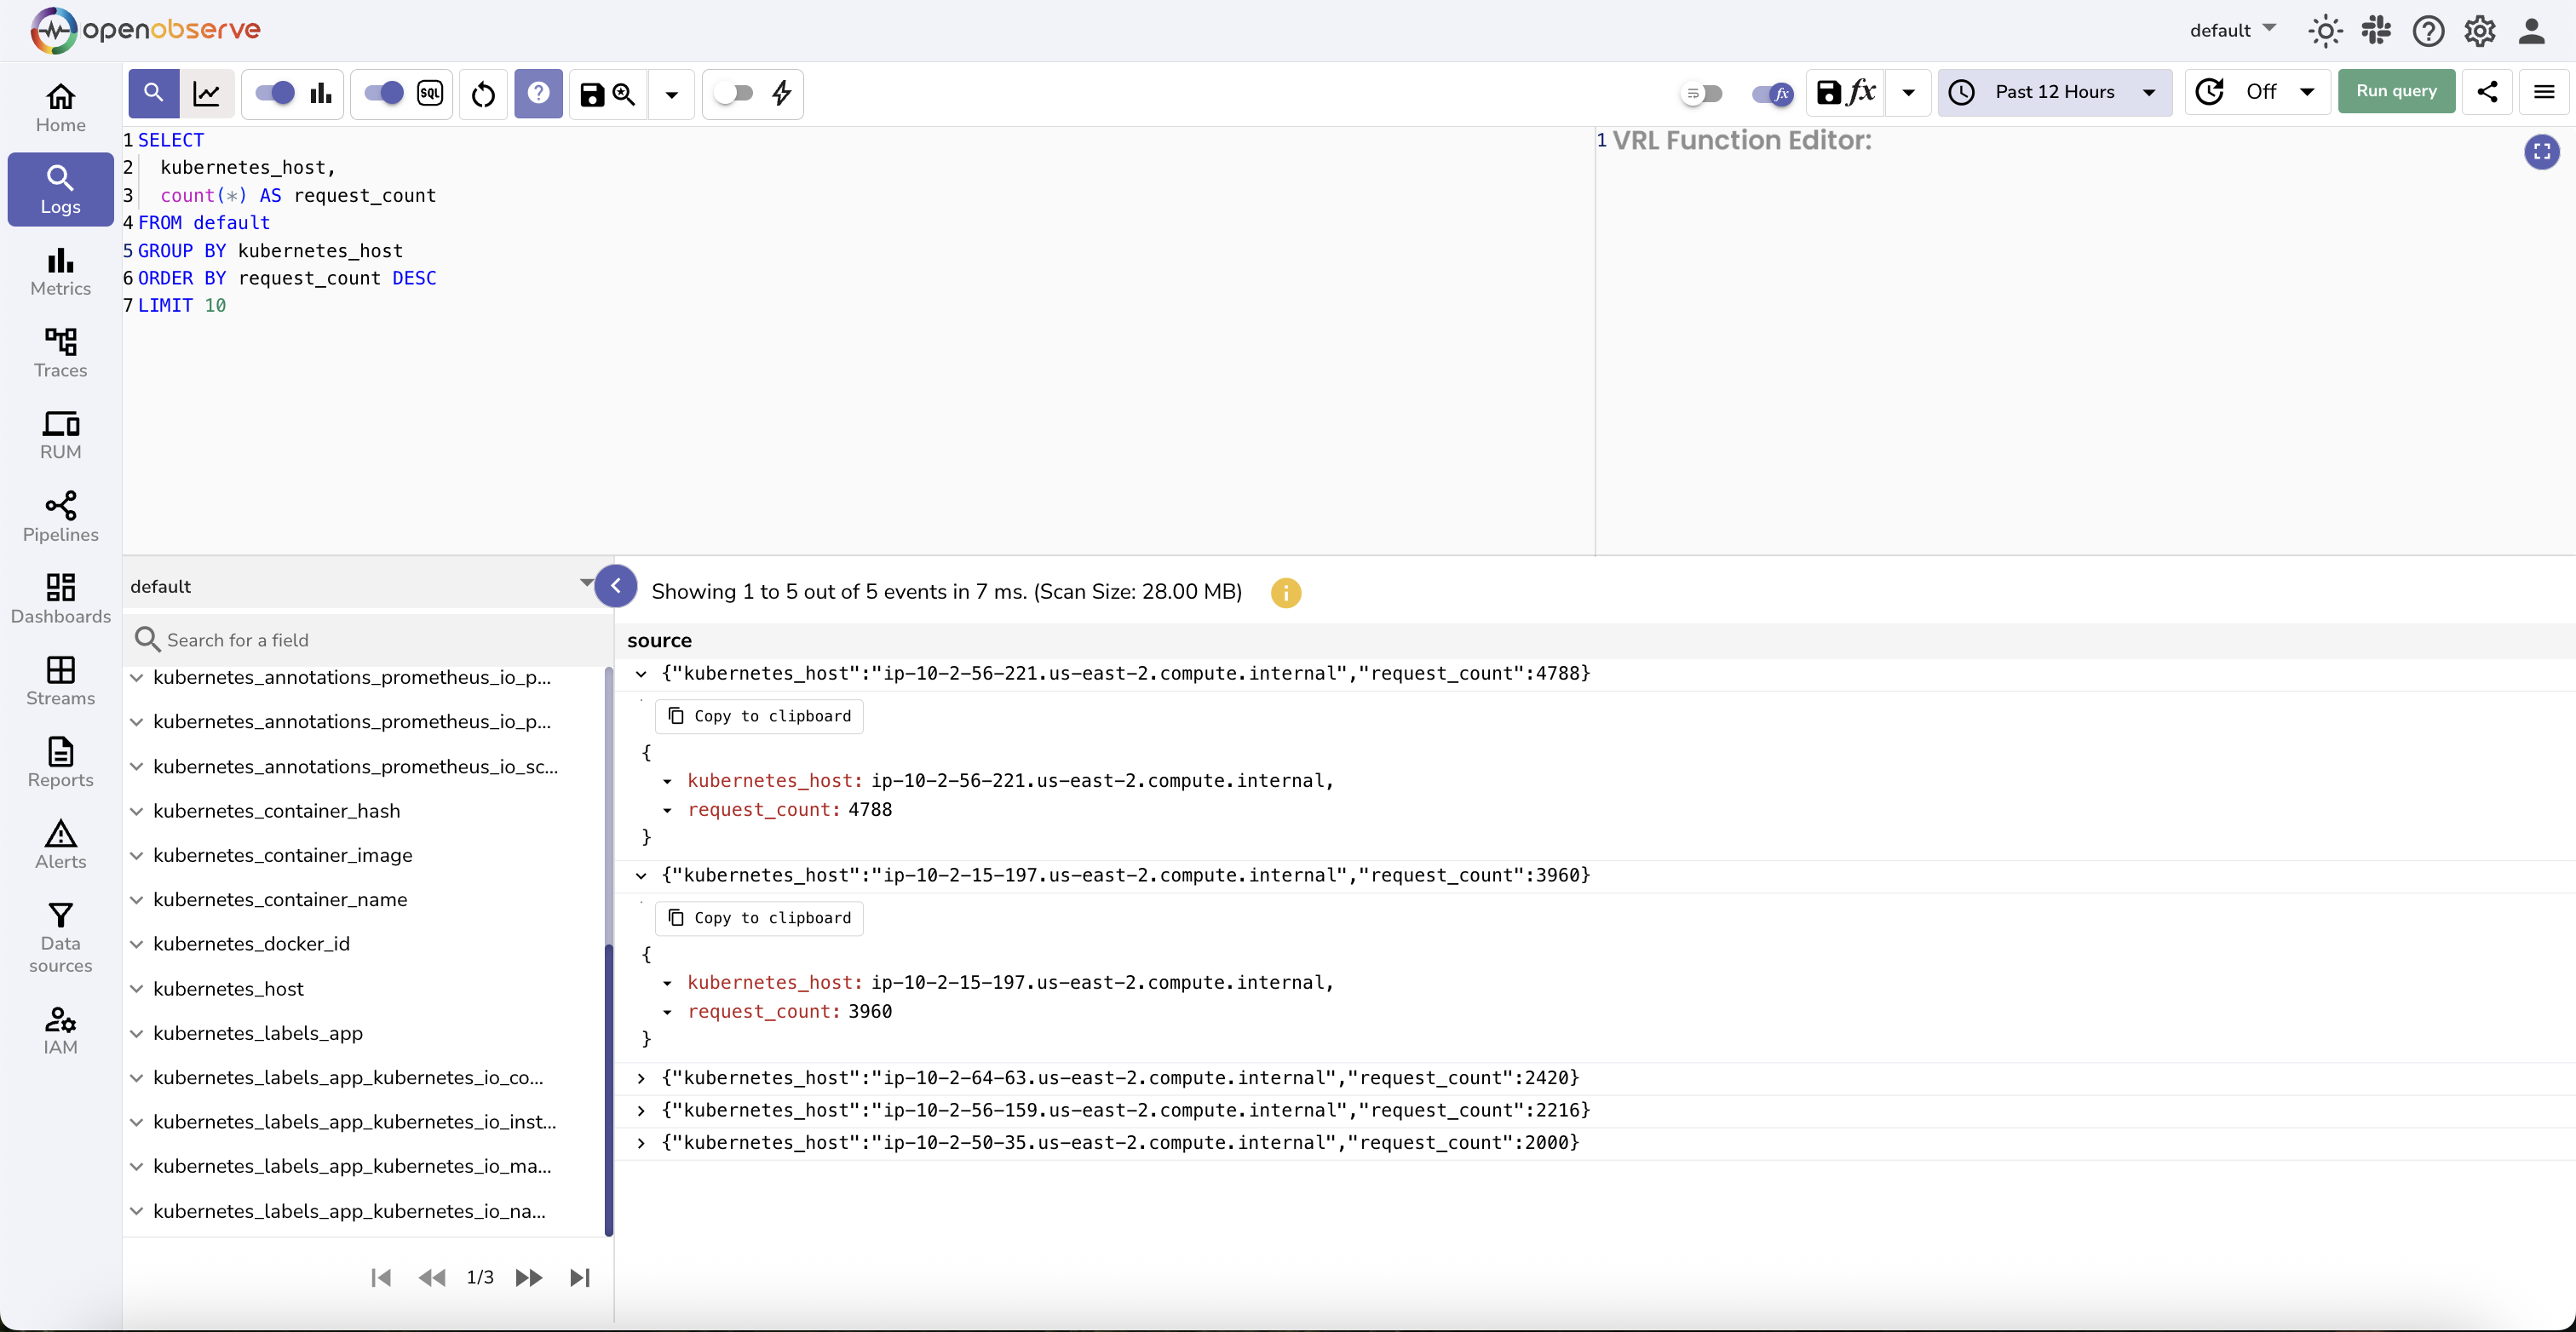
Find top 10 IP addresses by request volume:
SELECT
  client_ip,
  count(*) AS request_count
FROM your_stream_name
GROUP BY client_ip
ORDER BY request_count DESC
LIMIT 10
Aggregations & Complex Queries
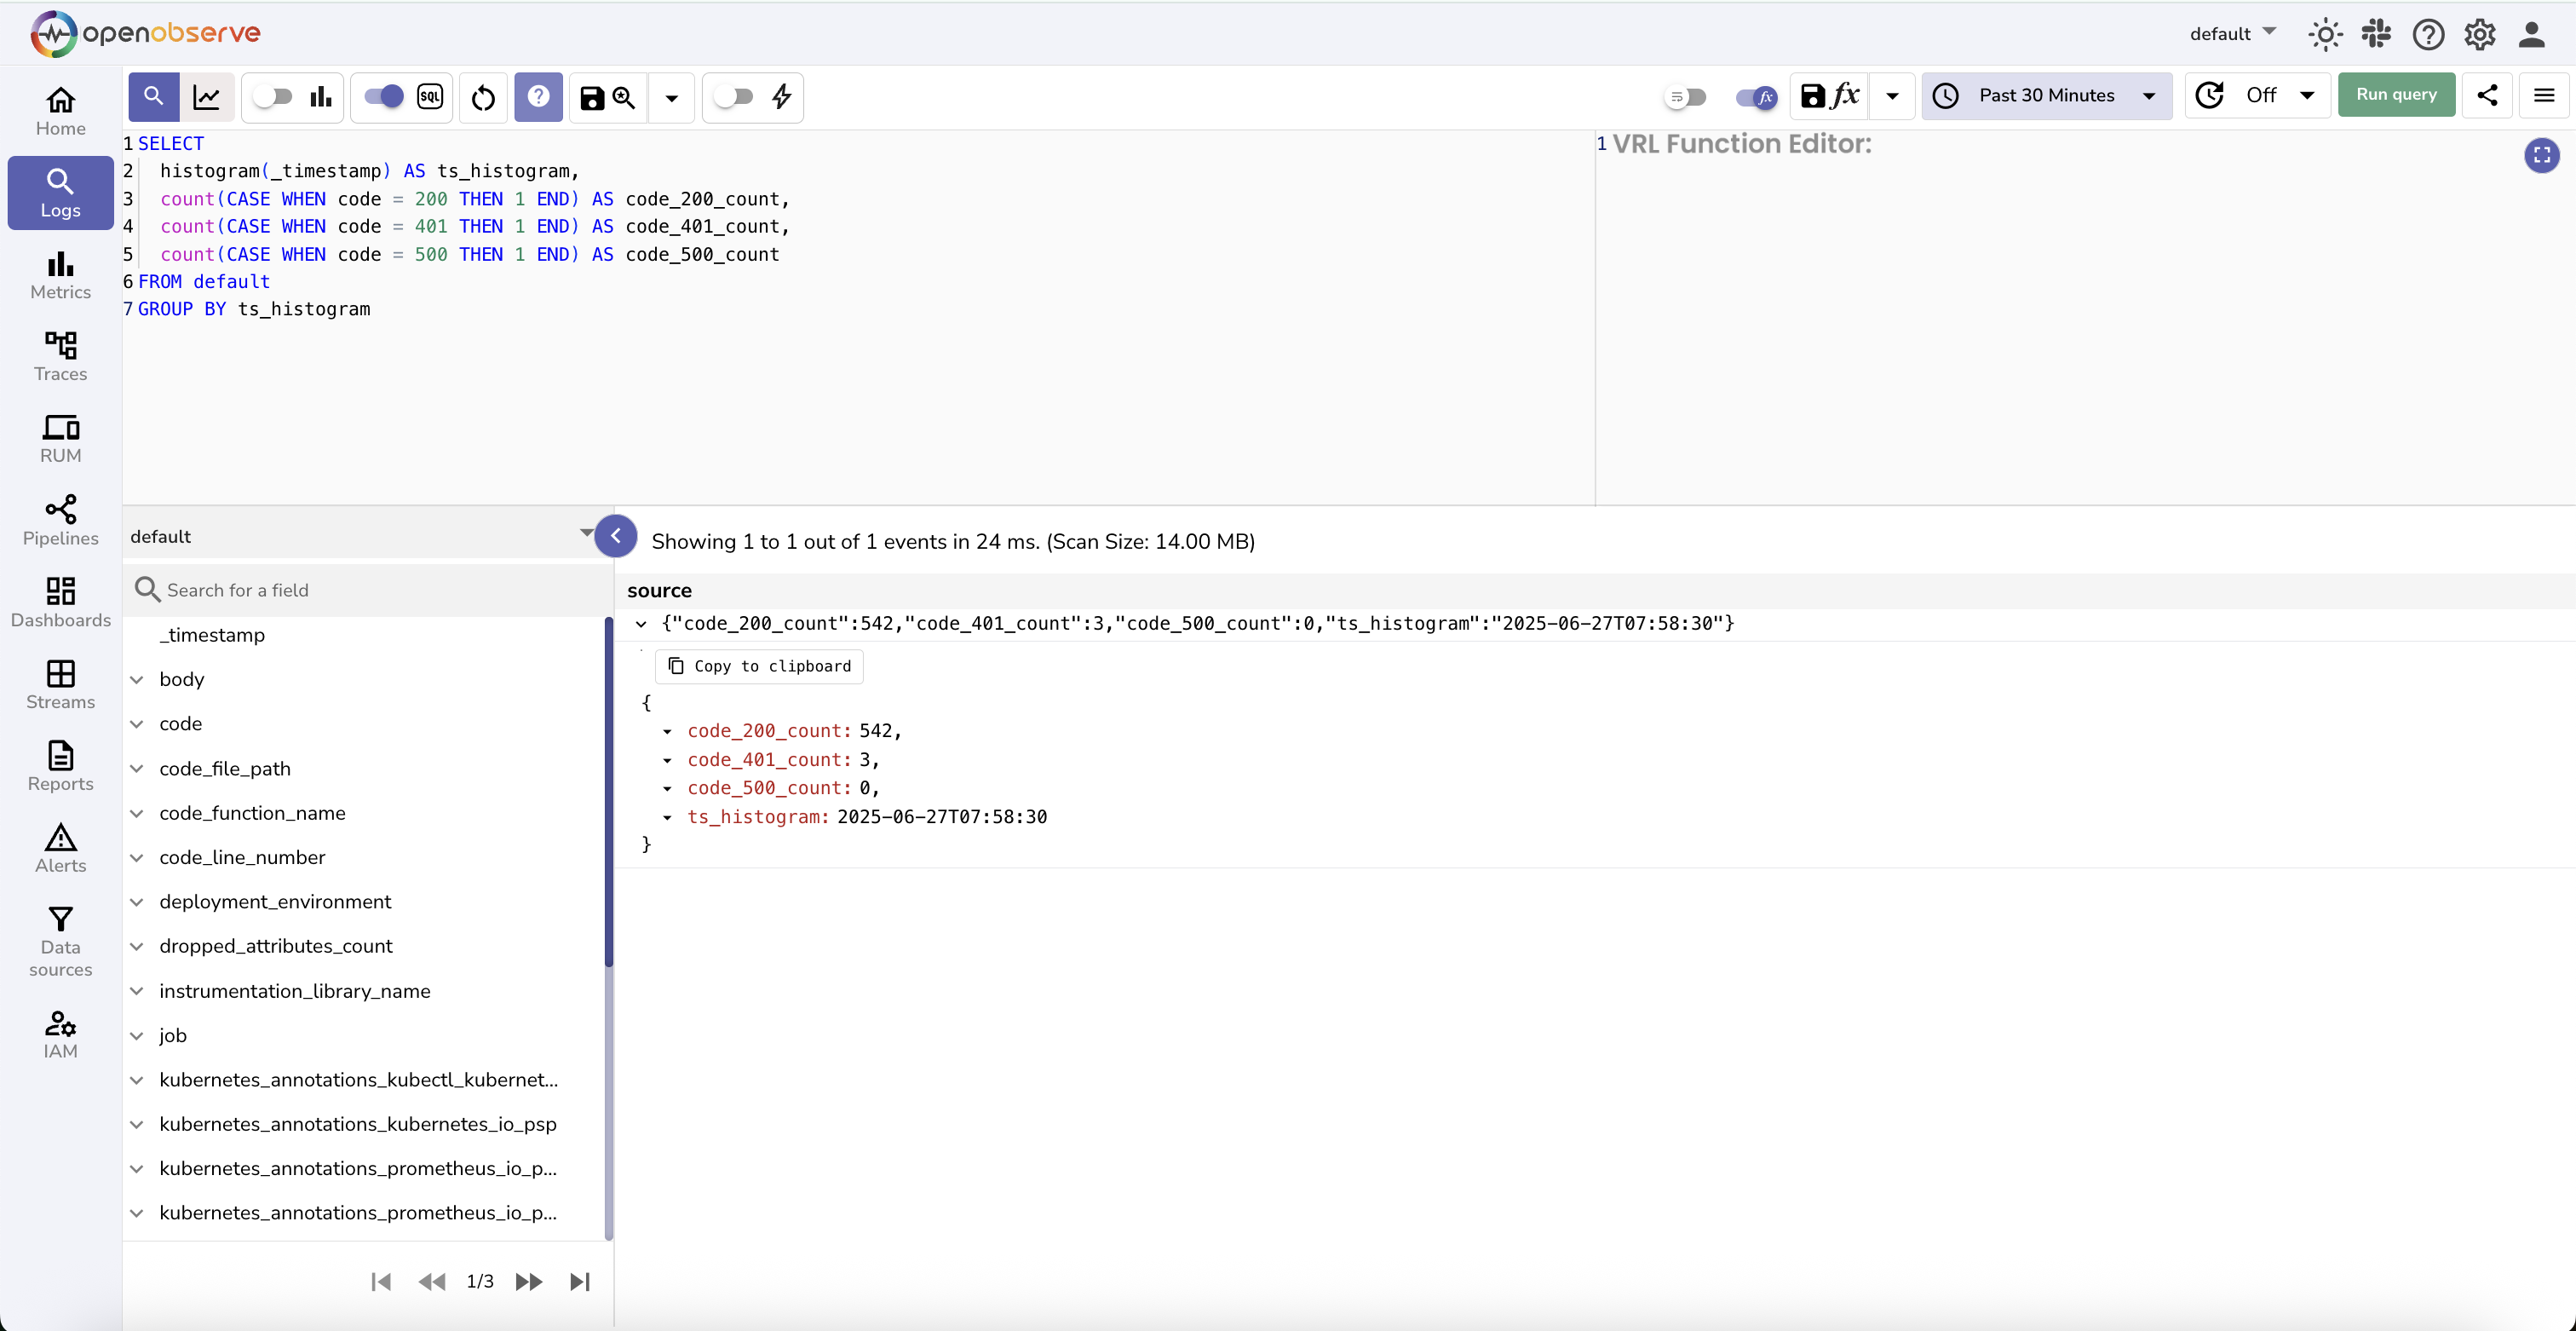
Histogram of log timestamps with status code counts:
SELECT
  histogram(_timestamp) AS ts_histogram,
  count(CASE WHEN code = 200 THEN 1 END) AS code_200_count,
  count(CASE WHEN code = 401 THEN 1 END) AS code_401_count,
  count(CASE WHEN code = 500 THEN 1 END) AS code_500_count
FROM your_stream_name
GROUP BY ts_histogram
Replace your_stream_name with the actual stream name in your OpenObserve setup.
- histogram(_timestamp) bins timestamps into uniform intervals (e.g. hourly). You can configure the granularity in the UI or query if needed.
