MCP Server Observability: How to Trace, Monitor, and Debug Model Context Protocol Servers

Gorakhnath Yadav
June 25, 2026
22 min read
Don’t forget to share!
What Nobody Tells You About Running AI in Production
Try OpenObserve Cloud today for more efficient and performant observability.
TLDR
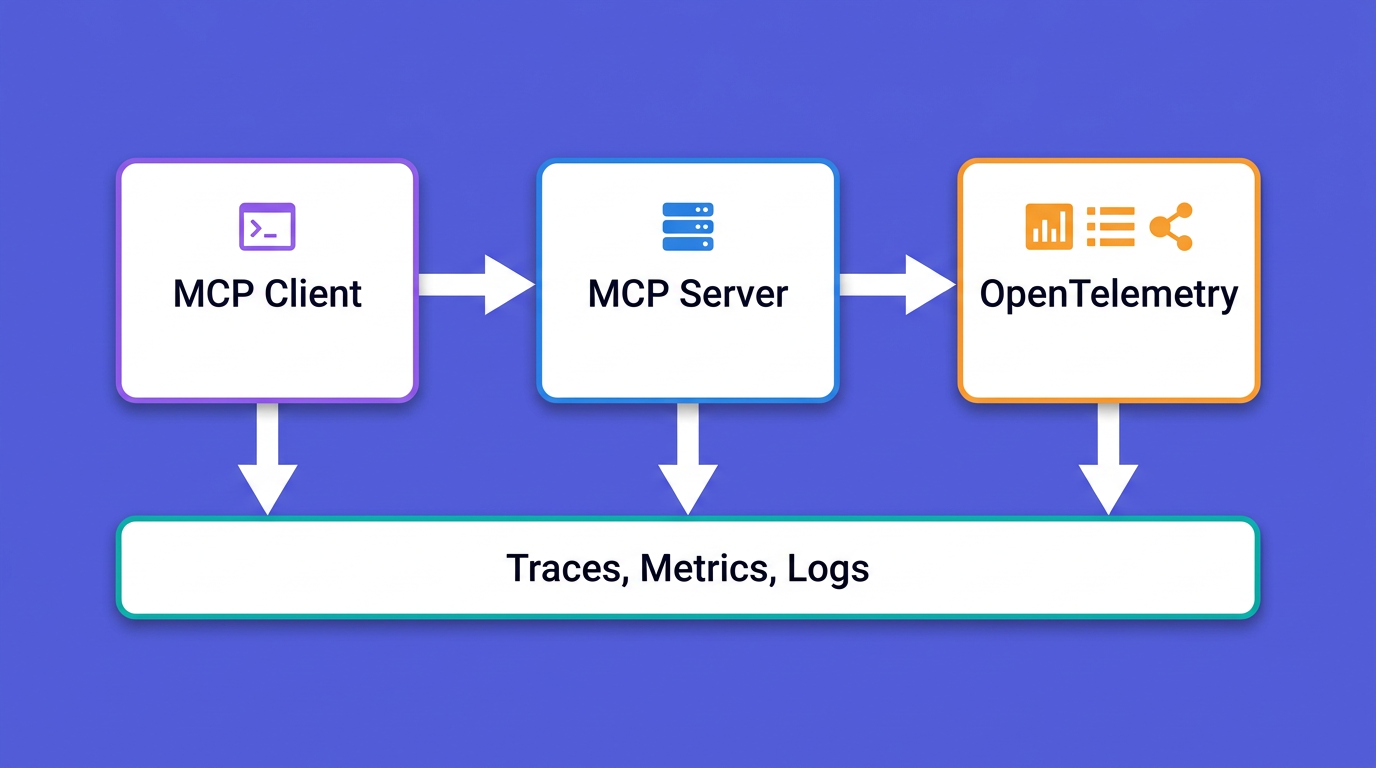
initialize, tools/list, and tools/call becomes a trace and a metric. This is the companion to running observability MCP servers, which is the consumer side.isError: true as a successful response, bloated tools/list payloads that waste LLM tokens, and transport timeouts on stdio.gen_ai.* for tool identity. Use mcp.method.name and gen_ai.tool.name, not mcp.tool.name, which the convention does not define._meta field (SEP-414), not HTTP headers, so the same approach works on stdio and Streamable HTTP.When you run an agent against a Model Context Protocol server, you can usually see the client side. The host application logs which tools the model picked and what came back. The server side is where you are blind. A tool call that takes four seconds, a tools/list response that quietly grew to 80 tools, a downstream API that returns a 500 wrapped in a polite isError result: none of that shows up unless you put it there.
This is the gap between consuming MCP servers and producing them. The consumer-side guide to observability MCP servers covers connecting an assistant like Claude or Cursor to your logs, metrics, and traces so you can ask questions in natural language. This post is the other direction: you wrote an MCP server, you put it in front of an agent, and now you need to know what it is doing under load, why a tool is slow, and which call actually failed.
The reason this is harder than instrumenting a normal HTTP service is that MCP is a stateful, JSON-RPC protocol with its own lifecycle, its own error model, and two transports that behave very differently. You cannot bolt on a generic web-framework middleware and call it done. You have to instrument the protocol. The good news is that OpenTelemetry gives you everything you need, and there is now a draft semantic convention that tells you exactly which attributes to set.
MCP is built on JSON-RPC 2.0. Every message is a request, a response, or a notification, and the protocol defines a strict order in which they flow. To instrument a server well, you need to know which methods exist and where each one tends to fail.
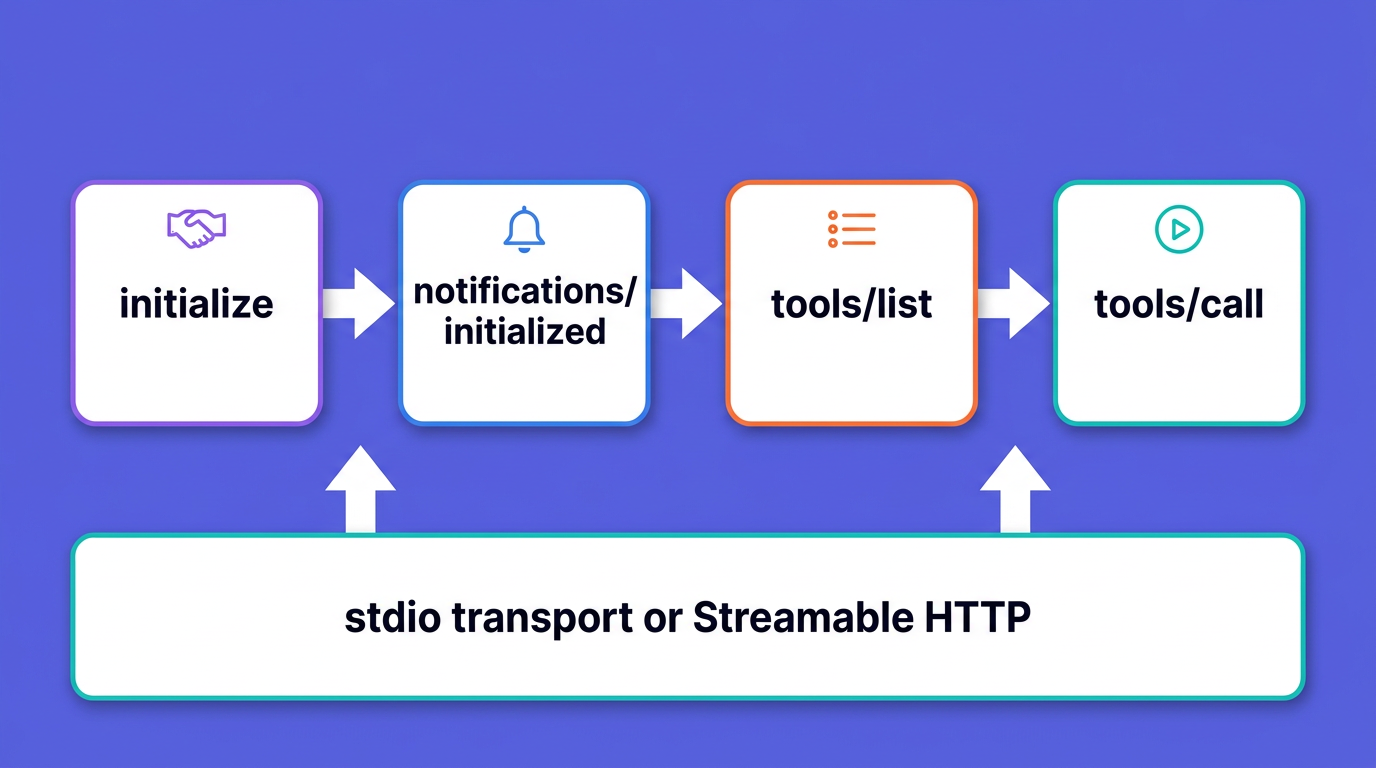
A session opens with an initialize request from the client, which carries the client's protocolVersion, its capabilities, and clientInfo. The server replies with its own protocolVersion, capabilities, and serverInfo. The client then sends a notifications/initialized notification, and only after that does normal operation begin. The current protocol revision is 2025-11-25, a calendar-versioned string the client and server have to agree on.
Failures here are subtle, and version negotiation in particular does not behave like an error path. If the server does not support the protocolVersion the client requested, it does not reject the request. Per the spec it replies with a successful initialize result carrying a version it does support, usually its latest, and the client is the one that decides to disconnect when it cannot speak that version. (The spec does show a -32602 "Unsupported protocol version" error as one possible path, but a normal mismatch is the successful counter-offer, not an error.) So a wave of incompatible clients produces no tool calls and, on the common path, no errors in your handlers either. If you do not trace initialize, those version-mismatch disconnects look like silence: just clients that never come back.
Before calling anything, the client asks for the catalog with tools/list. The server returns each tool's name along with its description, full inputSchema, and optional fields such as title, outputSchema, and annotations. This response is paginated, but in practice many servers return everything at once.
Here is the part most monitoring misses: that entire list is loaded into the model's context by the host application on the turns where it matters. A registry that grows from 8 tools to 60, each with a verbose description and a deep JSON Schema, silently inflates token usage on every request and degrades the model's ability to pick the right tool. The tools/list call itself may be fast, so latency alone will not warn you. You have to measure the size of the response: tool count and serialized bytes. We come back to this in its own section, because response size deserves to be tracked as a first-class signal.
Tool calls use the tools/call method, with params.name and params.arguments. The result is a CallToolResult: a content array of text, image, audio, or resource blocks (a resource link or an embedded resource), an optional structuredContent, and a boolean isError.
That isError field is the single most important thing to understand about MCP error handling. A tool that fails, a payment API that times out, a database that rejects a query, does not return a JSON-RPC error. It returns a perfectly successful JSON-RPC response with isError: true and the error text inside the content array. That design is deliberate: the failure is meant to be handed back to the model so it can self-correct. But it means any observability that only watches JSON-RPC-level errors will record every failed tool execution as a success. Your dashboards will read 100% healthy while half the tool calls are returning errors to the model. You must surface that failure in your telemetry: read result.isError where you get the wire result, or catch the raised exception in frameworks like FastMCP that signal failures that way, and set your span status from it.
JSON-RPC errors, by contrast, are reserved for protocol problems: an unknown tool, malformed parameters, an unhandled exception in the server. Both matter, and they mean different things.
MCP defines two standard transports, and timeouts and corruption happen in different ways on each.
On stdio, the client launches your server as a subprocess and exchanges newline-delimited JSON over stdin and stdout, where a single message must never contain an embedded newline. The one rule that breaks more stdio servers than anything else: your server must never write anything but valid MCP messages to stdout. A stray print(), a logging library that defaults to stdout, a dependency that prints a banner on import, any of these corrupts the JSON-RPC framing and kills the session. All logs go to stderr. This is also why your instrumentation must never export telemetry to stdout on a stdio server.
On Streamable HTTP (which replaced the older HTTP+SSE transport), the client POSTs JSON-RPC to a single endpoint and may hold open an SSE stream for server-initiated messages. Sessions are tracked with the MCP-Session-Id header, and every post-initialization request carries an MCP-Protocol-Version header. Failures show up as 400s for a missing session id or an invalid MCP-Protocol-Version, 404s for an expired session, and connections that drop mid-stream. The spec is explicit that a dropped SSE connection is not a cancellation: the client has to send an explicit notifications/cancelled.
| Symptom | Layer | What to capture |
|---|---|---|
| Clients connect then vanish | Session init | initialize spans, protocol-version attribute, disconnect rate |
| Token usage creeps up every release | Tool discovery | tools/list tool count and serialized byte size |
| Dashboards green, model retrying constantly | Tool execution | isError rate per tool, span status from isError |
| Random hangs on local servers | stdio transport | request timeouts, subprocess exit, stderr capture |
| Intermittent 400/404 under load | Streamable HTTP | session id presence, protocol-version header, stream drops |
It helps to think about an MCP server in three layers, from the wire up to the agent. Each layer has its own signals.
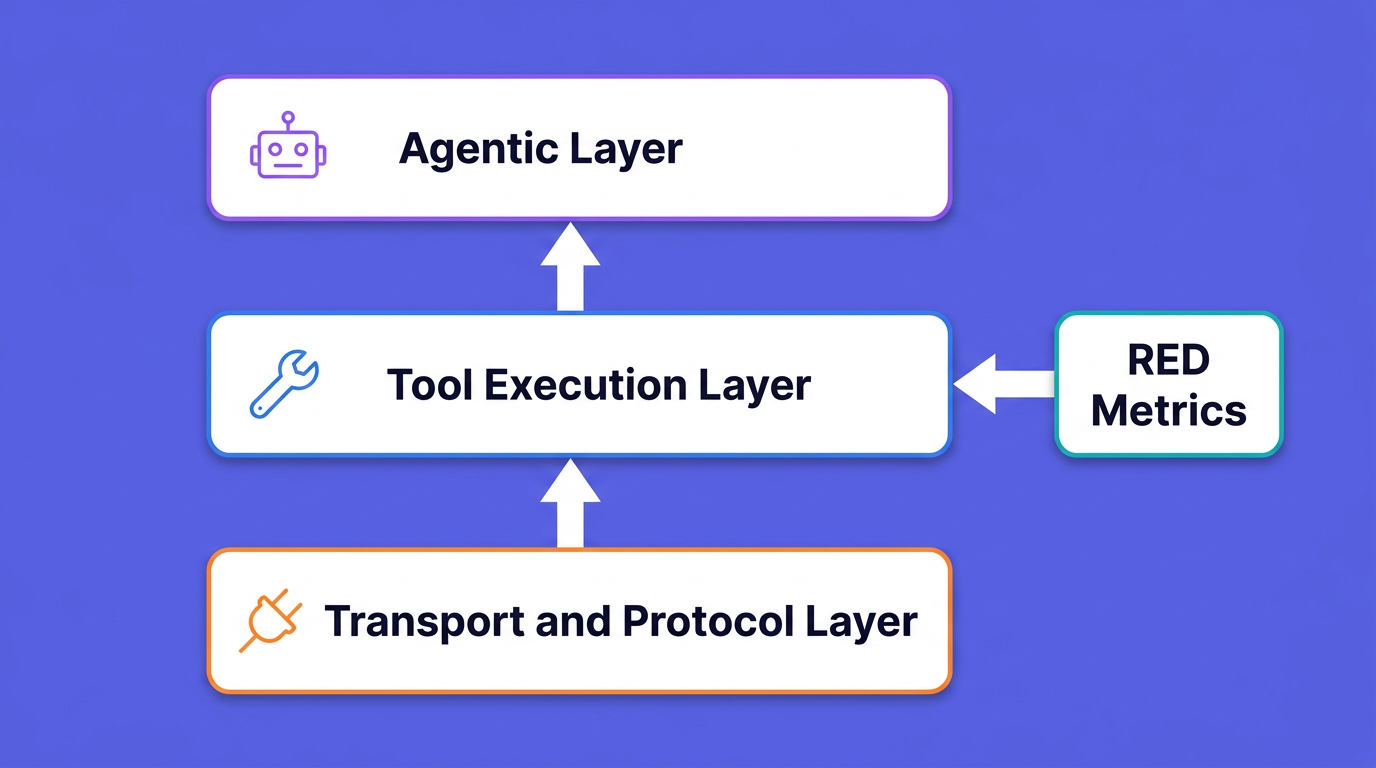
Transport and protocol layer. Handshake success rate, JSON-RPC error rates by code, active session count, request timeouts, and transport-level drops. This is your foundation. If the handshake is failing, nothing above it matters.
Tool execution layer. This is where RED metrics (rate, errors, duration) live, broken down per tool. Add payload sizes and the isError rate. A single slow or flapping tool can stall an entire agent run, so per-tool granularity is not optional.
Agentic layer. How tool behavior rolls up into the agent's experience: how many tool calls a task needed, how often the model retried, whether a slow tool dragged out total reasoning time. This is where MCP observability meets monitoring AI agents in production, and it is the layer that connects a backend regression to a degraded user experience.
For the tool execution layer, set latency targets and alert on them, but derive the numbers from your own baseline rather than a universal table: a tool that calls an external API has a very different floor than one that reads from memory, initialize and tools/list should be near-instant, and serving over Streamable HTTP adds network round-trip time on top. Capture p50/p95/p99 per method over a few days of normal traffic, then alert on regressions against that baseline.
For the protocol layer, the JSON-RPC error code tells you what to do.
| Code | Meaning | What it usually tells you |
|---|---|---|
-32700 |
Parse error | Malformed JSON reached the server; a framing or encoding bug |
-32600 |
Invalid Request | Not a valid JSON-RPC object |
-32601 |
Method not found | A JSON-RPC method the server does not implement (for example resources/read when you expose no resources). An unknown tool name usually comes back as -32602 or an isError result instead, depending on the SDK |
-32602 |
Invalid params | Bad arguments to a method or tool; many SDKs also return this when a tools/call names a tool you do not expose (a stale registry or a model hallucinating a tool name) |
-32603 |
Internal error | An unhandled server-side exception; page someone |
result with isError: true |
Tool execution error | The tool ran and failed; invisible at the JSON-RPC layer, fed back to the model to self-correct |
You do not have to invent your own span names and attributes. OpenTelemetry has MCP semantic conventions: they were first merged into the main semantic-conventions repository in January 2026, then moved to the dedicated semantic-conventions-genai repository, where the GenAI and MCP conventions are now maintained together. One caveat to set expectations: they are at Development stability, OpenTelemetry's most experimental tier. The names can still change, so pin the version you build against and expect to revisit it.
The conventions deliberately do not defer to the generic RPC conventions. An MCP span is its own thing, with this shape:
{mcp.method.name} {target}, where the target is the tool or prompt name when there is one. So a tool call is named tools/call get_weather, and a handshake is just initialize.CLIENT on the client side, SERVER on the server side.ERROR whenever error.type is set.The attributes you actually set fall into a few groups.
| Attribute | Notes |
|---|---|
mcp.method.name |
Required on every MCP span, for example tools/call or tools/list |
mcp.session.id |
The session identifier, for correlation |
mcp.protocol.version |
For example 2025-11-25 |
mcp.resource.uri |
Required for resource operations |
gen_ai.tool.name |
The tool name; this is where tool identity lives |
gen_ai.operation.name |
execute_tool for tool calls |
jsonrpc.request.id |
The JSON-RPC request id |
error.type |
Set on failure; drives span status |
The trap to avoid: mcp.tool.name does not exist in the convention. Tool identity comes from gen_ai.tool.name, because MCP reuses the GenAI conventions for anything tool-shaped. Watch out for mcp.tool.name, mcp.request.id, and rpc.system="jsonrpc": none of those are in the spec, and if you copy them your spans will not line up with anyone else's tooling. The mcp.* namespace defines exactly four attributes; tool identity lives in gen_ai.*, and JSON-RPC specifics live in jsonrpc.*, with one exception: the JSON-RPC error code uses the generic rpc.response.status_code.
FastMCP, the high-level Python framework whose 1.0 release was folded into the official MCP Python SDK, has a middleware system that is the cleanest place to hang instrumentation. One install note: this middleware lives in the standalone FastMCP 2.x package (pip install fastmcp), not in the FastMCP bundled with the official mcp SDK. You subclass Middleware, override the hook for the operation you care about, and register it once. The on_call_tool hook wraps the full tool execution and hands you the tool name and arguments going in. One FastMCP detail to know: in middleware a failing tool surfaces as a raised exception rather than an isError flag (that flag lives on the wire-level CallToolResult the model eventually sees), so the hook catches exceptions to mark the span.
First, the OpenTelemetry setup. Export OTLP over HTTP via the standard OTEL_EXPORTER_OTLP_ENDPOINT environment variable, so the same code points at a local Collector or straight at OpenObserve. Read more about the moving parts in the OTLP exporters guide.
from opentelemetry import trace
from opentelemetry.sdk.resources import Resource
from opentelemetry.sdk.trace import TracerProvider
from opentelemetry.sdk.trace.export import BatchSpanProcessor
from opentelemetry.exporter.otlp.proto.http.trace_exporter import OTLPSpanExporter

resource = Resource.create({"service.name": "weather-mcp-server"})
provider = TracerProvider(resource=resource)
# With no arguments the exporter reads OTEL_EXPORTER_OTLP_ENDPOINT and appends
# /v1/traces. In the local stack below that points at the Collector, which
# forwards to OpenObserve. To skip the Collector and export straight to
# OpenObserve, pass the full path and auth instead:
#   OTLPSpanExporter(
#       endpoint="http://localhost:5080/api/default/v1/traces",
#       headers={"Authorization": "Basic <base64(email:password)>"},
#   )
provider.add_span_processor(BatchSpanProcessor(OTLPSpanExporter()))
trace.set_tracer_provider(provider)
tracer = trace.get_tracer("mcp.server")
Now the middleware. It extracts any upstream trace context from _meta, opens a SERVER span named per the conventions, sets the MCP attributes, and marks the span ERROR if the tool raises.
from fastmcp.server.middleware import Middleware, MiddlewareContext
from opentelemetry import propagate
from opentelemetry.trace import SpanKind, Status, StatusCode

class OTelMiddleware(Middleware):
    async def on_call_tool(self, context: MiddlewareContext, call_next):
        tool_name = context.message.name

        # Continue the client's trace: traceparent lives in _meta (SEP-414).
        # context.message.meta is a pydantic Meta object, so dump it to a
        # plain dict before the propagator can read the carrier keys.
        raw_meta = getattr(context.message, "meta", None)
        meta = raw_meta.model_dump(by_alias=True) if raw_meta is not None else {}
        parent_ctx = propagate.extract(meta)

        with tracer.start_as_current_span(
            f"tools/call {tool_name}",
            kind=SpanKind.SERVER,
            context=parent_ctx,
        ) as span:
            span.set_attribute("mcp.method.name", "tools/call")
            span.set_attribute("gen_ai.tool.name", tool_name)
            span.set_attribute("gen_ai.operation.name", "execute_tool")
            # The isError trap: in FastMCP middleware a failed tool raises
            # rather than returning isError, so catch it to mark the span.
            try:
                result = await call_next(context)
            except Exception as exc:
                span.set_status(Status(StatusCode.ERROR))
                span.set_attribute("error.type", exc.__class__.__name__)
                span.record_exception(exc)
                raise
            return result
Register it on your server:
from fastmcp import FastMCP

mcp = FastMCP("weather-mcp-server")
mcp.add_middleware(OTelMiddleware())
The same pattern extends to the other hooks. Override on_list_tools to capture tools/list size, on_read_resource to set mcp.resource.uri, and on_message if you want a span on every inbound message. FastMCP ships built-in timing, logging, and error-handling middleware you can read for reference.
The TypeScript SDK has no general middleware chain, so you instrument by wrapping the handler you register. Every handler receives a second argument, RequestHandlerExtra, which carries sessionId, requestId, and the incoming _meta. That _meta is where you read the upstream traceparent.
import {
  trace,
  context,
  propagation,
  SpanKind,
  SpanStatusCode,
} from "@opentelemetry/api";

const tracer = trace.getTracer("mcp.server");

server.registerTool("get_weather", toolConfig, async (args, extra) => {
  // traceparent travels in _meta, not headers (works on stdio too).
  const parentCtx = propagation.extract(context.active(), extra._meta ?? {});

  return tracer.startActiveSpan(
    "tools/call get_weather",
    { kind: SpanKind.SERVER },
    parentCtx,
    async (span) => {
      span.setAttribute("mcp.method.name", "tools/call");
      span.setAttribute("gen_ai.tool.name", "get_weather");
      span.setAttribute("mcp.session.id", extra.sessionId ?? "");
      span.setAttribute("jsonrpc.request.id", String(extra.requestId));
      try {
        const result = await getWeather(args);
        if (result.isError) {
          span.setStatus({ code: SpanStatusCode.ERROR });
          span.setAttribute("error.type", "tool_execution_error");
        }
        return result;
      } catch (err) {
        span.setStatus({ code: SpanStatusCode.ERROR });
        span.recordException(err as Error);
        throw err;
      } finally {
        span.end();
      }
    },
  );
});
One Node-specific setup detail: propagation.extract uses the globally registered propagator, which defaults to a no-op. Initialize the OpenTelemetry Node SDK (it registers the W3C trace context propagator by default) or call propagation.setGlobalPropagator(new W3CTraceContextPropagator()) yourself. Without it the extract call silently returns an empty context and your server span starts a brand-new trace instead of joining the client's.
If you register many tools, wrap this in a small withToolSpan(name, handler) helper so the instrumentation lives in one place instead of being copy-pasted into every tool. For lower-level servers, wrap the setRequestHandler(CallToolRequestSchema, ...) callback instead and read the same fields off extra.
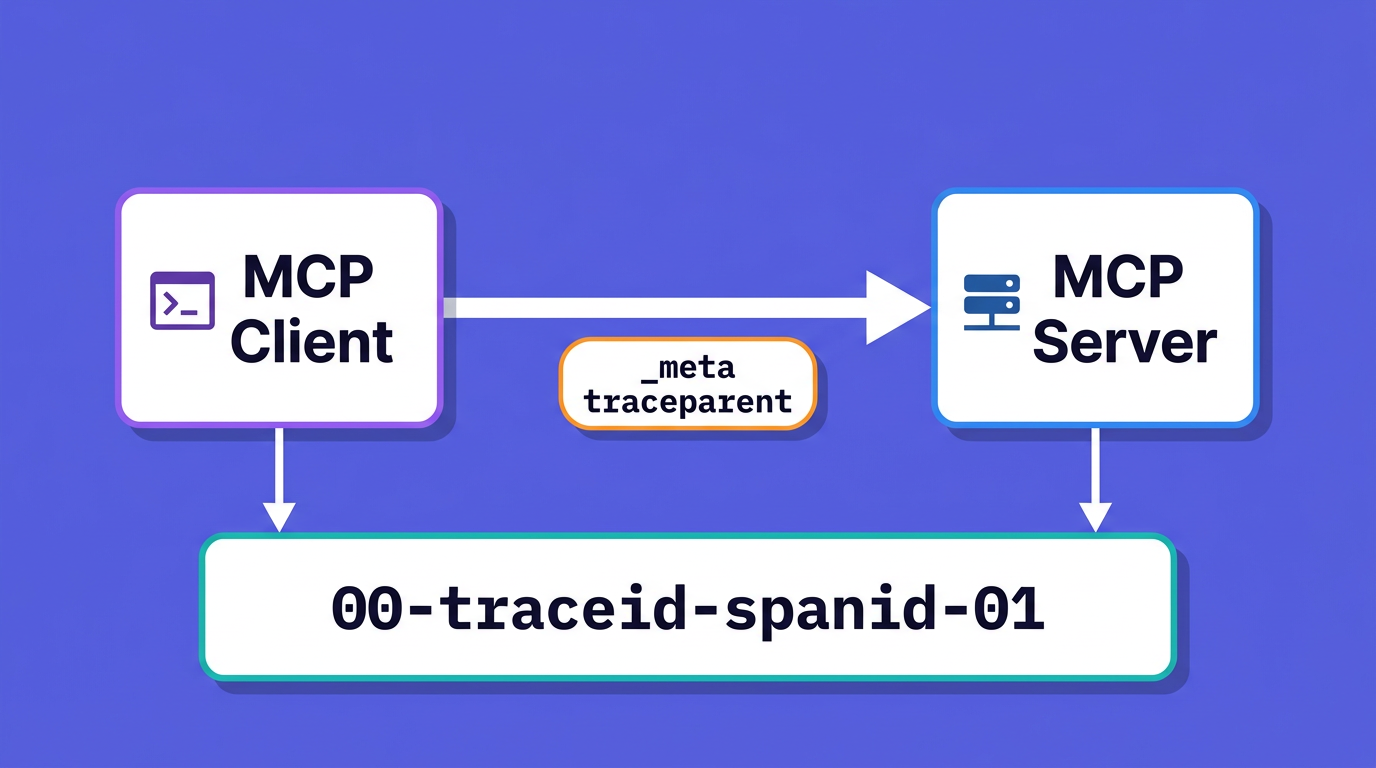
A span on your server is useful. A span on your server that is a child of the client's span, joined into one trace that runs from the agent through the MCP call to your downstream API, is what actually lets you debug. The question is how the trace id crosses the boundary.
For a normal HTTP service you would put W3C traceparent in a request header. MCP is different, and the answer is now standardized. SEP-414, which reached Final status, documents that trace context travels in the MCP _meta field using the keys traceparent, tracestate, and baggage. The important detail: these keys are written unprefixed, as a documented exception to the usual reverse-DNS naming rule for _meta keys, specifically so they stay compatible with existing OpenTelemetry tooling.
A tools/call request with context attached looks like this:
{
  "jsonrpc": "2.0",
  "id": 7,
  "method": "tools/call",
  "params": {
    "name": "get_weather",
    "arguments": { "location": "New York" },
    "_meta": {
      "traceparent": "00-0af7651916cd43dd8448eb211c80319c-00f067aa0ba902b7-01"
    }
  }
}
The traceparent value follows the W3C format {version}-{trace-id}-{parent-id}-{flags}, where the trailing 01 means the trace is sampled. On the server, the propagate.extract(meta) call in the Python example and propagation.extract(context.active(), extra._meta) in the TypeScript example pull that context out and make your span a child of it.
Why _meta instead of HTTP headers? Two reasons, and both are the point of the design. First, stdio has no headers at all, so a header-based scheme would only ever work on one transport. Second, even over Streamable HTTP a single long-lived SSE connection can carry many tool calls; a header rides with the transport, while _meta travels in the message, giving every individual tools/call its own parent span. Putting context in the message instead of the transport is what makes one approach work everywhere.
You now have spans. You could write separate metric instruments by hand, but there is a better way: let the OpenTelemetry Collector derive the metrics from the spans you already emit. The spanmetrics connector reads every span on a traces pipeline and emits the RED metrics as two series: a calls counter and a duration histogram. Errors are not a separate metric; they are captured as a status.code dimension on the call count, so you read the error rate by filtering calls to status.code=Error. The connector then feeds both into a metrics pipeline.
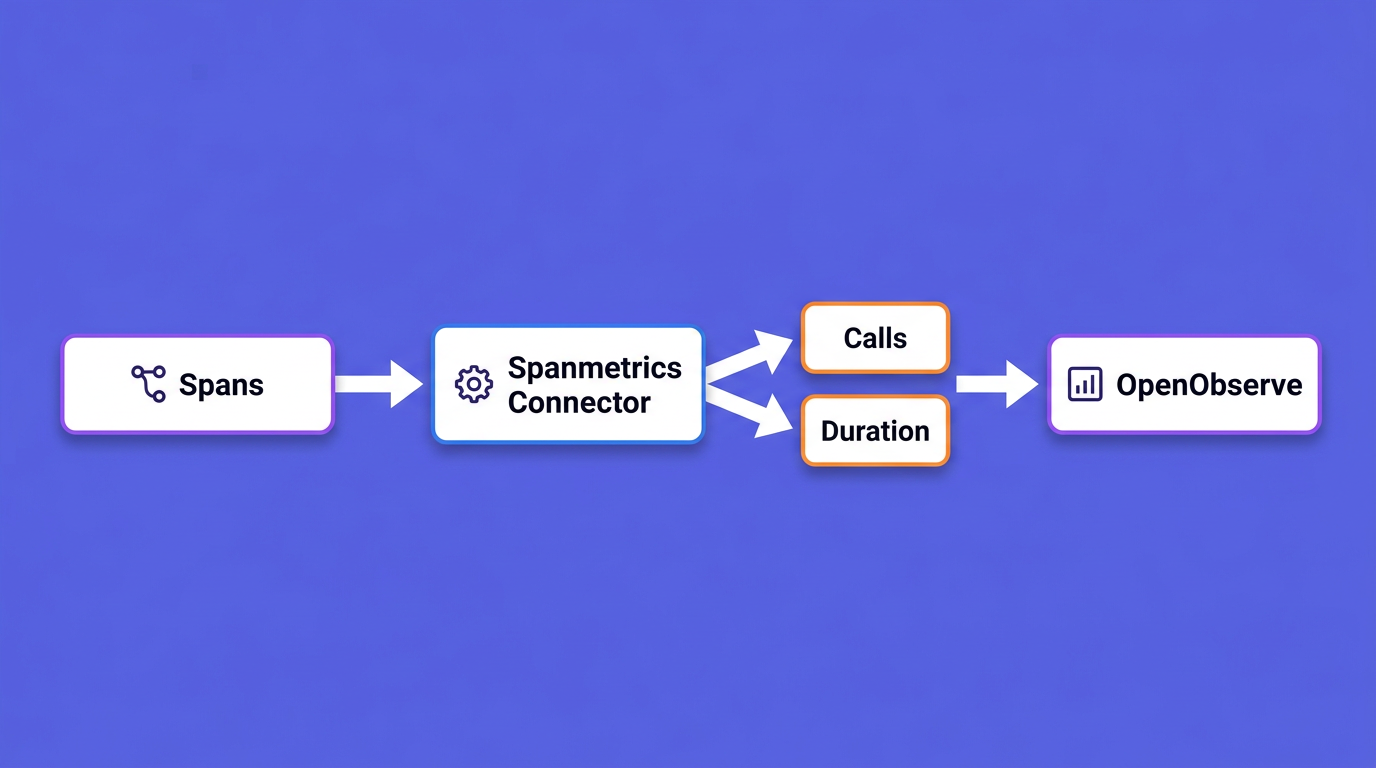
The key move is adding mcp.method.name and gen_ai.tool.name as custom dimensions, so the metrics break down per method and per tool rather than collapsing into one number.
receivers:
  otlp:
    protocols:
      grpc:
        endpoint: 0.0.0.0:4317
      http:
        endpoint: 0.0.0.0:4318

connectors:
  span_metrics:
    namespace: mcp.server
    histogram:
      unit: ms
      explicit:
        buckets: [5ms, 10ms, 25ms, 50ms, 100ms, 250ms, 500ms, 1s, 2s, 5s]
    dimensions:
      - name: mcp.method.name
      - name: gen_ai.tool.name
      - name: error.type

exporters:
  otlphttp/openobserve:
    endpoint: http://openobserve:5080/api/default
    headers:
      Authorization: "Basic <base64(email:password)>"

service:
  pipelines:
    traces:
      receivers: [otlp]
      exporters: [otlphttp/openobserve, span_metrics]
    metrics:
      receivers: [span_metrics]
      exporters: [otlphttp/openobserve]
The connector sits as an exporter on the traces pipeline and a receiver on the metrics pipeline. Note the component name: recent Collector builds use span_metrics (snake_case), while older builds use the now-deprecated spanmetrics, so match whichever your distribution expects. With this in place you get p50/p95/p99 latency and error rate per tool without touching your server code again.
tools/list is cheap to serve and easy to ignore, but its response size is a real cost: every tool name, description, and input schema in that response is loaded into the model's context by the host application, so a fat registry burns tokens on every turn and makes tool selection worse.
Instrument the discovery call to capture both its latency and its size. In FastMCP:
import json

class ToolsListMiddleware(Middleware):
    async def on_list_tools(self, context: MiddlewareContext, call_next):
        with tracer.start_as_current_span(
            "tools/list", kind=SpanKind.SERVER
        ) as span:
            span.set_attribute("mcp.method.name", "tools/list")
            tools = await call_next(context)
            # FastMCP's on_list_tools hands you its internal Tool objects;
            # convert to the wire type so the byte count matches what the
            # client actually receives over JSON-RPC.
            wire = [
                t.to_mcp_tool().model_dump(
                    mode="json", by_alias=True, exclude_none=True
                )
                for t in tools
            ]
            span.set_attribute("mcpserver.tools.count", len(tools))
            span.set_attribute(
                "mcpserver.tools.serialized_bytes", len(json.dumps(wire))
            )
            return tools
mcpserver.tools.count and mcpserver.tools.serialized_bytes are not in the semantic convention, so they live under a namespace you own rather than mcp.*, which the spec controls. The to_mcp_tool() conversion matters too: FastMCP's on_list_tools hands you its internal Tool objects, so you serialize the converted wire form to measure the bytes the client actually receives; calling model_dump() on the raw FastMCP objects both misses the wire shape and raises on non-JSON fields. Chart the serialized byte size over time and alert when it crosses a threshold. A registry that doubles after a release is a regression you want to catch before it shows up as a token bill or a drop in tool-selection accuracy. Watch the first tools/list after a cold start too, since lazy tool registration can make discovery slow exactly when a new client connects.
Three operational concerns separate a demo from something you run in production.
Sampling. Tracing every single tools/call at high volume is expensive and rarely necessary. Use head-based ratio sampling for a fixed percentage when you just need trends, and tail-based sampling in the Collector when you want to keep all the errors and slow calls while dropping the boring fast ones. Tail sampling is the better fit for MCP, because the traces you care about most are the failures and the long-tail latencies.
PII redaction. Tool arguments routinely contain exactly what you do not want in your telemetry: API keys, account numbers, raw user prompts. This is why the OpenTelemetry conventions make gen_ai.tool.call.arguments opt-in rather than default. If you record arguments, redact them first. Strip or hash sensitive fields in your middleware before they ever touch a span attribute, and never log full request bodies on a stdio server where they would also land in stderr.
Cardinality control. Every distinct value of a span attribute that becomes a metric dimension multiplies your time series. mcp.method.name is safe: there are only about thirty methods in the whole spec. gen_ai.tool.name is usually safe. Raw tool arguments, user ids, and session ids are not: put them on spans, never on metric dimensions. This is the producer-side version of deciding what not to monitor, and getting it wrong is how an observability bill quietly triples.
You can run the entire pipeline on your laptop: an instrumented MCP server, an OpenTelemetry Collector with the spanmetrics connector, and OpenObserve as the backend. Save the Collector config above as otel-collector.yaml, then use this docker-compose.yml.
services:
  openobserve:
    image: o2cr.ai/openobserve/openobserve-enterprise:latest
    environment:
      ZO_ROOT_USER_EMAIL: root@example.com
      ZO_ROOT_USER_PASSWORD: Complexpass#123
      ZO_DATA_DIR: /data
    ports:
      - "5080:5080"
    volumes:
      - o2-data:/data

  otel-collector:
    image: otel/opentelemetry-collector-contrib:latest
    command: ["--config=/etc/otel-collector.yaml"]
    volumes:
      - ./otel-collector.yaml:/etc/otel-collector.yaml
    ports:
      - "4317:4317"
      - "4318:4318"
    depends_on:
      - openobserve

  mcp-server:
    build: ./server
    environment:
      OTEL_EXPORTER_OTLP_ENDPOINT: http://otel-collector:4318
      OTEL_SERVICE_NAME: weather-mcp-server
    depends_on:
      - otel-collector

volumes:
  o2-data:
Point your server's OTLP exporter at the Collector (http://otel-collector:4318) instead of directly at OpenObserve, so the spanmetrics connector can do its work in between. Bring it up with one command:
docker compose up
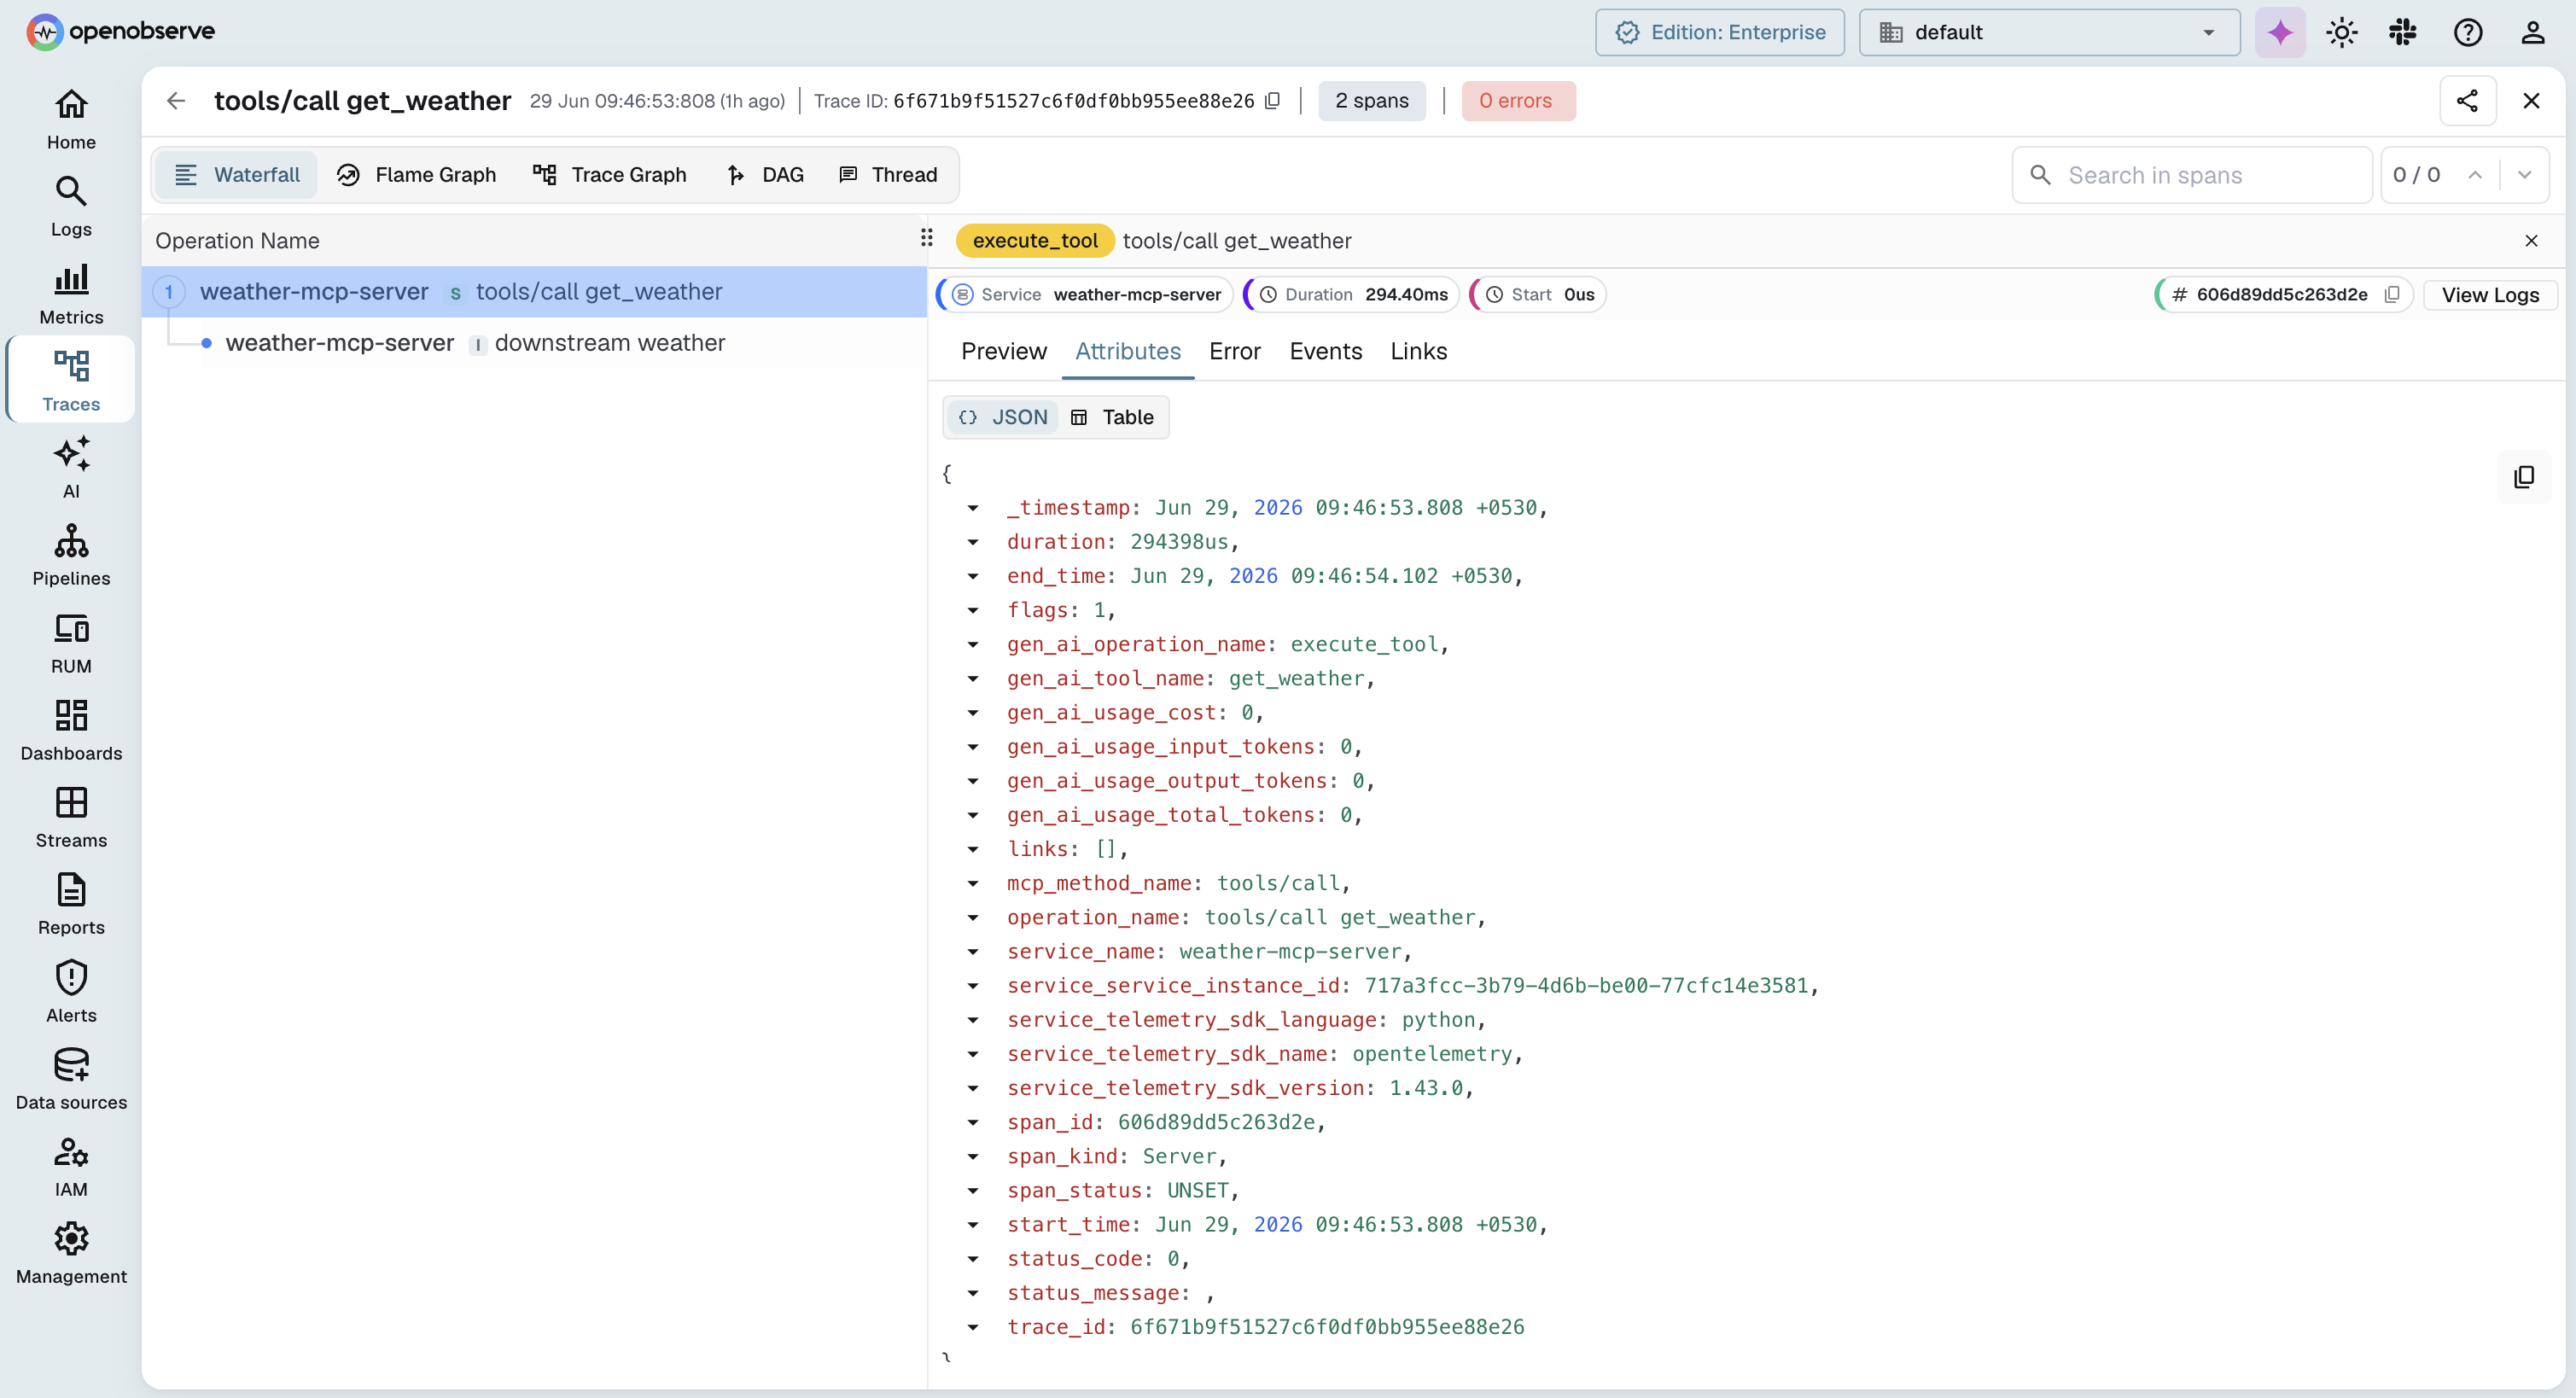
Open OpenObserve at http://localhost:5080, drive a few tool calls through your server, and you will see the traces arrive. A tools/call trace shows the server span with its child spans for any downstream work, and the per-tool RED metrics from the connector show up alongside. Correlating traces, metrics, and logs in one place is the whole reason to send them to the same backend, a point the logs, traces, and metrics correlation guide makes at length.
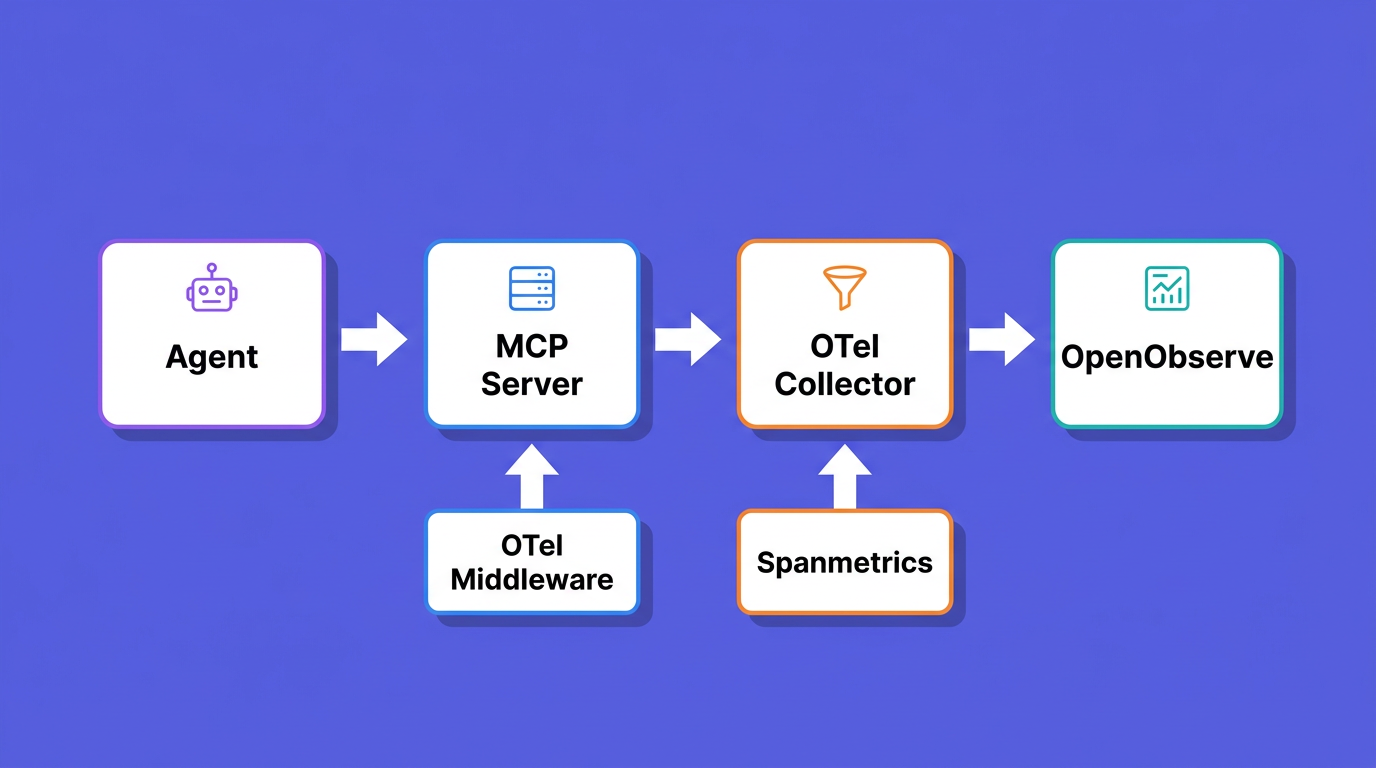
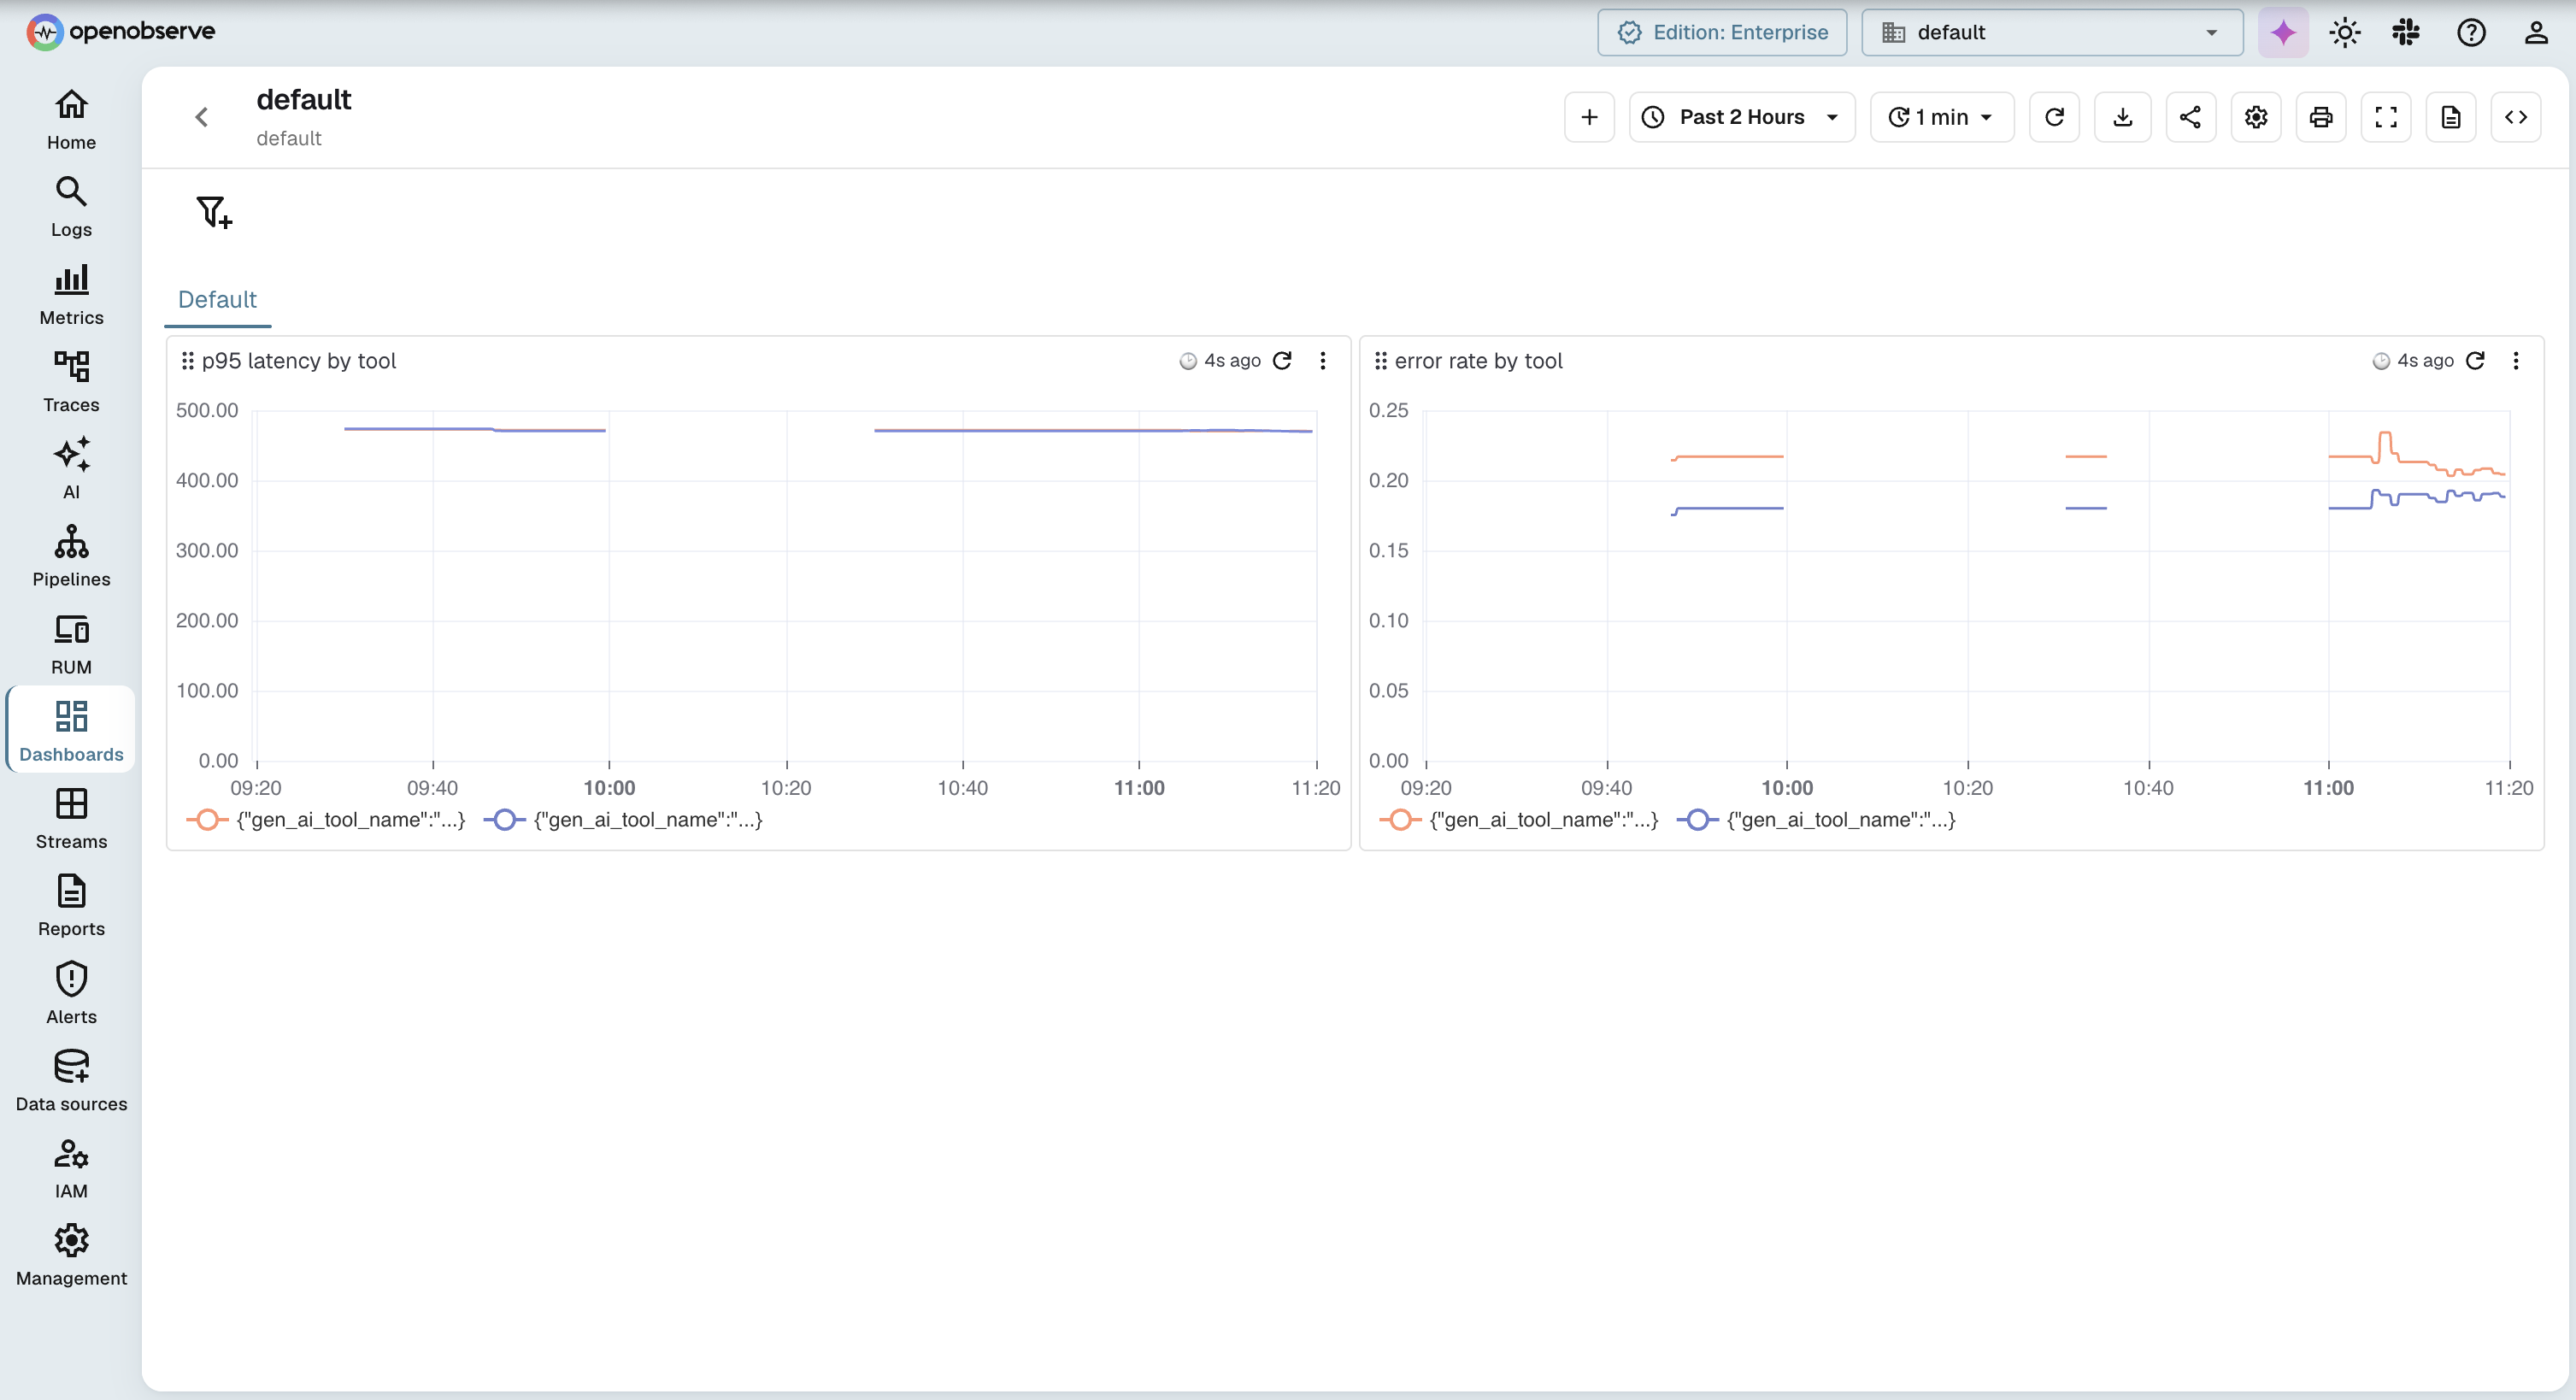
The pipeline here exports plain OTLP, so your MCP traces and the RED metrics from the spanmetrics connector land in one place; add a logs pipeline to the Collector and your server logs join them. From there you can open a tools/call trace, follow its child spans into the downstream API that was slow, and pivot to the per-tool latency chart without changing tools. Nothing in this setup is OpenObserve-specific: the same Collector and OTLP ingestion path points at any OTLP backend, so you are not locked in. If you want the hosted version, start with OpenObserve Cloud and send your first MCP trace in a few minutes.
Gorakhnath is a passionate developer advocate, working on bridging the gap between developers and the tools they use. He focuses on building communities and creating content that empowers developers to build better software.


