OpenTelemetry Collector Configuration: The Complete Guide




Ready to get started?
Try OpenObserve Cloud today for more efficient and performant observability.
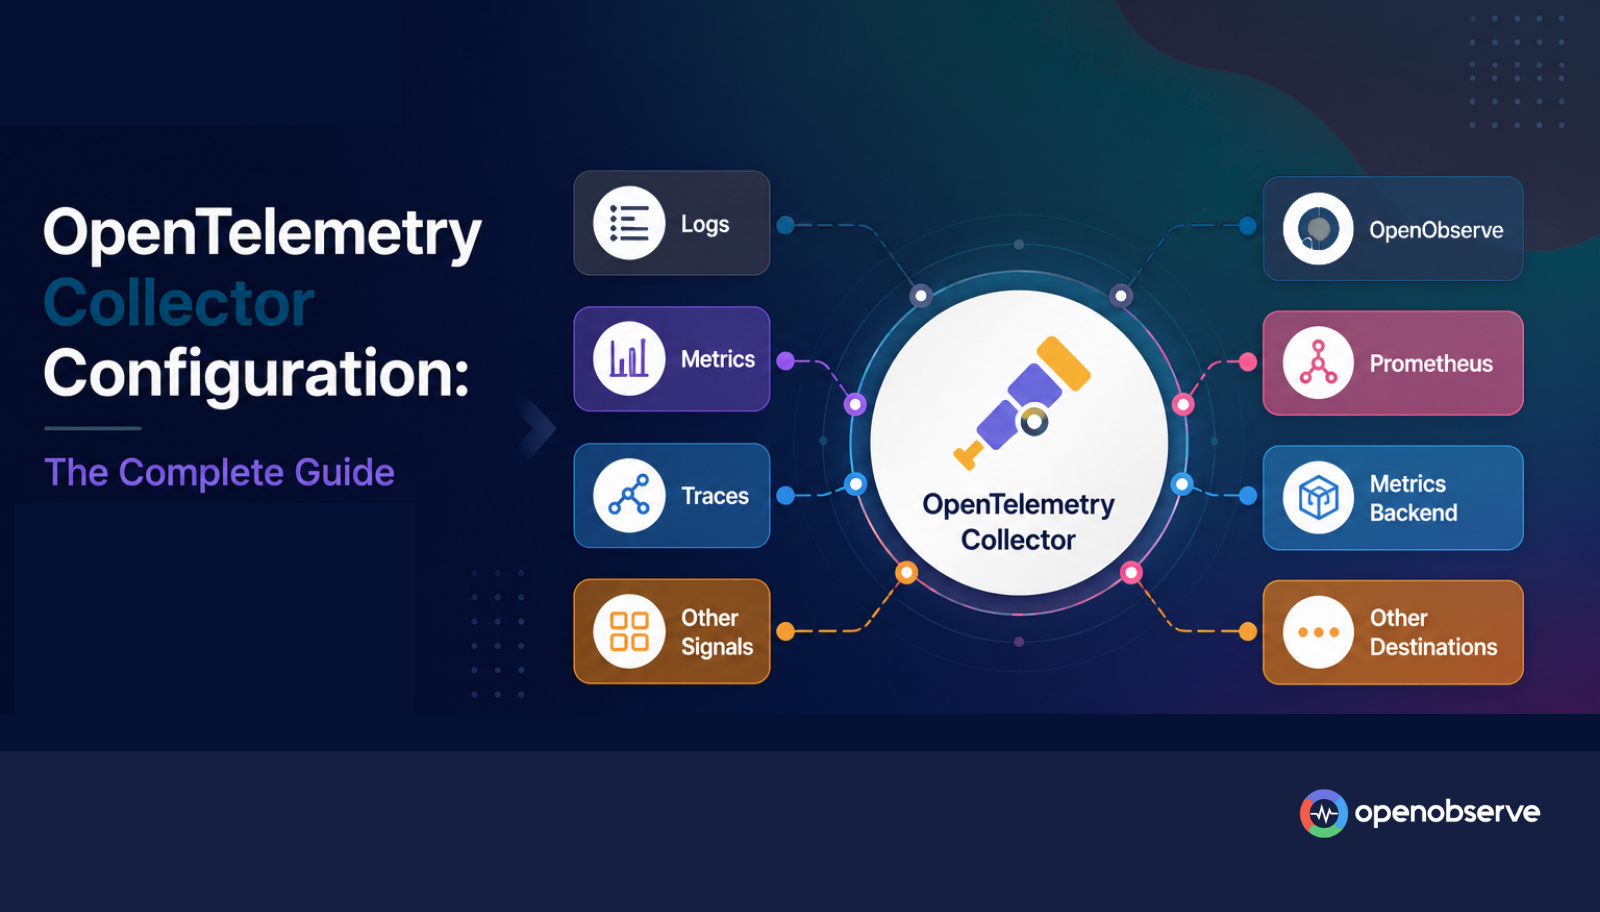
Most OpenTelemetry Collector problems aren't code problems, they're YAML problems: a processor defined but never added to a pipeline, an indentation slip that silently drops an exporter, a receiver listening on the wrong port. The Collector itself is stable and well-tested; what trips people up is the configuration file that tells it what to do.
This guide walks through OpenTelemetry Collector configuration from the ground up: the file's structure, every major section, working examples for each, and the mistakes that cause the most support tickets. By the end you'll be able to read, write, and debug an otel-collector-config.yaml with confidence.
TL;DR
An OpenTelemetry Collector configuration file has four component sections (receivers, processors, exporters, extensions) and one activation section (service). Defining a component isn't enough: it only runs once it's also referenced inside a service.pipelines entry. Get that one rule right and most configuration bugs disappear.
- Receivers define how telemetry gets in:
otlp,filelog,hostmetrics,prometheus, and dozens more. - Processors transform data in flight:
batch,memory_limiter,attributes,filter,transform(OTTL),k8sattributes. - Exporters define where data goes:
otlphttp,otlp,debug,file. - Extensions add supporting services:
health_check,zpages,pprof,basicauth. service.pipelinesis where you wire receivers, processors, and exporters together, separately for logs, metrics, and traces.- Validate before you deploy:
otelcol validate --config=config.yamlcatches most mistakes before they reach production.
What Is the OpenTelemetry Collector Configuration File?
The OpenTelemetry Collector is a single binary that does nothing on its own. Every behavior, what it listens on, how it transforms data, and where it forwards it, comes from one YAML file, conventionally called config.yaml or otel-collector-config.yaml, passed in at startup:
otelcol --config=config.yaml
# or, on the Contrib distribution:
otelcol-contrib --config=config.yaml
That single file replaces what would otherwise be several separate agents: a log shipper, a metrics scraper, a trace forwarder, and assorted enrichment scripts. If you're new to the Collector itself, our introduction to OpenTelemetry and Core vs. Contrib guide are good starting points before diving into configuration details.
Anatomy of an OTel Collector Config File
Every configuration file is built from the same five top-level keys:
receivers:
  # how data gets in

processors:
  # how data is transformed in flight

exporters:
  # where data goes

extensions:
  # supporting services: health checks, profiling, auth

service:
  # activates the components above by wiring them into pipelines
  extensions: []
  pipelines:
    traces:
    metrics:
    logs:
The section people trip over most is the relationship between the first four keys and service. Declaring a receiver, processor, or exporter under its top-level key only registers it as available; nothing actually runs until it's referenced inside a service.pipelines entry. This is the single most common source of "I added a processor and nothing changed" bug reports, covered in more detail in Common OTel Collector Configuration Mistakes below.
Component names follow a type or type/name pattern. otlp is a receiver type; otlphttp/openobserve is the otlphttp exporter type with the custom name openobserve, letting you define multiple instances of the same component type (say, otlphttp/openobserve and otlphttp/staging) side by side.
Configuring Receivers
Receivers define how telemetry enters the Collector. The most common one, by far, is otlp, which accepts data over gRPC and/or HTTP using the OpenTelemetry Protocol:
receivers:
  otlp:
    protocols:
      grpc:
        endpoint: 0.0.0.0:4317
      http:
        endpoint: 0.0.0.0:4318
Beyond otlp, common receivers include:
| Receiver | Use case |
|---|---|
filelog |
Tail log files from disk, common for Kubernetes container logs |
hostmetrics |
Scrape CPU, memory, disk, and network metrics from the host |
prometheus |
Scrape existing Prometheus /metrics endpoints |
kafkametrics / kafka |
Pull metrics or messages from Kafka |
dockerstats |
Collect container-level metrics from the Docker API |
Example: scraping host metrics alongside receiving OTLP traffic.
receivers:
  otlp:
    protocols:
      grpc:
        endpoint: 0.0.0.0:4317
  hostmetrics:
    collection_interval: 30s
    scrapers:
      cpu:
      memory:
      disk:
      network:
For examples wired to real services, see how we configure receivers for Kafka, Docker, and Airflow.
Configuring Processors
Processors sit between receivers and exporters, transforming data as it flows through the pipeline. Order matters: processors run in the sequence you list them in service.pipelines.
memory_limiter should always run first. It protects the Collector from OOM-crashing under load by refusing data once memory crosses a threshold:
processors:
  memory_limiter:
    check_interval: 1s
    limit_mib: 1000
    spike_limit_mib: 200
batch should run last, right before the data reaches your exporters. It groups telemetry into larger requests, which dramatically reduces the number of network calls to your backend:
processors:
  batch:
    timeout: 5s
    send_batch_size: 1000
Other processors you'll reach for regularly:
attributes: insert, update, delete, or hash attributes on incoming data.resource: modify resource-level attributes, like adding anenvironmentorservice.namespacetag.filter: drop entire records that match a condition, useful for cutting noisy or low-value telemetry before it's ingested. We cover this in depth in Filter Logs at Source in OTel Collector.transform: apply OTTL (OpenTelemetry Transformation Language) statements for arbitrary reshaping of records.k8sattributes: automatically enrich telemetry with Kubernetes metadata (pod name, namespace, node) based on the source IP.
processors:
  filter/drop_debug_logs:
    error_mode: ignore
    logs:
      log_record:
        - severity_text == "DEBUG"
  attributes/add_env:
    actions:
      - key: environment
        value: production
        action: upsert
Configuring Exporters
Exporters define where processed telemetry is sent. otlphttp and otlp are the standard choices for forwarding to any OTLP-compatible backend:
exporters:
  otlphttp/openobserve:
    endpoint: https://api.openobserve.ai/api/<your-org>/
    headers:
      Authorization: "Basic <base64(email:password)>"
Replace <your-org> with your OpenObserve organization slug and set the Authorization header using either your login credentials or a generated ingestion token; see the OpenObserve OTLP ingestion docs for the exact endpoint per signal type. For OpenObserve running self-hosted, point endpoint at your own instance and set insecure: true if you're not terminating TLS at the Collector.
Two exporters worth keeping in your back pocket for debugging:
exporters:
  debug:
    verbosity: detailed
  file:
    path: ./output.json
debug (the modern replacement for the old logging exporter) prints telemetry to stdout, which is invaluable when you're not sure whether data is actually reaching a pipeline stage. For a deeper dive into exporter configuration and the HTTP-vs-gRPC tradeoff, see our guide to OpenTelemetry OTLP exporters.
Configuring Extensions
Extensions add capabilities that aren't part of the data pipeline itself: health checks, diagnostics, and authentication.
extensions:
  health_check:
    endpoint: 0.0.0.0:13133
  zpages:
    endpoint: 0.0.0.0:55679
  pprof:
    endpoint: 0.0.0.0:1777
health_checkexposes a/endpoint your orchestrator (Kubernetes liveness probe, load balancer) can poll.zpagesserves an in-browser diagnostics page showing pipeline throughput and errors.pprofexposes Go profiling endpoints for debugging performance issues.basicauth: enforces HTTP basic auth on incoming receiver traffic, useful if yourotlpreceiver is exposed beyond a trusted network.
Extensions must also be listed under service.extensions to actually start, following the same activation rule as receivers, processors, and exporters.
Wiring It Together: The Service and Pipelines Block
The service block is where configuration becomes behavior. It activates extensions and defines one or more named pipelines per signal type, each listing which receivers, processors (in execution order), and exporters participate:
service:
  extensions: [health_check, zpages]
  pipelines:
    traces:
      receivers: [otlp]
      processors: [memory_limiter, batch]
      exporters: [otlphttp/openobserve]
    metrics:
      receivers: [otlp, hostmetrics]
      processors: [memory_limiter, batch]
      exporters: [otlphttp/openobserve]
    logs:
      receivers: [otlp, filelog]
      processors: [memory_limiter, filter/drop_debug_logs, batch]
      exporters: [otlphttp/openobserve, debug]
Note that you can define multiple pipelines of the same signal type (logs/app, logs/infra) if you need different receivers, processing, or destinations for different sources, and that a single receiver or exporter can be reused across multiple pipelines.
Using Environment Variables and Secrets in Your Configuration
Hardcoding credentials into config.yaml is a common mistake, especially once that file ends up in version control. The Collector supports environment variable expansion natively using ${env:VAR_NAME} syntax:
exporters:
  otlphttp/openobserve:
    endpoint: ${env:OPENOBSERVE_ENDPOINT}
    headers:
      Authorization: "Basic ${env:OPENOBSERVE_AUTH_TOKEN}"
Set the variables before starting the Collector, or inject them via your orchestrator (a Kubernetes Secret mounted as an environment variable, for example):
export OPENOBSERVE_ENDPOINT="https://api.openobserve.ai/api/myorg/"
export OPENOBSERVE_AUTH_TOKEN="base64-encoded-credentials"
otelcol-contrib --config=config.yaml
This keeps secrets out of the file entirely, so the config itself stays safe to commit and diff in pull requests.
Complete Example: OTel Collector Configuration for OpenObserve
Putting the pieces together, here's a working configuration that receives OTLP traffic and host metrics, applies basic hygiene processing, and exports everything to OpenObserve:
receivers:
  otlp:
    protocols:
      grpc:
        endpoint: 0.0.0.0:4317
      http:
        endpoint: 0.0.0.0:4318
  hostmetrics:
    collection_interval: 30s
    scrapers:
      cpu:
      memory:
      disk:

processors:
  memory_limiter:
    check_interval: 1s
    limit_mib: 1000
    spike_limit_mib: 200
  batch:
    timeout: 5s
    send_batch_size: 1000

exporters:
  otlphttp/openobserve:
    endpoint: ${env:OPENOBSERVE_ENDPOINT}
    headers:
      Authorization: "Basic ${env:OPENOBSERVE_AUTH_TOKEN}"

extensions:
  health_check:
    endpoint: 0.0.0.0:13133

service:
  extensions: [health_check]
  pipelines:
    traces:
      receivers: [otlp]
      processors: [memory_limiter, batch]
      exporters: [otlphttp/openobserve]
    metrics:
      receivers: [otlp, hostmetrics]
      processors: [memory_limiter, batch]
      exporters: [otlphttp/openobserve]
    logs:
      receivers: [otlp]
      processors: [memory_limiter, batch]
      exporters: [otlphttp/openobserve]
This is deliberately minimal. Layer in filelog, filter, attributes, or k8sattributes as your environment needs them, using the sections above as reference.
Validating Your Configuration
Before deploying a config change, validate it without starting the full Collector:
otelcol-contrib validate --config=config.yaml
This catches YAML syntax errors, unknown or misspelled fields, and pipelines that reference components you forgot to declare. It's worth wiring this into CI as a pre-merge check on any pull request that touches Collector configuration, since a broken config usually isn't discovered until the Collector fails to start in production.
You can also confirm data is actually flowing by pointing a pipeline at the debug exporter temporarily, or by checking the Collector's own internal metrics, exposed by default on :8888/metrics, for otelcol_receiver_accepted_spans, otelcol_exporter_sent_spans, and similar counters per signal.
Common OpenTelemetry Collector Configuration Mistakes
- Defining a component but never adding it to a pipeline. The most frequent cause of "I changed the config and nothing happened." A processor, receiver, or exporter under its top-level key does nothing until it's listed inside
service.pipelines. - Wrong processor order.
memory_limiternot listed first, orbatchnot listed last, both reduce their effectiveness. Processors execute in the exact order you list them. - Indentation errors. YAML is whitespace-sensitive; a misaligned key can silently nest a component under the wrong parent instead of throwing an obvious error.
- Referencing Contrib-only components on the Core binary.
filelog,k8sattributes, and most non-OTLP receivers only exist in the Contrib distribution. If validation fails with an "unknown component" error, check which binary you're running; see our Core vs. Contrib comparison for the full list. - Hardcoded credentials. Auth tokens and passwords committed directly into
config.yamlinstead of pulled from environment variables, as covered above. - No
memory_limiter. Without it, a traffic spike can OOM-crash the Collector instead of gracefully shedding load. - Skipping
batch. Sending every record as its own request adds unnecessary overhead to both the Collector and your backend.
OpenTelemetry Collector Configuration Best Practices
- Always run
memory_limiterfirst andbatchlast in every pipeline. - Pull secrets from environment variables, never hardcode them, so config files stay safe to commit.
- Validate on every change, ideally as an automated CI step, not just before a manual deploy.
- Keep pipelines separate per signal (logs, metrics, traces) rather than cramming unrelated processing into one, so a change to log filtering can't accidentally affect trace export.
- Name components descriptively (
otlphttp/openobserve,filter/drop_debug_logs) so a config file with a dozen components is still readable six months later. - Watch the Collector's own metrics on
:8888/metricsin production, so a misconfigured pipeline shows up as a drop inotelcol_exporter_sent_*rather than as a silent data gap. - Prefer OpenObserve's native pipelines for anything beyond basic filtering. OTTL is powerful but has a real learning curve; for teams that want a visual interface for filtering, parsing, enrichment, and redaction without hand-writing OTTL, OpenObserve's built-in pipelines cover most of the same ground with a much shorter feedback loop.
Conclusion
OpenTelemetry Collector configuration comes down to five sections and one rule: nothing runs until it's wired into a service.pipelines entry. Get the receivers right, keep memory_limiter first and batch last among your processors, pull secrets from environment variables, and validate before every deploy, and most of the friction people associate with the Collector disappears.
From here, go deeper on the pieces that matter most to your setup: filtering and OTTL, exporters and OTLP transport, or Core vs. Contrib distributions. And when you're ready to send this data somewhere, OpenObserve ingests OTLP natively, no proprietary agent required, so the configuration you build here works as-is.
Frequently Asked Questions
About the Author
Simran Kumari

Passionate about observability, AI systems, and cloud-native tools. All in on DevOps and improving the developer experience.
Follow OpenObserve on Google
Add OpenObserve as a preferred source to see more of our articles in Google Search and Top Stories.












