Top 10 LLM Observability Tools in 2026: Complete Comparison




Ready to get started?
Try OpenObserve Cloud today for more efficient and performant observability.
An LLM application can be technically "up" (200 responses, normal latency) while quietly failing: hallucinating answers, leaking a system prompt, or burning through a token budget three times faster than last week. None of that shows up in a uptime dashboard. LLM observability exists to catch exactly this class of failure, tracing, evaluating, and costing every layer between a prompt going in and a response coming out.
This guide ranks the top 10 LLM observability tools in 2026, open source and commercial, for AI engineering, platform, and SRE teams building production LLM applications.
If self-hosting or license terms are a hard requirement, see our dedicated Best Open Source LLM Observability Tools guide for a deeper look at Langfuse, Arize Phoenix, and other self-hostable options.
TL;DR: Key Takeaways
OpenObserve is the strongest LLM observability platform in 2026 for teams that don't want a second monitoring stack: native OpenTelemetry LLM tracing, per-model and per-session cost tracking, and results living in the same SQL-queryable platform as your logs, metrics, infrastructure traces, and RUM.
- Best overall: OpenObserve: unifies LLM tracing with infrastructure observability, so a cost spike or quality regression sits next to the telemetry that explains it.
- Best for cost tracking across models: OpenObserve: per-session, per-model token usage tracking with SQL-queryable cost breakdowns, no separate billing dashboard to check.
- Best for OpenTelemetry-native AI tracing: OpenObserve: accepts OTLP traces from LangChain, LlamaIndex, and any OTel GenAI-instrumented framework with no proprietary SDK.
- Best for teams avoiding tool sprawl: OpenObserve: one platform for ML engineers monitoring prompts and SREs monitoring infrastructure, instead of stitching together two vendors.
- Best for storage cost at scale: OpenObserve: columnar Parquet storage delivers approximately 140x lower storage costs in typical log workloads compared to Elasticsearch-based stacks; actual results vary based on data entropy and cardinality.
- Best for self-hosted or data-residency-sensitive teams: OpenObserve: fully self-hostable, LLM traces never have to leave your infrastructure.
What Is LLM Observability?
LLM observability is the practice of monitoring, tracing, and evaluating every layer of an AI application, from the prompt sent to the model to the final response returned, including intermediate steps like tool calls and retrieval stages in a RAG pipeline. It extends traditional observability with signals that only make sense for probabilistic, natural-language systems.
Core components of LLM observability:
- Tracing: capturing the full lifecycle of a request, including model calls, tool invocations, and retrieval steps, usually as a waterfall or span tree
- Evaluation: measuring output quality via automated scoring (relevance, faithfulness, toxicity, hallucination) or human review; see LLM Evals vs. Observability for how these two layers work together
- Cost and usage monitoring: tracking token consumption, latency, and spend per model, user, or session
- Prompt management: versioning and iterating on prompts without losing reproducibility
For a deeper look at why standard infrastructure signals miss all of this, see What Is LLM Observability? and OpenTelemetry for LLMs, which covers the OTel GenAI semantic conventions several tools on this list are standardizing around.
Why LLM Observability Matters in 2026
1. Failures are silent by default. A hallucinated answer, a leaked system prompt, or a subtly wrong RAG retrieval all return a normal HTTP 200. Nothing in standard APM flags any of it.
2. Costs are volatile and easy to miss. A single runaway agent loop, an unbounded context window, or a model version change can multiply token spend overnight; see Tracing a Runaway LLM Token Spike for what that looks like in practice.
3. Quality regressions compound quietly. A prompt change or model upgrade that shaves accuracy by a few percentage points won't trip an error-rate alert, but it erodes trust in the product over weeks.
4. Multi-step agent workflows multiply the failure surface. Every additional tool call or chained model invocation is another place for the pipeline to fail in a way a simple uptime check can't see.
5. Compliance and PII exposure are real risks. LLM traces routinely capture full user prompts and model outputs, which means observability tooling itself becomes a data handling surface; see Redacting PII from LLM Telemetry for how to manage that risk at the pipeline level.
What to Look for in an LLM Observability Tool
| Feature | Why It Matters |
| Tracing Depth | Full request lifecycle, including tool calls and RAG retrieval steps, not just the final model call |
| Framework Integrations | LangChain, LlamaIndex, OpenAI SDK, LiteLLM, and similar; determines setup friction |
| OpenTelemetry Compatibility | Avoids vendor lock-in and lets you route traces to any OTel-compatible backend |
| Evaluation Capabilities | LLM-as-judge scoring, human annotation, hallucination and drift detection |
| Cost Tracking | Per-user, per-model, per-session token and spend breakdowns |
| Infrastructure Correlation | Whether LLM traces live alongside logs, metrics, and infra traces, or in a separate silo you have to manually correlate |
| Deployment Model | Self-hosted, SaaS, or hybrid; affects data residency for prompts that may contain sensitive content |
| Pricing Model | Per-trace, per-span, per-seat, or bundled into a broader platform; shapes total cost as trace volume grows |
Top 10 LLM Observability Tools in 2026: Detailed Comparison
1. OpenObserve
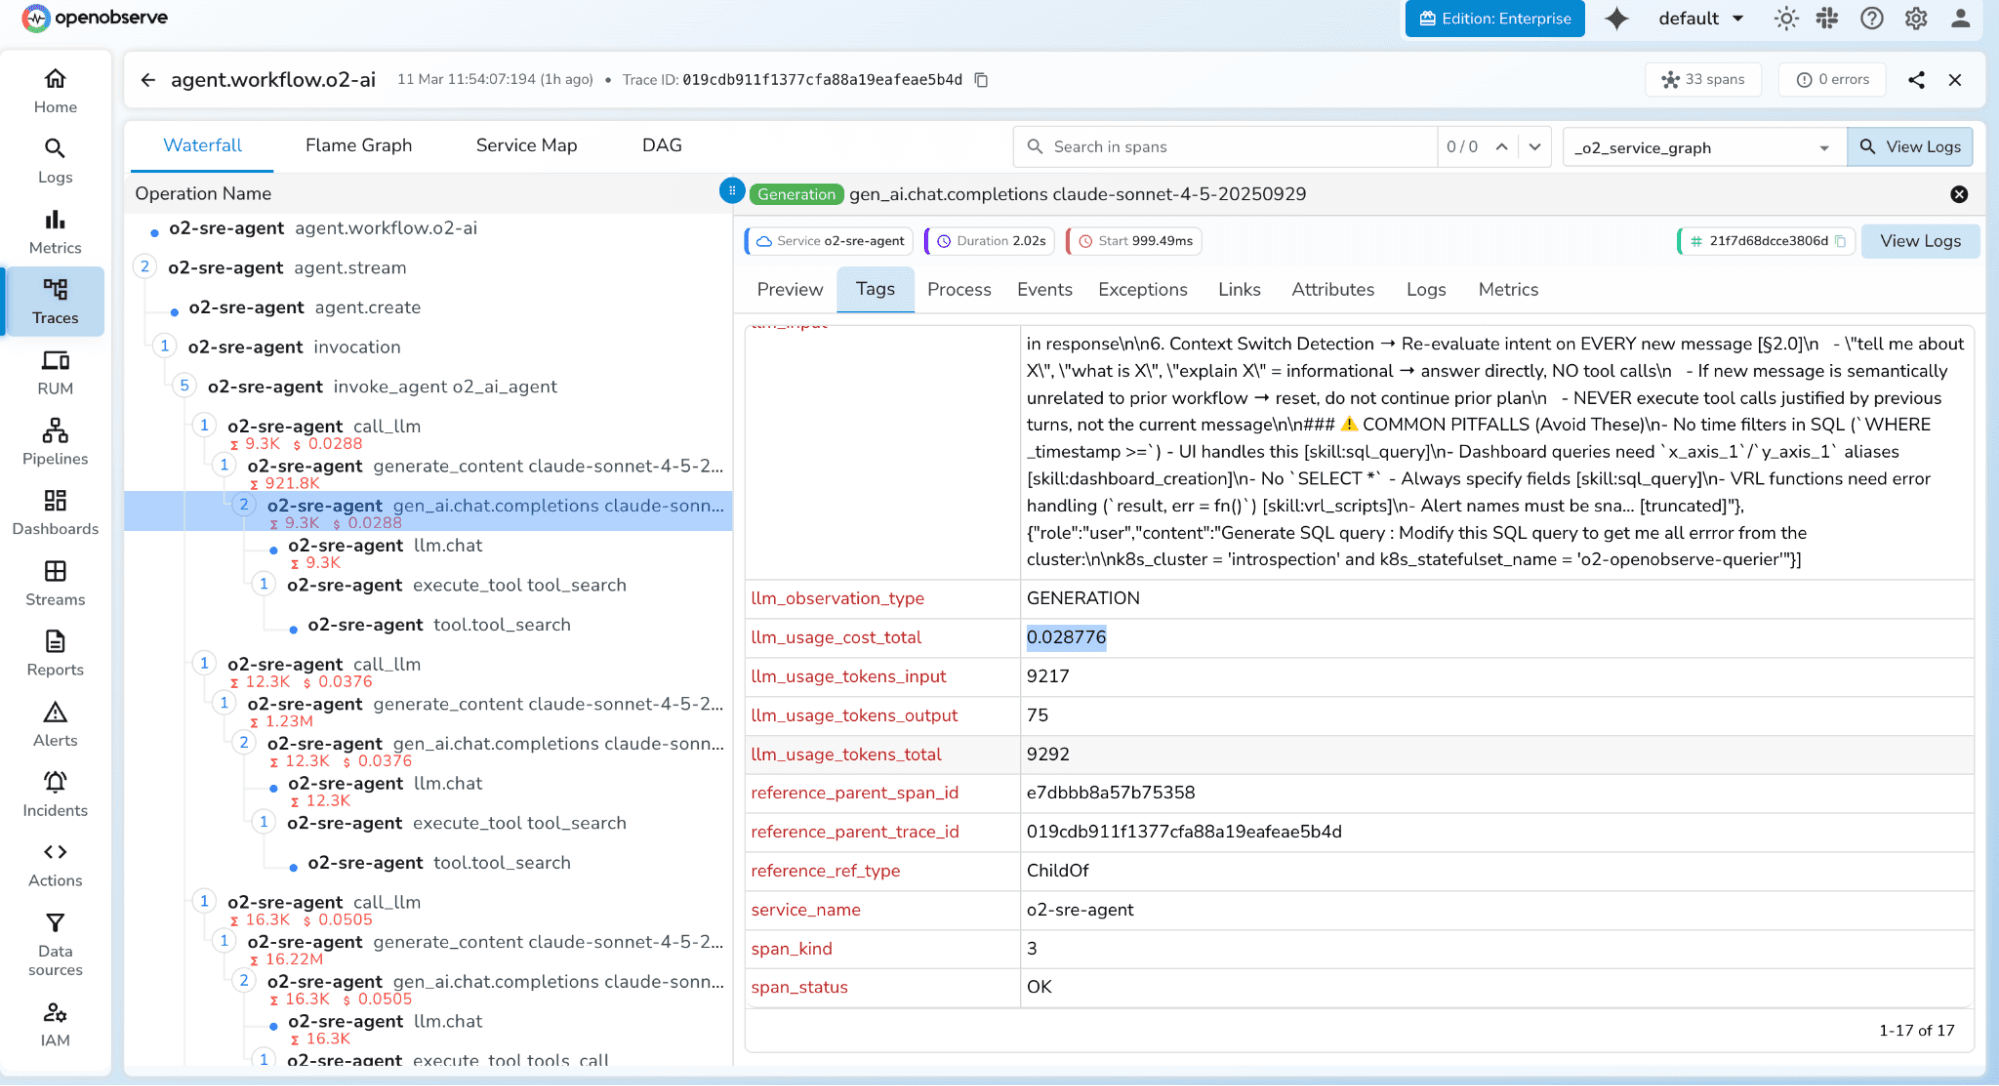
OpenObserve unifies LLM observability with full infrastructure monitoring, logs, metrics, traces, and RUM, in a single platform. While most tools on this list specialize narrowly in LLM concerns, OpenObserve treats an LLM trace as just another signal alongside the rest of your telemetry, so a token cost spike or a quality regression shows up next to the infrastructure state that explains it.
OpenObserve Pros:
- Unified Platform: LLM traces, infrastructure logs, metrics, traces, and RUM in one queryable platform, no second tool to correlate manually
- OpenTelemetry-Native: Accepts OTLP traces from LangChain, LlamaIndex, and any OTel GenAI-instrumented framework with no proprietary SDK to adopt
- SQL-Based Queries: Correlate LLM trace data with infrastructure signals using standard SQL instead of a proprietary query language
- Per-Session Cost Tracking: Token usage and spend broken down by model, user, and session, queryable like any other data
- Exceptional Storage Efficiency: Columnar Parquet format delivers approximately 140x lower storage costs in typical log workloads compared to Elasticsearch-based stacks; actual results vary based on data entropy and cardinality
- Self-Hosted or Cloud: Full data residency control for teams with sensitive prompt content, or a managed option for teams that don't want to operate infrastructure
- Single Binary Deployment: Self-hosted in minutes, no Kubernetes expertise required to get started
- Usage-Based Pricing: No separate per-trace charge stacked on top of your existing observability spend
OpenObserve Cons:
- LLM-specific features like LLM-as-judge evaluation and prompt management are handled through integrations rather than built-in modules, best paired with Langfuse or Opik for full eval coverage
Integration / Mitigation:
- Ingest LLM traces via OpenTelemetry from LangChain, LlamaIndex, or any OTel GenAI-instrumented application
- Pair with an evaluation-focused tool like Langfuse or Comet Opik when LLM-as-judge scoring is a hard requirement
- Read our Best Open Source LLM Observability Tools guide for how OpenObserve compares to Langfuse, Arize Phoenix, and other self-hosted options in depth
- See OpenTelemetry for LLMs for the GenAI semantic conventions OpenObserve ingests natively
2. Datadog LLM Observability
Datadog LLM Observability extends Datadog's APM platform to trace LLM chains, evaluate output quality, and flag issues like toxicity, PII exposure, and failure-to-answer, with tight integration into existing Datadog infrastructure and application traces. For a detailed pricing breakdown, see our Datadog pricing guide.
Datadog LLM Observability Pros:
- Deep Platform Integration: LLM traces connect directly to existing APM traces, infrastructure metrics, and logs already in Datadog
- Built-In Quality Evaluations: Automatic flagging of toxicity, PII leakage, and failure-to-answer patterns without custom eval setup
- Broad Framework Support: Integrations for LangChain, OpenAI, Bedrock, and other common LLM stacks
- Unified Alerting: LLM-specific alerts use the same alerting infrastructure as the rest of Datadog
Datadog LLM Observability Cons:
- Stacks on Existing Datadog Spend: LLM Observability is one more line item on top of infrastructure, APM, and log costs that are already among the highest in the category
- SaaS Only: No self-hosted deployment option for teams with strict data residency requirements around sensitive prompts
- Proprietary Trace Format: Less portable than OpenTelemetry GenAI-native tools if you later change backends
Integration / Mitigation:
- A strong fit for teams already deep in the Datadog ecosystem who want LLM traces next to existing APM data
- Track LLM Observability as a distinct line item using Datadog's cost monitoring tools
- Consider OpenObserve where LLM traces need to live alongside cost-effective long-term log and trace retention rather than Datadog's per-GB pricing
3. Arize AI
Arize AI (Arize AX) is an enterprise AI observability platform that grew out of traditional ML monitoring, extended into LLM and GenAI observability with strong drift detection, embedding analysis, and root-cause workflows built for large-scale production ML and AI teams. Arize also maintains Phoenix, a separate open source project covered in our open source LLM observability guide.
Arize AI Pros:
- Enterprise ML + LLM Observability: Covers both traditional ML model monitoring and modern LLM/GenAI observability in one platform
- Deep Drift and Embedding Analysis: Best-in-class visualizations for distribution shift and embedding space drift over time
- RAG Pipeline Debugging: Inspect retrieval quality, chunk relevance, and grounding in detail
- Enterprise-Grade Root Cause Workflows: Built for large ML platform teams managing many models in production
Arize AI Cons:
- Sales-Led Enterprise Pricing: Custom contracts rather than transparent self-serve pricing, geared toward large organizations
- Steeper Learning Curve: The breadth of ML + LLM monitoring capability takes longer to onboard than narrower tools
- Overlap with Open Source Phoenix: Teams need to evaluate whether the commercial AX platform's extra capability justifies the cost over the free Phoenix version
Integration / Mitigation:
- Best suited for large ML platform teams that need both traditional model monitoring and LLM observability in one vendor
- Start with the free, open source Phoenix version to validate fit before committing to an AX enterprise contract
- Consider OpenObserve for teams that want LLM and infrastructure observability unified without a sales-led enterprise procurement cycle
4. LangSmith
LangSmith is LangChain's official observability and evaluation platform, built by the same team that maintains LangChain and LangGraph, with the deepest native tracing for applications built on those frameworks specifically.
LangSmith Pros:
- Deepest LangChain/LangGraph Integration: Built by the framework's own maintainers, tracks internals other tools can only approximate
- Prompt Hub and Playground: Iterate on prompts and test changes directly against real trace data
- Dataset and Evaluator Tooling: Build evaluation datasets from production traces and run them against new prompt versions
- Strong Debugging UX: Waterfall trace views purpose-built for LangChain's chain and agent execution model
LangSmith Cons:
- Framework-Coupled: Value drops for teams not using LangChain or LangGraph as their primary framework
- No Infrastructure Monitoring: Needs a separate platform for logs, metrics, and infrastructure traces
- Cost at Scale: Usage-based pricing on trace volume can grow significantly for high-throughput applications
Integration / Mitigation:
- The natural choice for teams standardized on LangChain or LangGraph who want the most framework-native tracing available
- Pair with OpenObserve for infrastructure telemetry that LangSmith doesn't cover
- See Langfuse vs. LangSmith for a detailed head-to-head against the leading open source alternative
5. Honeycomb
Honeycomb is a general-purpose observability platform built around high-cardinality event data and its BubbleUp anomaly-isolation workflow, extended with support for OpenTelemetry's GenAI semantic conventions to trace LLM calls alongside regular application traces.
Honeycomb Pros:
- High-Cardinality Native: Built from the ground up for exactly the kind of high-cardinality data LLM traces (per-user, per-session, per-prompt) generate
- BubbleUp Analysis: Distinctive workflow for isolating which trace attributes correlate with an anomaly, useful for finding what's driving a quality or cost regression
- OpenTelemetry-Native: Ingests standard OTel GenAI semantic convention traces with no proprietary SDK required
- Single Platform for App + LLM Traces: LLM calls appear as spans within the same traces as the rest of your application, not a separate view
Honeycomb Cons:
- Not LLM-Specific: No built-in prompt management, LLM-as-judge evaluation, or hallucination detection; it's a general tracing platform LLM data happens to fit well
- Query Language Learning Curve: Honeycomb's query builder is powerful but distinct from SQL, adding ramp-up time
- SaaS Primarily: Limited self-hosted options compared to fully open source alternatives
Integration / Mitigation:
- A strong fit for teams that already use Honeycomb for application tracing and want LLM calls to appear in the same traces rather than a separate tool
- Pair with a dedicated evaluation tool (Langfuse, Comet Opik) for LLM-as-judge scoring Honeycomb doesn't provide natively
- Consider OpenObserve for SQL-based querying and self-hosted deployment alongside similarly strong OTel-native LLM trace ingestion
6. New Relic AI Monitoring
New Relic AI Monitoring extends the New Relic One platform to LLM applications, correlating model calls with existing APM traces and infrastructure data, with a generous free tier that makes it accessible for teams evaluating LLM observability for the first time.
New Relic AI Monitoring Pros:
- Generous Free Tier: 100GB/month of free data ingest across the platform covers many small and medium teams, LLM traces included
- NRQL Correlation: Query LLM traces alongside APM, infrastructure, and log data using New Relic's query language
- Unified Platform: LLM monitoring, APM, logs, and infrastructure in one product with one billing relationship
- Established Enterprise Support: Mature platform with broad enterprise adoption and support infrastructure
New Relic AI Monitoring Cons:
- Cost Beyond Free Tier: Pricing scales with data volume once you exceed the free allowance
- NRQL Learning Curve: Teams unfamiliar with New Relic's query syntax need ramp-up time
- LLM Features Less Specialized: Evaluation and prompt management capabilities are less mature than dedicated LLM-first platforms
- SaaS Only: No on-premises deployment option
Integration / Mitigation:
- Use the free tier to validate LLM observability value before committing to paid volume
- Apply trace sampling deliberately as usage grows to stay within budget
- Consider OpenObserve for self-hosted or cost-sensitive production deployments once you outgrow the free tier
7. Dynatrace
Dynatrace extends its Davis AI causal-AI engine into AI Observability for LLM-powered applications, aiming to automatically correlate a quality or cost regression with the underlying infrastructure or code-level cause, as part of its broader full-stack platform.
Dynatrace Pros:
- AI-Assisted Root Cause: Davis AI attempts automated correlation between LLM issues and underlying infrastructure or deployment changes
- Full-Stack Integration: LLM traces connect to Dynatrace's existing APM, infrastructure, and log data
- Enterprise-Grade Reliability: Mature platform with strong SLA and compliance credentials for regulated industries
- Broad Automatic Instrumentation: OneAgent-based deployment reduces manual instrumentation work
Dynatrace Cons:
- Pricing Complexity: Dynatrace's consumption-based, host-unit pricing model is notoriously difficult to predict and often expensive at scale
- Heavy Agent-Based Deployment: Full platform value requires broad OneAgent deployment, a larger commitment than a lightweight LLM tracing SDK
- Steep Learning Curve: The breadth of the platform means significant onboarding time before teams are self-sufficient
- Vendor Lock-In: Proprietary data model makes migrating away a substantial project
Integration / Mitigation:
- A strong fit for large enterprises already standardized on Dynatrace for full-stack APM who are extending into LLM applications
- Scope which teams actually need Davis AI's automated correlation versus a simpler, lighter-weight LLM tracing tool
- Consider OpenObserve for a usage-based alternative that still unifies LLM traces with infrastructure telemetry
8. Braintrust
Braintrust is a developer-first LLM evaluation and observability platform focused on tight eval loops: logging production traces, building evaluation datasets from them, and iterating on prompts in a playground, aimed at fast-moving AI product teams.
Braintrust Pros:
- Tight Eval-to-Production Loop: Purpose-built workflow for turning production traces into evaluation datasets and back into prompt improvements
- Developer-Friendly Playground: Fast iteration on prompts against real data without leaving the platform
- Flexible Scoring: Supports custom scoring functions alongside built-in LLM-as-judge evaluators
- Modern, Fast Interface: Built for engineers who live in the product daily, not just periodic review
Braintrust Cons:
- LLM-Only Focus: No infrastructure monitoring; needs a separate platform for logs, metrics, and infrastructure traces
- Smaller Ecosystem: Fewer framework integrations and less community content than longer-established platforms
- Usage-Based Cost Growth: Pricing scales with trace and eval volume as usage increases
Integration / Mitigation:
- A strong fit for AI product teams that iterate quickly on prompts and want evaluation tightly coupled to production data
- Pair with OpenObserve for infrastructure telemetry Braintrust doesn't cover
- Export traces via OpenTelemetry where supported to keep instrumentation portable
9. Galileo
Galileo is an enterprise GenAI observability and evaluation platform built around proprietary hallucination and quality metrics, aimed at regulated industries that need defensible, auditable evaluation of LLM outputs in production.
Galileo Pros:
- Purpose-Built Hallucination Detection: Proprietary metrics specifically designed to flag ungrounded or fabricated model outputs
- Enterprise Compliance Focus: Built with regulated industries (finance, healthcare, insurance) in mind, with audit-friendly evaluation trails
- RAG-Specific Evaluation: Strong tooling for scoring retrieval quality and grounding in RAG pipelines
- Guardrails: Real-time protections against common failure modes, not just after-the-fact evaluation
Galileo Cons:
- Enterprise Sales Cycle: Sold on custom contracts rather than transparent self-serve pricing
- Narrower Scope: Focused specifically on evaluation and guardrails rather than broad observability or infrastructure correlation
- Newer Platform: Smaller ecosystem and community track record than more established players
Integration / Mitigation:
- Best suited for regulated enterprises that need defensible, auditable hallucination and quality evaluation
- Pair with a broader observability platform for infrastructure and cost telemetry Galileo doesn't cover
- Consider OpenObserve alongside Galileo when unified infrastructure correlation matters as much as evaluation depth
10. Fiddler AI
Fiddler AI is an enterprise AI observability platform that began in traditional ML monitoring (bias and drift detection) and has extended into LLM and GenAI observability, with an explainability focus that's particularly relevant in regulated industries.
Fiddler AI Pros:
- Explainability Heritage: Strong roots in model explainability translate into detailed insight into why an LLM produced a given output
- Bias and Fairness Monitoring: Mature tooling for detecting bias, carried over from its traditional ML monitoring product
- Enterprise Governance Focus: Built for organizations that need to demonstrate responsible AI practices to auditors or regulators
- Unified ML + LLM Platform: Covers both traditional ML models and newer LLM applications in one product
Fiddler AI Cons:
- Enterprise Pricing: Custom, sales-led contracts rather than self-serve pricing
- Less Developer-Focused: Interface and workflow lean toward governance and compliance teams over fast-moving engineering iteration
- No Infrastructure Monitoring: Requires a separate platform for logs, metrics, and infrastructure traces
Integration / Mitigation:
- A strong fit for regulated enterprises that need explainability and bias monitoring across both traditional ML and LLM applications
- Pair with a broader observability platform for infrastructure telemetry
- Consider OpenObserve where LLM traces need to correlate with application and infrastructure telemetry rather than sitting in a governance-focused silo
LLM Observability Tools Comparison Table
| Tool | Deployment | Infra Observability | OpenTelemetry Native | Evaluation | Pricing Model |
| OpenObserve | Self-hosted / Managed | Yes (native, unified) | Yes | Via integrations | Usage-based platform pricing |
| Datadog | SaaS only | Yes (Datadog platform) | Partial | Yes (built-in) | Bundled per-product billing |
| Arize AI | SaaS / Managed | No | Partial (via Phoenix) | Yes (strong) | Custom enterprise contract |
| LangSmith | SaaS only | No | Partial | Yes | Usage-based, free tier |
| Honeycomb | SaaS primarily | Yes (general tracing) | Yes | No (pair with dedicated tool) | Usage-based |
| New Relic | SaaS only | Yes (New Relic One) | Partial | Limited | Free tier, then usage-based |
| Dynatrace | SaaS / Managed | Yes (Dynatrace platform) | Partial | Limited | Consumption-based, host units |
| Braintrust | SaaS only | No | Partial | Yes (strong) | Usage-based, free tier |
| Galileo | SaaS only | No | Limited | Yes (strong, proprietary) | Custom enterprise contract |
| Fiddler AI | SaaS / Managed | No | Limited | Yes (explainability-focused) | Custom enterprise contract |
Best Practices for LLM Observability
Instrument with OpenTelemetry's GenAI conventions where possible: Standardized attributes keep your instrumentation portable across backends instead of locked to one vendor's SDK. See OpenTelemetry for LLMs for the specific conventions to adopt.
Track cost per session, not just in aggregate: An aggregate token spend number hides which specific user, prompt, or agent loop is actually driving cost. Per-session breakdowns catch runaway spend before the monthly bill does.
Never treat evaluation as optional: A 200 response tells you nothing about output quality. Pair tracing with either automated LLM-as-judge scoring or human review on a representative sample.
Redact sensitive data at the pipeline level, not manually: LLM traces routinely contain full user prompts and outputs. Apply redaction in your ingestion pipeline rather than relying on engineers to remember. See Redacting PII from LLM Telemetry for implementation patterns.
Correlate LLM traces with infrastructure state: A quality regression that coincides with a model version change, a deploy, or an infrastructure incident is far easier to diagnose when both signals live in the same query layer.
Set alerts on cost and quality, not just errors: A silent 20% jump in average tokens per request or a drop in an eval score deserves the same alerting rigor as an error-rate spike.
Plan for multi-step agent tracing from day one: Retrofitting tracing into a chain of tool calls after the fact is far more painful than instrumenting each step as you build it.
Conclusion
The best LLM observability tool for your team depends on whether you need infrastructure correlation, how deep your evaluation requirements are, and whether self-hosting or vendor lock-in are hard constraints.
For most engineering teams in 2026, OpenObserve is the strongest all-around choice: native OpenTelemetry LLM tracing, per-model and per-session cost tracking, and unified correlation with logs, metrics, infrastructure traces, and RUM, all in a platform you can self-host or run managed. No second tool, no manual timestamp-matching when a cost spike or quality regression hits.
Key recommendations by use case:
- Unified LLM + infrastructure observability: OpenObserve keeps LLM traces, logs, metrics, and infra traces in one queryable platform
- Deep LangChain/LangGraph tracing: LangSmith for the most framework-native integration available
- Enterprise ML + LLM drift and embedding analysis: Arize AI for teams already managing traditional ML models alongside LLMs
- Regulated industries needing auditable evaluation: Galileo or Fiddler AI for compliance-focused hallucination and bias monitoring
- Already deep in Datadog, New Relic, or Dynatrace: Their native LLM Observability add-ons, watch the cost as it stacks on existing platform spend
- Self-hosting or license terms are a hard requirement: See Best Open Source LLM Observability Tools for OpenObserve, Langfuse, and other self-hostable options in depth
Take the Next Step
- Try OpenObserve: Start with the open source version or sign up for OpenObserve Cloud
- Read OpenTelemetry for LLMs to instrument your application with portable, standard tracing
- See LLM Evals vs. Observability for how tracing and evaluation fit together
- Review LLM Monitoring Best Practices for a production-readiness checklist
- Explore LLM Cost Monitoring to set up per-model, per-session spend tracking
Frequently Asked Questions
About the Author
Simran Kumari

Passionate about observability, AI systems, and cloud-native tools. All in on DevOps and improving the developer experience.
Follow OpenObserve on Google
Add OpenObserve as a preferred source to see more of our articles in Google Search and Top Stories.












