What Is Observability? The Complete 2026 Guide




Ready to get started?
Try OpenObserve Cloud today for more efficient and performant observability.
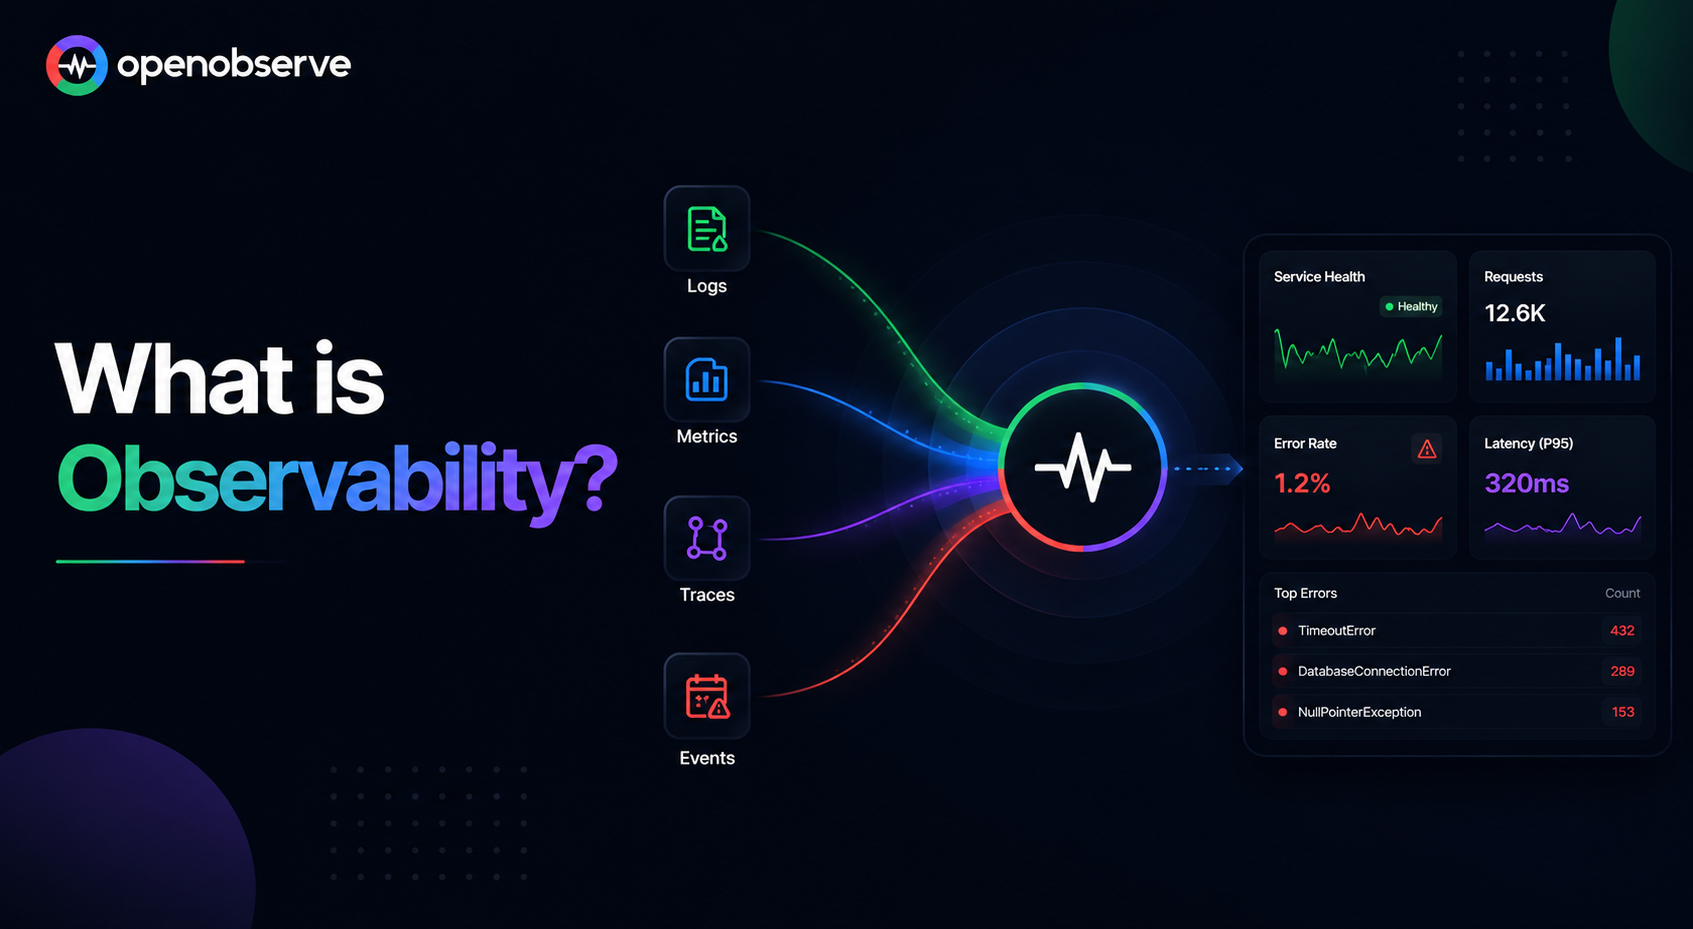
A dashboard turns red. Every metric on it was one your team thought to graph in advance, and none of them explain why checkout is failing for exactly one customer segment on one payment provider. That gap, between the questions you predicted and the question you actually need answered right now, is what observability exists to close.
This guide answers "what is observability" properly: a real definition, how it differs from monitoring, the three pillars everyone mentions but rarely explains well, the properties that actually make a system observable rather than just monitored, and a practical path to getting there.
TL;DR
Observability is the ability to understand what's happening inside a system from the data it produces externally, its logs, metrics, and traces, without shipping new code to answer a new question. It's different from monitoring, which watches for failure modes you predicted in advance; observability is built for the ones you didn't.
- Definition: infer internal system state from external outputs (logs, metrics, traces), a term borrowed from control theory.
- The three pillars: logs (discrete events), metrics (aggregated numbers over time), traces (a request's path across services).
- vs. monitoring: monitoring answers questions decided in advance; observability lets you ask a question you didn't anticipate, live, on real data.
- What makes a system observable: high cardinality, high dimensionality, and explorability, not just "we have dashboards."
- How most teams get there in 2026: instrument once with OpenTelemetry, correlate all three signals in one platform, query with SQL instead of learning three separate tools.
What Is Observability?
Observability is a property borrowed from control theory: a system is observable if you can determine its internal state purely from its external outputs. Applied to software, that means: given the logs, metrics, and traces a system emits, can you figure out what's actually happening inside it, including failure modes nobody explicitly planned a dashboard for?
That last clause is the entire point. Every production system already has some telemetry. The question observability answers is whether that telemetry is rich enough to let you investigate a problem you've never seen before, live, without a code deploy to add the logging statement you now realize you needed.
Practically, in 2026, observability means:
- Collecting high-cardinality, high-dimensionality telemetry (not just a handful of pre-aggregated metrics)
- Being able to query it ad hoc, asking a new question on the fly instead of only reading pre-built dashboards
- Correlating logs, metrics, and traces so you can pivot from a symptom (a latency spike) to a cause (a specific slow database call in a specific trace)
Why Observability Matters
1. Modern systems fail in combinatorially many ways. A monolith has a handful of failure modes. A system with fifty microservices, three databases, a message queue, and a couple of third-party APIs has failure modes nobody enumerated in advance, because the combination that caused today's incident didn't exist until today's deploy, today's traffic pattern, and today's partial outage at a dependency all lined up together.
2. You can't dashboard your way out of an unknown unknown. Dashboards are built for questions you already know to ask. The incidents that actually hurt are the ones where the first useful question only occurs to you after you're already investigating, at which point you need to explore the data, not just look at the panel you built three months ago.
3. Mean time to resolution depends on it directly. The gap between "something is wrong" (which any decent alerting catches) and "here is exactly why" is where most incident time gets spent. Observability is specifically the tooling and data shape that closes that second gap.
4. Distributed systems make manual correlation impractical. When a single user request touches ten services, manually cross-referencing ten separate log files by timestamp doesn't scale past the second or third incident. You need the telemetry itself to carry the connective tissue, which is exactly what traces and correlated IDs provide.
The Three Pillars of Observability
Almost every definition of observability leads with these three signal types. They're not observability by themselves, having all three doesn't automatically make a system observable, but they're the raw material it's built from.
| Pillar | What It Is | Best For |
| Logs | Discrete, timestamped records of individual events, structured or unstructured | Detailed context on one specific occurrence: what exactly happened, what the error message said, what the request body contained |
| Metrics | Numeric measurements aggregated over time (counters, gauges, histograms) | Trends, thresholds, and alerting: is error rate climbing, is p99 latency degrading, is queue depth growing |
| Traces | The path of a single request across every service, function, and network hop it touches | Pinpointing where time was spent or where a failure originated in a distributed call chain |
None of these is sufficient alone. Metrics tell you that p99 latency spiked at 14:32; they can't tell you which specific request was slow or why. Traces show you exactly which span in which service was slow for one specific request; they don't summarize a trend across a million requests. Logs give you the specific error text; they don't show you the shape of a system-wide pattern. The real value shows up when all three are correlated, typically via a shared trace_id, so you can start at a metric anomaly, jump to the traces active during that window, and land on the exact log lines that explain what happened. See Observability: Logs, Metrics, and Traces Explained for a deeper walkthrough of each pillar, and Logs, Traces, and Metrics Correlation for how that correlation workflow actually plays out during an incident.
Observability vs. Monitoring: What's the Difference?
These get used interchangeably in casual conversation, but they answer different questions:
| Monitoring | Observability | |
| Answers | Questions decided in advance | Questions you think of during the incident |
| Built from | Predefined dashboards and threshold alerts | High-cardinality, explorable telemetry |
| Good at | Known failure modes: is the service up, is CPU high, is disk full | Unknown failure modes: why is this specific customer's request failing and no one else's |
| Typical output | A red panel, an alert firing | An ad-hoc query that slices data nobody pre-aggregated |
The practical relationship: monitoring tells you something is wrong; observability helps you find out why. You still need monitoring, alerting on a known bad state is faster and cheaper than exploring your way to the same conclusion every time. But monitoring alone leaves you stuck the moment the failure doesn't match a threshold you thought to set. For the full comparison, including a walkthrough of what each looks like during a real incident, see Observability vs. Monitoring.
The Core Properties of an Observable System
Having logs, metrics, and traces doesn't automatically make a system observable. Three specific properties, a framing that traces back to early observability advocacy from teams like Honeycomb, determine whether your telemetry actually supports the kind of investigation observability promises:
High cardinality: fields with many possible unique values, a specific
user_id, a specificrequest_id, a specificorder_id, not just a handful of fixed categories likeregion: us-eastorstatus: error. High-cardinality fields are exactly what let you isolate "this one customer, this one request" instead of only seeing aggregate trends.High dimensionality: many different fields attached to each event (deployment version, feature flag state, customer tier, database shard, and dozens more), so you can slice and filter by any combination of them without having pre-built that specific breakdown ahead of time.
Explorability: the ability to ask a genuinely new, ad-hoc question, "show me every request from enterprise customers on the new pricing flag that hit the EU database shard," and get an answer immediately, without writing new instrumentation or waiting for a new dashboard to be built.
A system with only a handful of low-cardinality, pre-aggregated metrics and no way to drill into individual raw events is monitorable. It is not, by this definition, observable, no matter how many dashboards it has. This is also the practical reason SQL-based querying over raw, high-cardinality event data has become the dominant interface for observability platforms: it's the most direct way to satisfy explorability without learning a new, narrower query language per signal type.
How Observability Works in Practice
A concrete walkthrough makes this less abstract. Say checkout latency spikes at 2 p.m.:
- An alert fires on a metric: p95 checkout latency crossed its SLO threshold. This is monitoring doing its job, telling you something is wrong.
- You pivot to traces active during that window, filtered to the checkout service, and see that a specific downstream call, inventory lookup, accounts for most of the added latency in the slow traces.
- You narrow further: is this every inventory lookup, or a specific subset? High-cardinality trace attributes let you filter to, say, one specific warehouse region, and you see it's isolated there.
- You pivot to logs from the inventory service, filtered to that region and that time window, using the
trace_idfrom a slow trace to find the exact request, and find a connection pool exhaustion error that never crossed a threshold anyone had alerted on. - You now know the specific, previously unknown cause: a config change three hours earlier reduced connection pool size for one region's database replica, and the resulting queuing wasn't severe enough to trip a generic latency alert until checkout traffic ramped up.
Nobody built a dashboard in advance for "connection pool exhaustion in one specific regional replica during peak checkout traffic." Observability is what made that investigation possible anyway, by making the underlying telemetry explorable instead of only summarized.
Observability Maturity: From Dashboards to Full Observability
Most teams don't jump straight to full observability; it's a progression:
- Reactive monitoring: dashboards and threshold alerts built after incidents teach you what to watch for. Effective for known failure modes, blind to new ones.
- Instrumented but siloed: logs, metrics, and traces exist, often in three separate tools with three separate query languages, but correlating them during an incident means manually matching timestamps across browser tabs.
- Correlated telemetry: logs, metrics, and traces share identifiers (
trace_id,span_id) and live in a platform that lets you pivot between them directly, cutting investigation time significantly. - Proactive and AI-assisted: anomaly detection, automatic pattern extraction, and AI-assisted root cause analysis surface likely explanations before or as an engineer starts investigating, on top of a foundation of correlated, high-cardinality telemetry, not instead of it.
Skipping straight to stage 4 tooling without stage 3's underlying correlation doesn't work; AI-assisted analysis is only as good as the telemetry it has to reason over.
Key Signals Beyond the Three Pillars
The three pillars cover backend systems, but a full observability practice in 2026 typically extends to a few more signal types:
- Real User Monitoring (RUM): what actual users experience in their real browsers, on their real devices and networks, complementing backend telemetry with the frontend half of the picture.
- Synthetic monitoring: scheduled, scripted checks that catch failures even when no real user is present to trigger a RUM event, proactive rather than reactive. See Synthetic Monitoring vs. RUM for how these two relate.
- Continuous profiling: code-level CPU and memory profiles collected continuously in production, useful for the class of performance problem that traces alone don't fully explain, like exactly which function is burning CPU.
- Events: structured, discrete occurrences (a deployment, a feature flag toggle, a config change) that provide crucial context for correlating "what changed right before this started."
Observability Tools and Platforms: What to Look For
| Feature | Why It Matters |
| Unified logs, metrics, and traces | Correlation is the whole point; three separate tools with three separate query languages recreates the manual-timestamp-matching problem observability is supposed to solve |
| High-cardinality support | A backend that can't efficiently index or query high-cardinality fields (user IDs, request IDs) can't support real explorability, no matter how good its dashboards look |
| OpenTelemetry-native ingestion | Instrument once, avoid re-instrumenting if you ever change backends; see [What Is OpenTelemetry?](https://openobserve.ai/blog/what-is-opentelemetry/) for the standard most platforms now build around |
| SQL or equally expressive querying | Explorability depends on being able to ask an arbitrary new question without learning a proprietary, narrow query language first |
| Cost-efficient storage at scale | High-cardinality telemetry is voluminous; a platform whose pricing punishes cardinality pushes teams back toward pre-aggregated, less-observable data out of budget necessity |
| Alerting on all signal types | Monitoring and observability coexist; you still want threshold alerts on metrics alongside the ability to explore logs and traces |
For a full comparison of platforms against this checklist, see Top Observability Tools & Platforms in 2026 and Top 10 Observability Platforms.
Common Observability Myths and Mistakes
- "We have Grafana, so we have observability." A dashboard tool visualizes whatever data you feed it; observability is a property of the underlying telemetry (cardinality, dimensionality, explorability), not the existence of a visualization layer on top of it.
- "More logs equals more observability." Volume without structure or correlation just makes the haystack bigger. Structured, high-cardinality, correlated data beats a larger pile of unstructured text every time.
- "Observability replaces monitoring." They're complementary. Threshold alerts on known bad states are still the fastest way to catch the failure modes you did predict; observability is for everything else.
- "You need three separate best-of-breed tools for logs, metrics, and traces." This was closer to true a decade ago. Correlation is the actual value driver, and three disconnected tools actively work against it, regardless of how good each one is individually.
- "Observability is only for large, complex distributed systems." The investigation workflow it enables, exploring instead of only dashboarding, pays off the first time any team hits an incident that doesn't match a pre-built panel, which happens well before a system reaches microservices-at-scale complexity.
Getting Started with Observability: A Practical Checklist
- Instrument with OpenTelemetry rather than a proprietary agent, so you're not locked to one backend before you've even evaluated it.
- Emit structured logs, not free-text strings, with a shared
trace_id/span_idon every log line so correlation is automatic rather than a manual join. - Pick a backend that supports high-cardinality querying, not just pre-aggregated dashboards, and test it by asking it a genuinely ad-hoc question, not just loading a demo dashboard.
- Keep logs, metrics, and traces in one queryable platform if at all possible, since the pivot between them during an incident is where most of the time savings live.
- Set threshold alerts for known failure modes, then treat everything else as a job for exploration, not a missing dashboard you need to pre-build for every conceivable scenario.
- Extend beyond the backend: add RUM and synthetic checks so you have both what real users experienced and proactive checks that catch failures before users do.
How OpenObserve Approaches Observability
OpenObserve ingests logs, metrics, traces, RUM, and synthetic check results natively over OTLP into one platform, queryable with standard SQL instead of a different language per signal. High-cardinality fields aren't a pricing penalty, columnar storage on object storage keeps retention affordable even as cardinality grows, so explorability doesn't get traded away for cost control. Every signal shares the same query layer, which means the pivot from a metric anomaly to the traces active during that window to the specific log lines that explain it happens inside one tool, not three.
Conclusion
Observability is the ability to understand what's happening inside your system from the outside, its logs, metrics, and traces, well enough to answer a question you never predicted you'd need to ask. It's not a tool you buy or a dashboard you build; it's a property of your telemetry, whether it's high-cardinality, high-dimensionality, and genuinely explorable, plus a platform that lets you correlate across signal types instead of manually stitching them together during an incident.
Start with OpenTelemetry instrumentation, keep your signals correlated rather than siloed, and treat monitoring and observability as complementary layers rather than competing philosophies. From here, go deeper on the three pillars, the monitoring comparison, or OpenTelemetry itself.
Frequently Asked Questions
About the Author
Simran Kumari

Passionate about observability, AI systems, and cloud-native tools. All in on DevOps and improving the developer experience.
Follow OpenObserve on Google
Add OpenObserve as a preferred source to see more of our articles in Google Search and Top Stories.












