Getting Started with OpenObserve
Explore latest insights and updates
Learn how to deploy OpenObserve on AWS ECS Fargate by building the ECS task definition step by step: compute, EFS, S3, IAM roles, Secrets Manager, a Cloudflare sidecar, and health checks.
How teams are replacing the Grafana LGTM stack (Loki, Grafana, Tempo, Mimir) with OpenObserve, a single unified platform for logs, metrics, and traces.
An observability customer story showcasing how Yupao Technology, operator of the Yupao Zhipin recruitment platform, migrated 69 TB of daily logs from Alibaba Cloud SLS to a self-hosted OpenObserve deployment, cutting logging costs by more than $60,000 a year while unifying log visibility across VPCs.
A comprehensive comparison of open source Kubernetes monitoring tools in 2026: OpenObserve, Prometheus + Grafana, VictoriaMetrics, Elastic Stack, Netdata, Loki, Zabbix, Checkmk, Robusta, and Pixie. Covers metrics, logs, and traces for self-hosted clusters.
A practical guide to on-premise Kubernetes monitoring: why self-hosted clusters need a different approach, the best practices to follow, and the top open source tools to run in 2026.
A comprehensive comparison of open source LLM observability tools in 2026: OpenObserve, Langfuse, Confident AI, and Arize Phoenix. Covers prompt tracing, cost tracking, online evaluations, and unified infrastructure monitoring.
A step-by-step guide to monitoring a CockroachDB cluster with OpenObserve: collect Prometheus metrics via remote write and import ready-made dashboards.
A working setup for uberAgent ingestion into OpenObserve. Covers the Nginx njs shim that makes uberAgent's Elasticsearch data-stream bulk format land correctly, the proxy config, verification, timestamp mapping, and troubleshooting.
A complete guide to monitoring VMware vSphere with the OpenTelemetry Collector Contrib distribution on Windows: vCenter setup, the full collector config, running it as a service, ESXi syslog, the metrics reference, validation, and the stream-name gotcha that leaves the Metrics explorer empty.
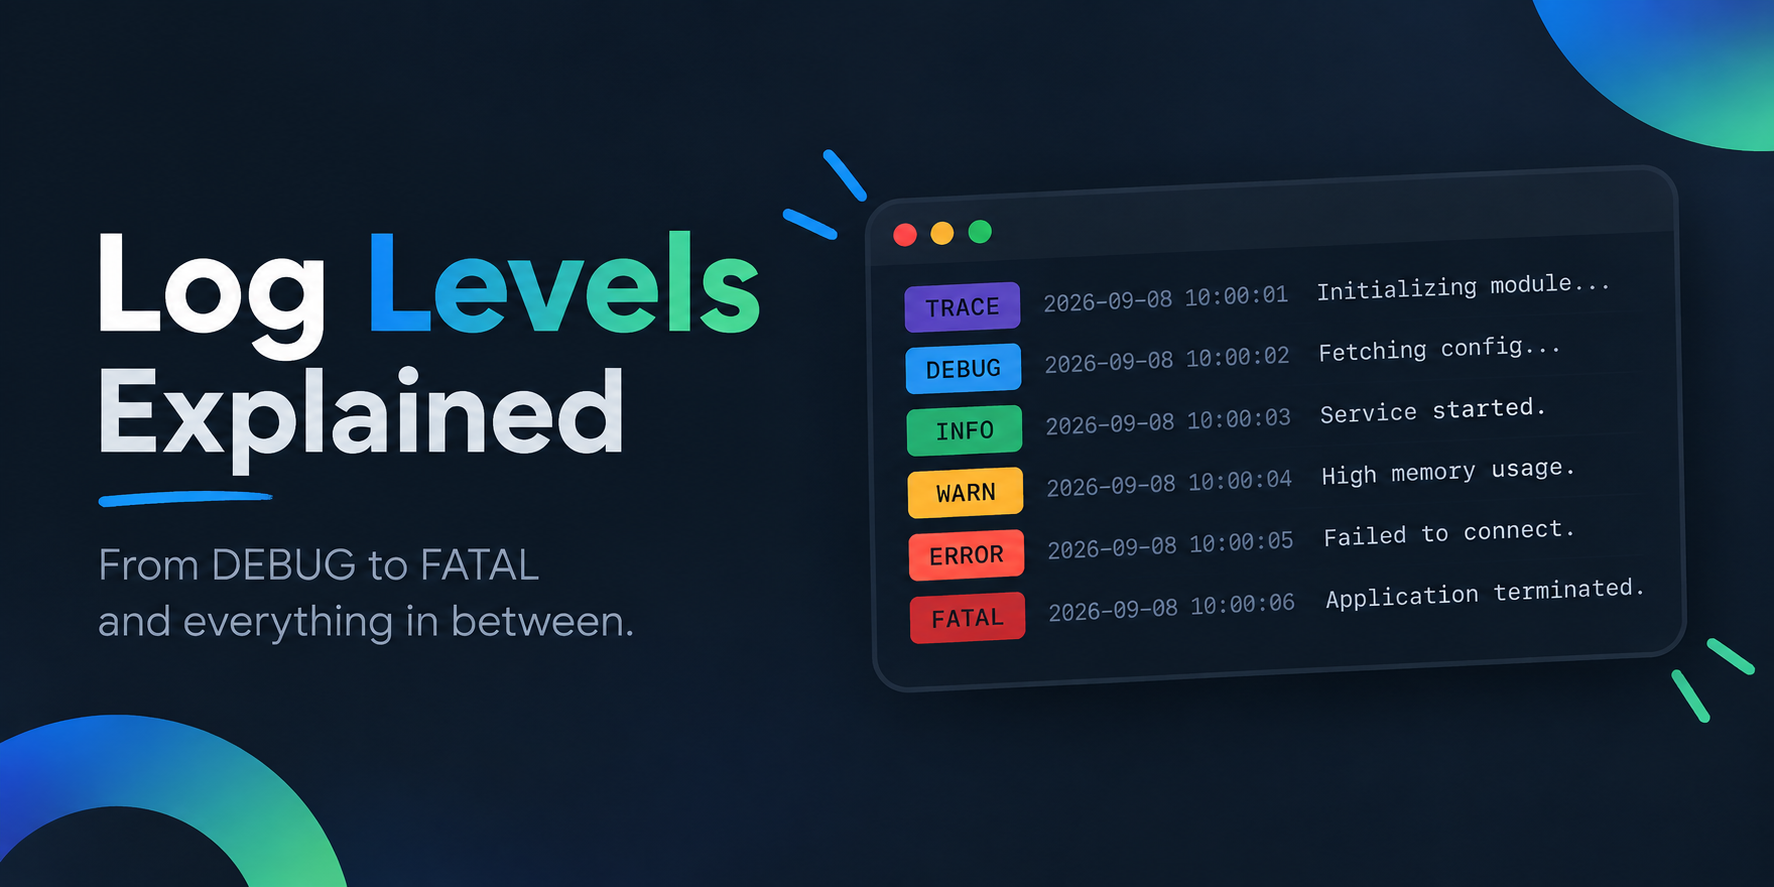
A complete guide to log levels: what DEBUG, INFO, WARN, ERROR, TRACE, and FATAL actually mean, how log level hierarchy and filtering work, and best practices for choosing the right level in every environment.
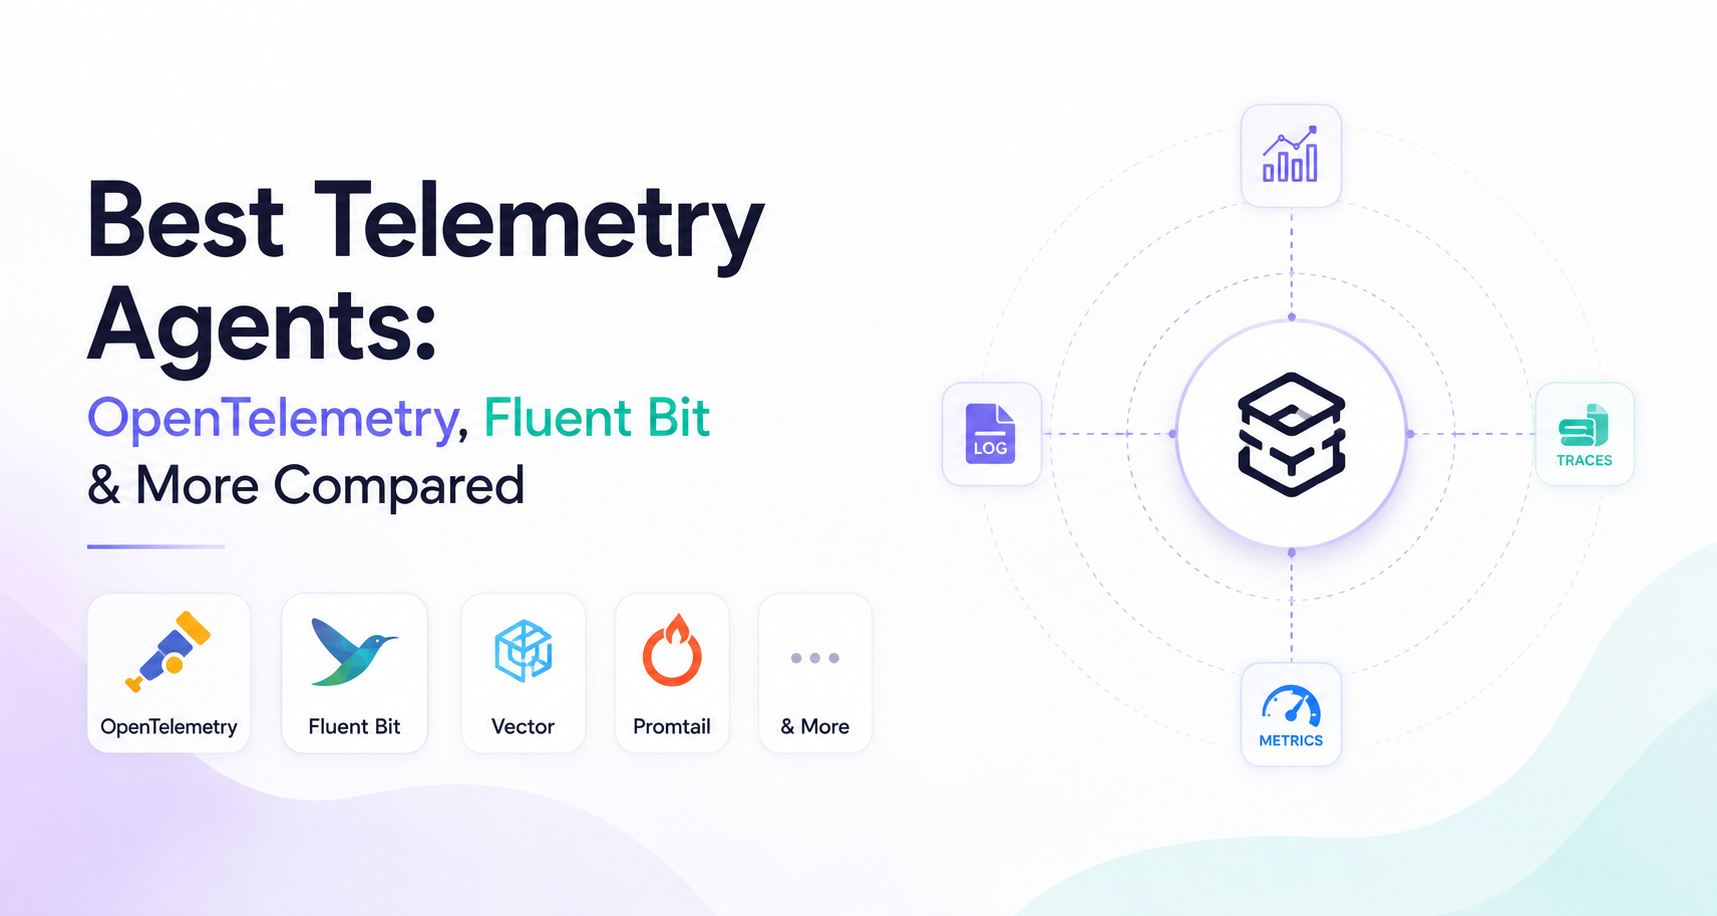
Compare the best telemetry collection agents in 2026 for logs, metrics, and traces on performance, footprint, and OTel compatibility.
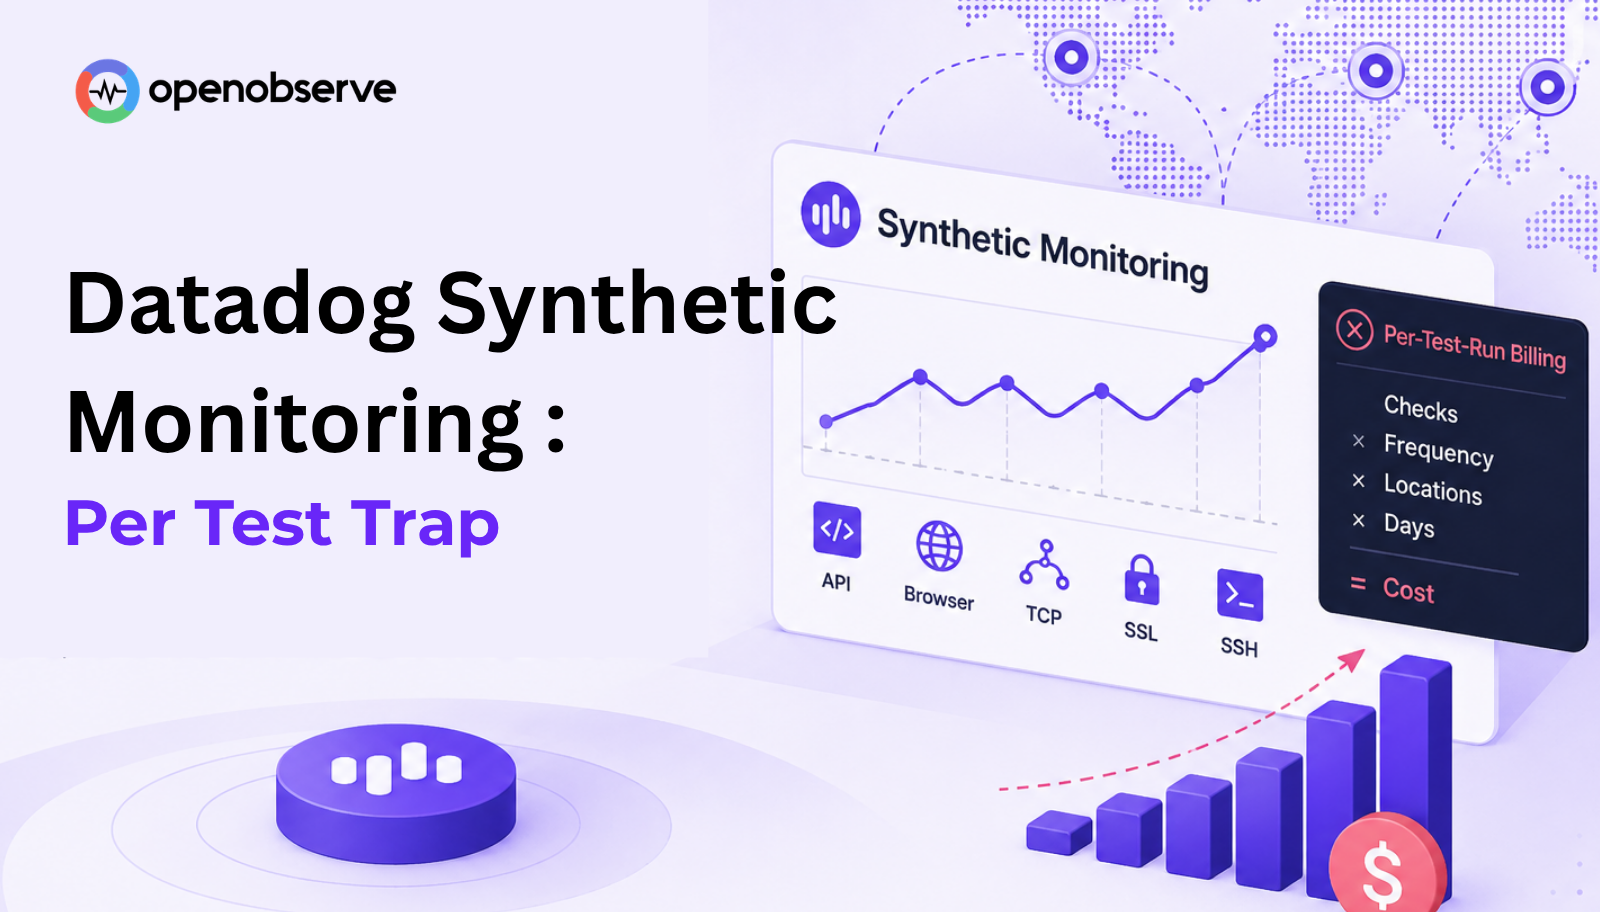
Datadog Synthetic Monitoring bills per API and browser test run. Here's what that actually costs once you factor in check frequency, multiple locations, and journey count, with worked math and what a flat, usage-based alternative looks like.
An observability customer story showcasing how Uno.ai, an AI-native agentic platform for GRC and enterprise risk, unified telemetry across GCP, AWS, and Azure while curbing rising cloud-native monitoring costs with OpenObserve.
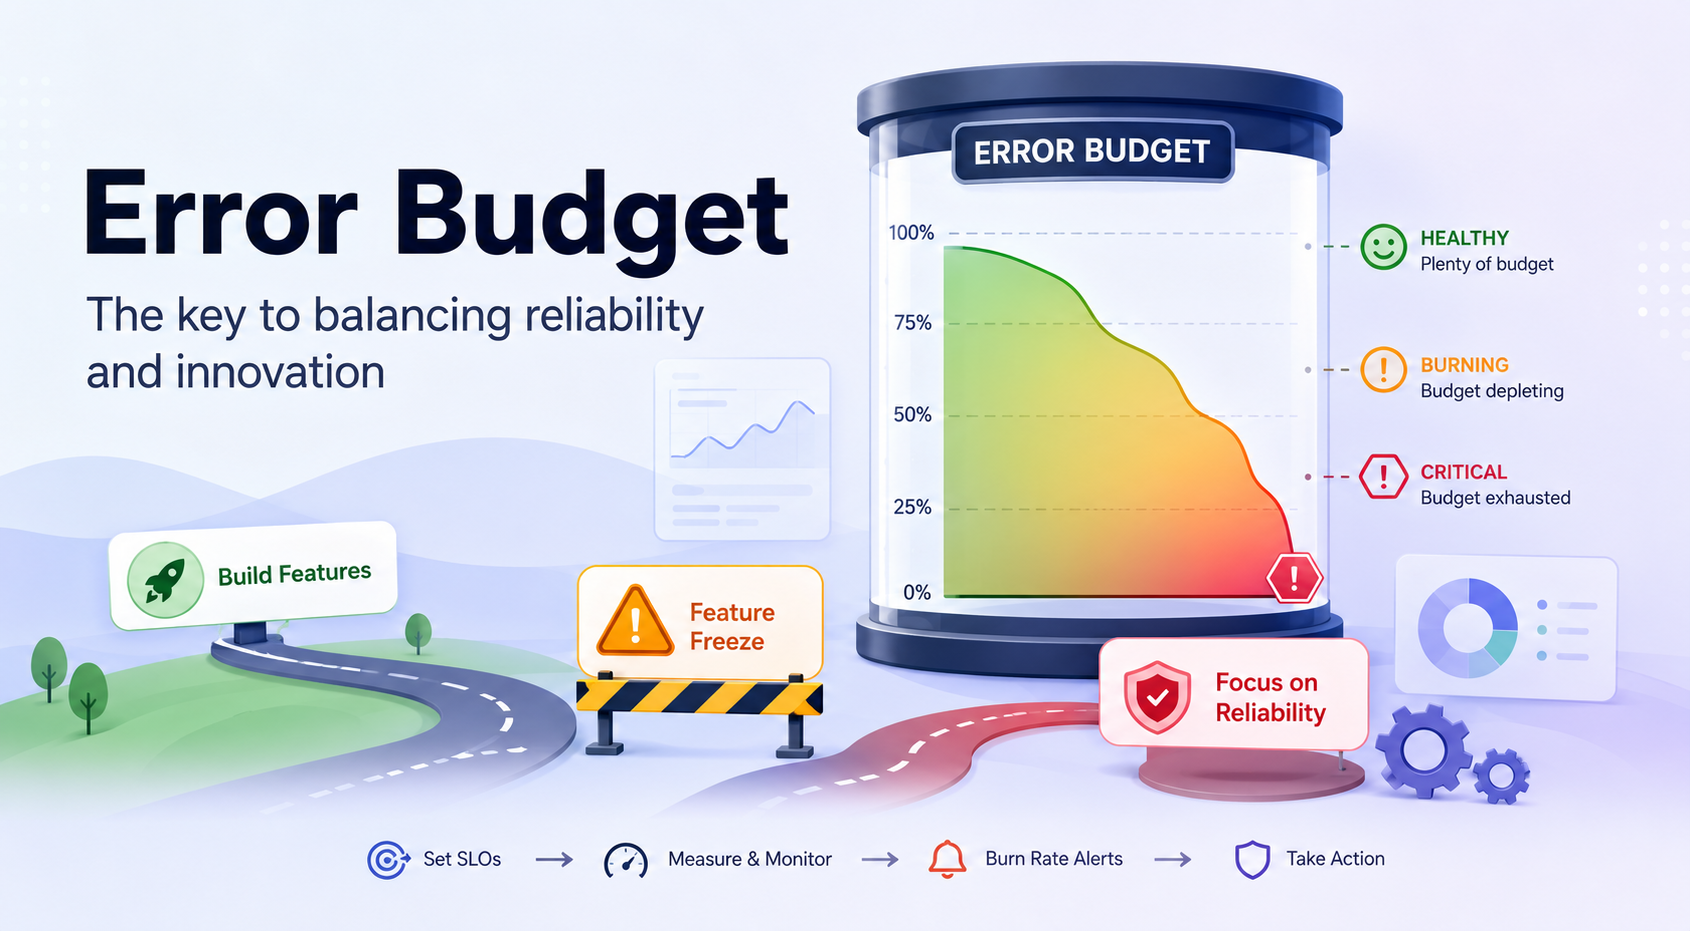
Error budgets explained: how they work, how to write an error budget policy, and what actually happens when the budget runs out.
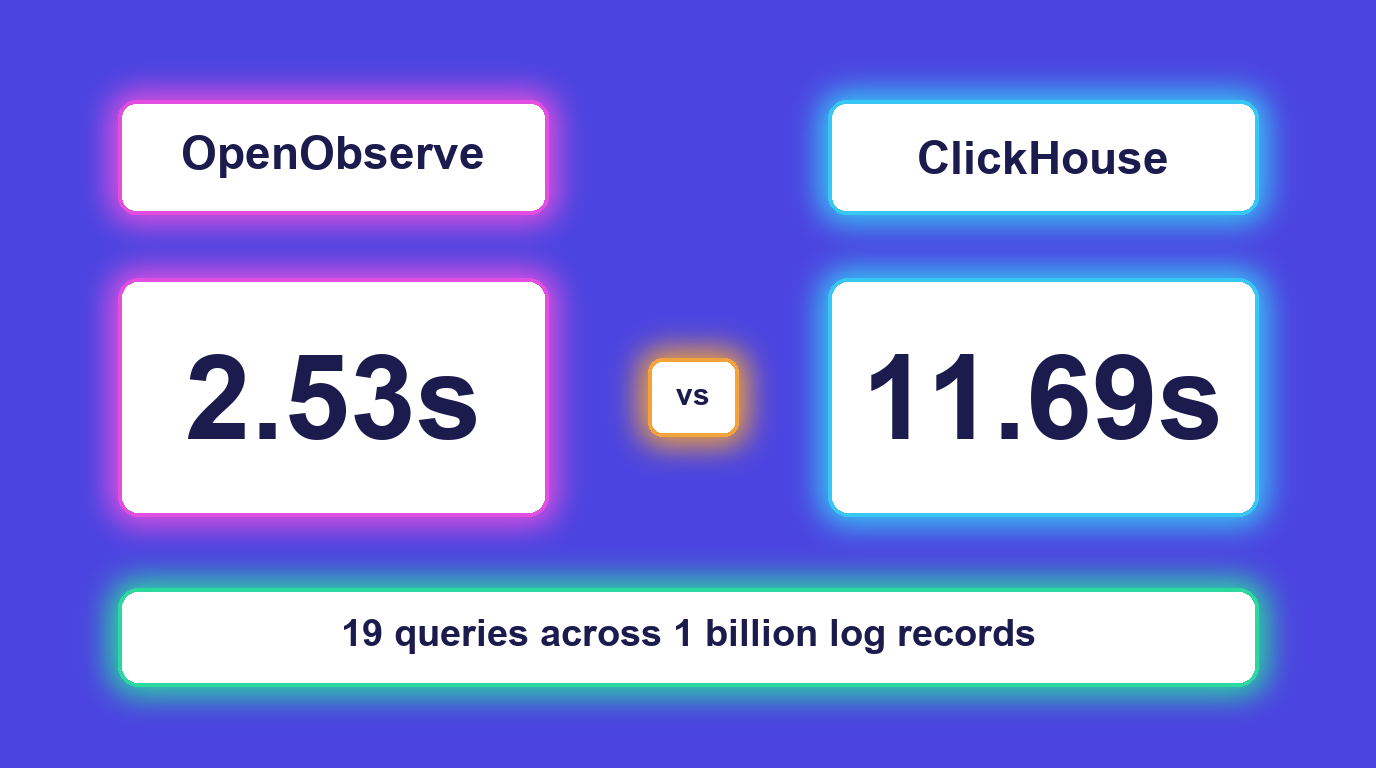
We generated one billion log records, 2 TiB of NDJSON, and wrote the identical bytes into ClickHouse and two OpenObserve instances at the same time, each on its own dedicated node. Across 19 queries with a full-text index on both sides, OpenObserve finished 3.4x to 4.6x faster on a third less disk. One compaction setting was worth more than the file format.
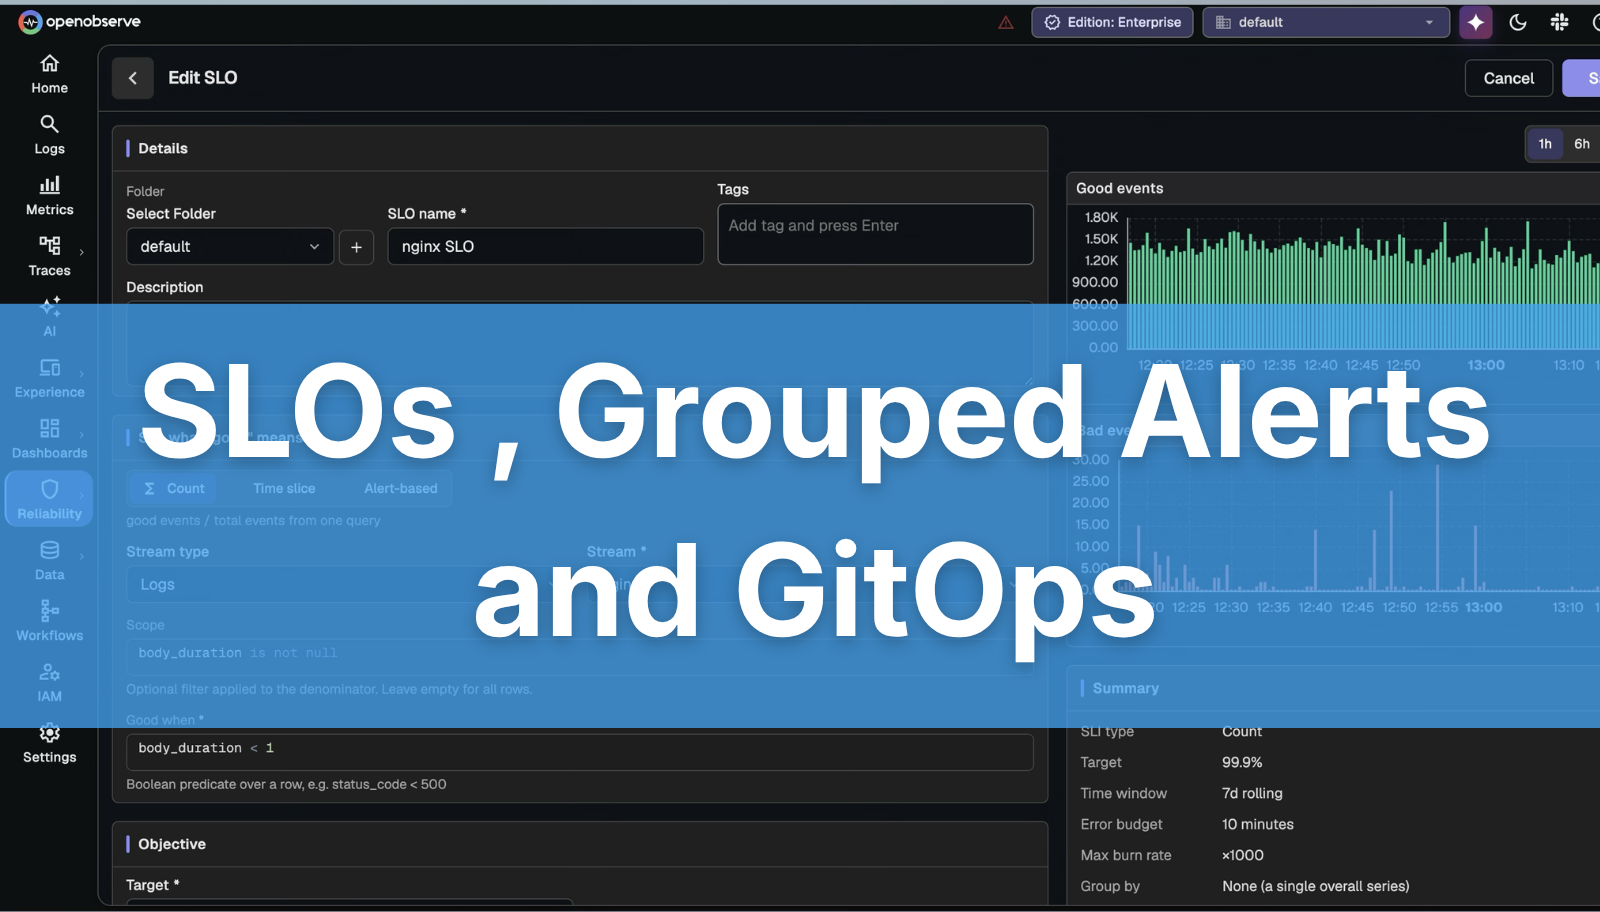
OpenObserve's reliability release: native SLOs with error budgets and multi-window burn-rate alerting, grouped alerts that track each host or metric series independently, and bidirectional Terraform and GitOps support for observability as code, managing alerts, dashboards, and SLOs as code.
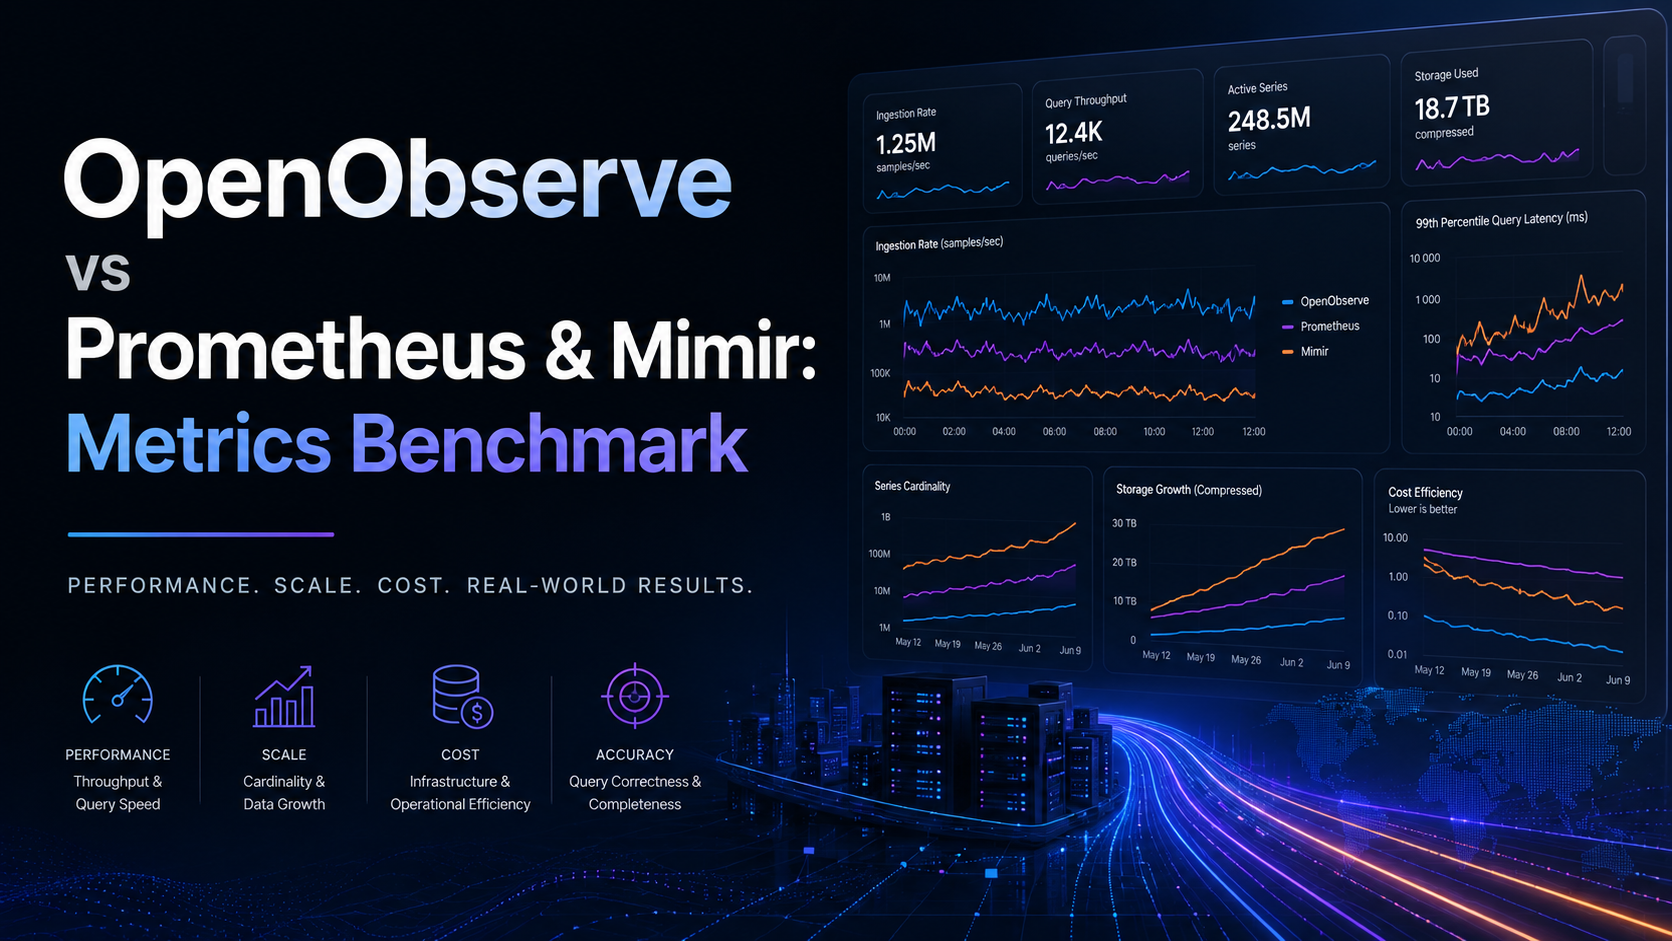
We pushed the same ~2.2 billion samples through one OTel Collector into Prometheus, Grafana Mimir, and OpenObserve (Parquet and Vortex) simultaneously, then ran identical PromQL over a frozen 1.09-million-series dataset. OpenObserve answered irate queries ~15x faster, the million-series histogram ~6x faster, and held ingestion to half of Prometheus's memory.
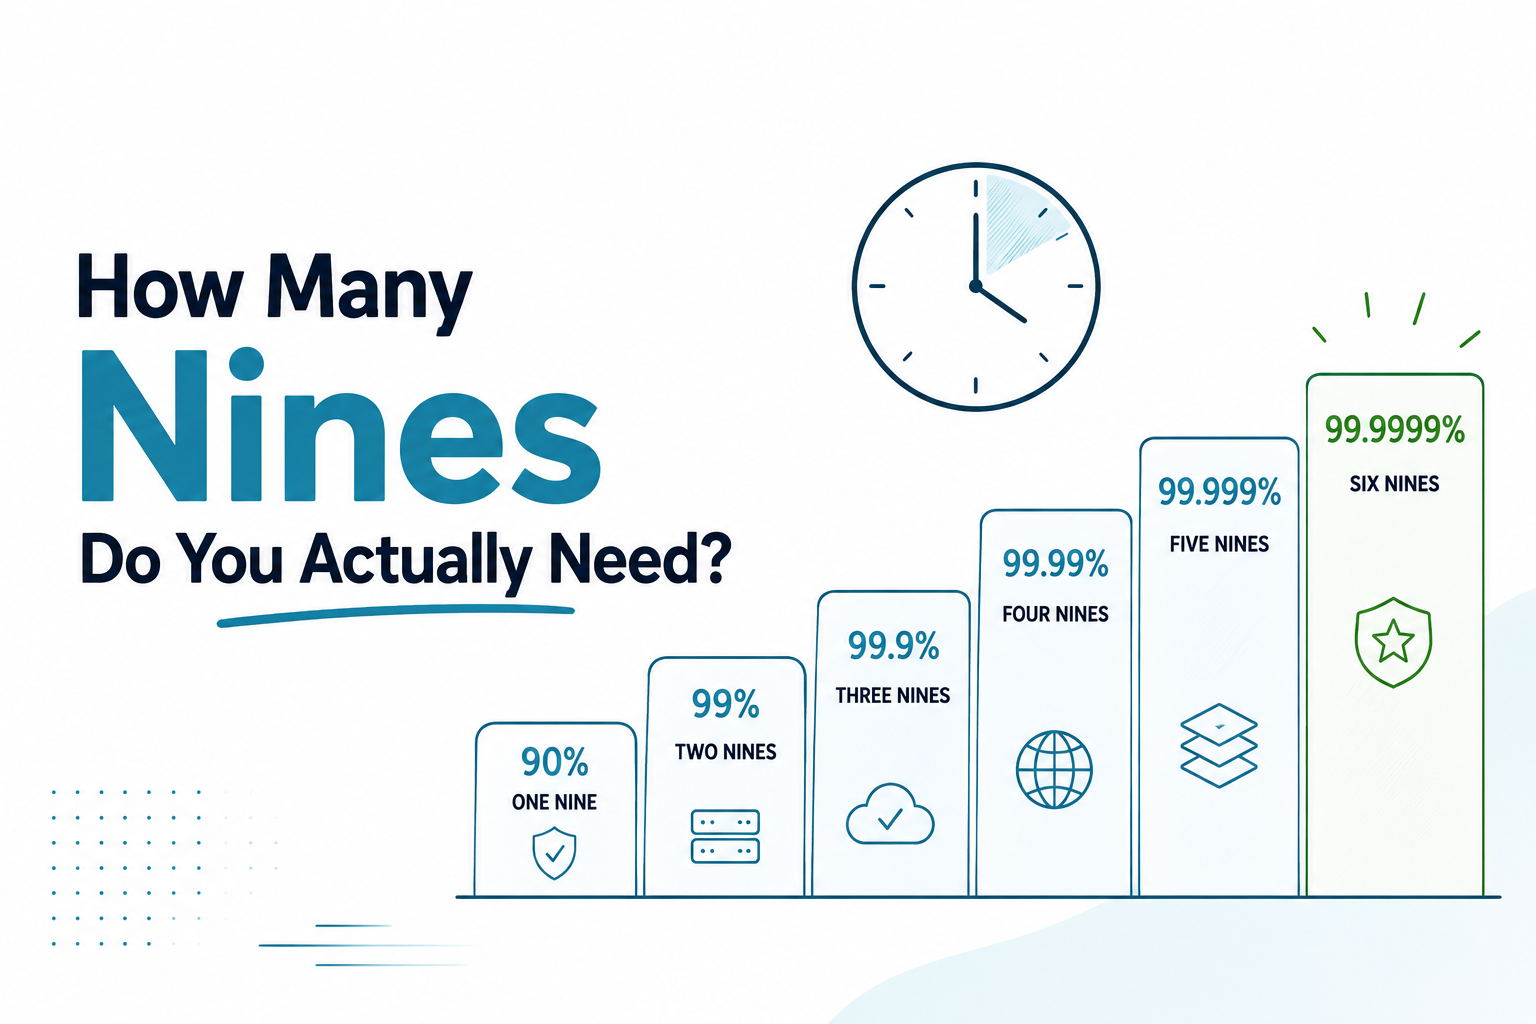
The cost curve of availability: what each nine allows in downtime, what it costs to build, and why most services should target fewer nines.
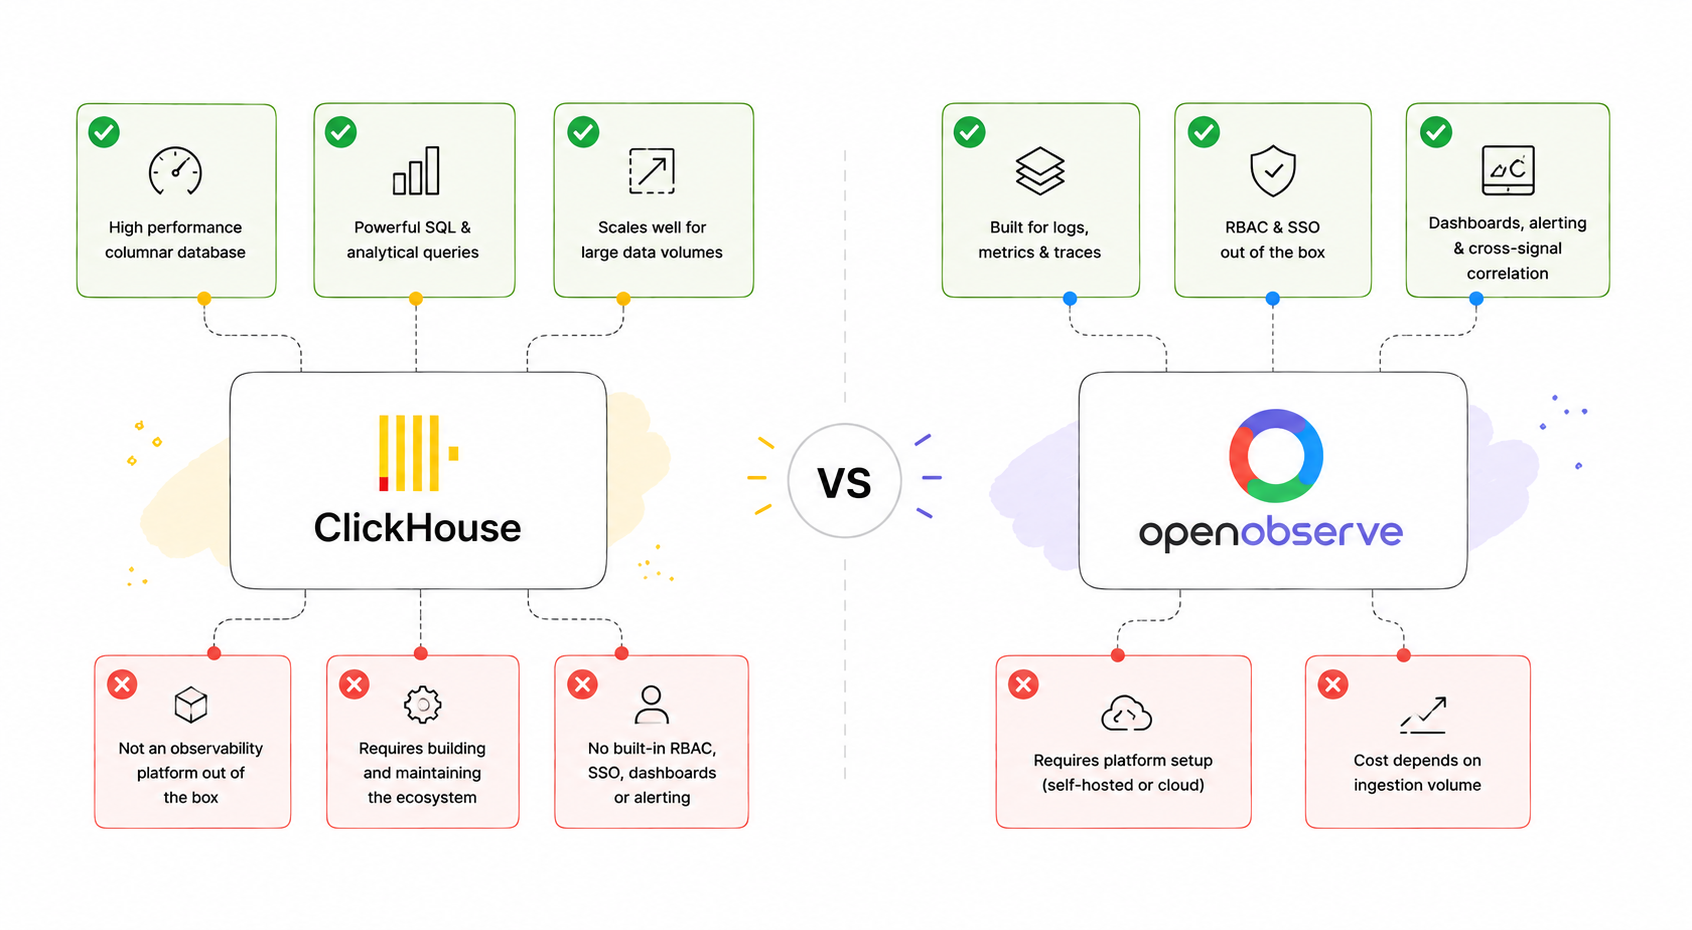
ClickHouse and OpenObserve compared for observability: architecture, ingestion, RBAC and SSO, high availability, and cost at scale, for teams choosing what to build logs, metrics, and traces on.
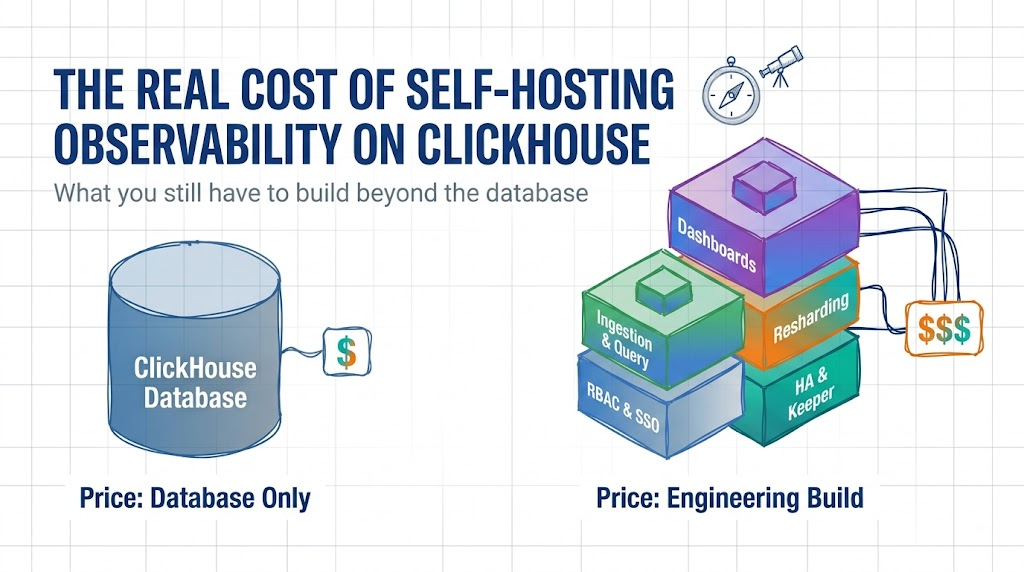
ClickHouse's storage economics are genuinely excellent. Self-hosting a production observability platform on top of it isn't free, it's an engineering build. Here's what that build actually costs.
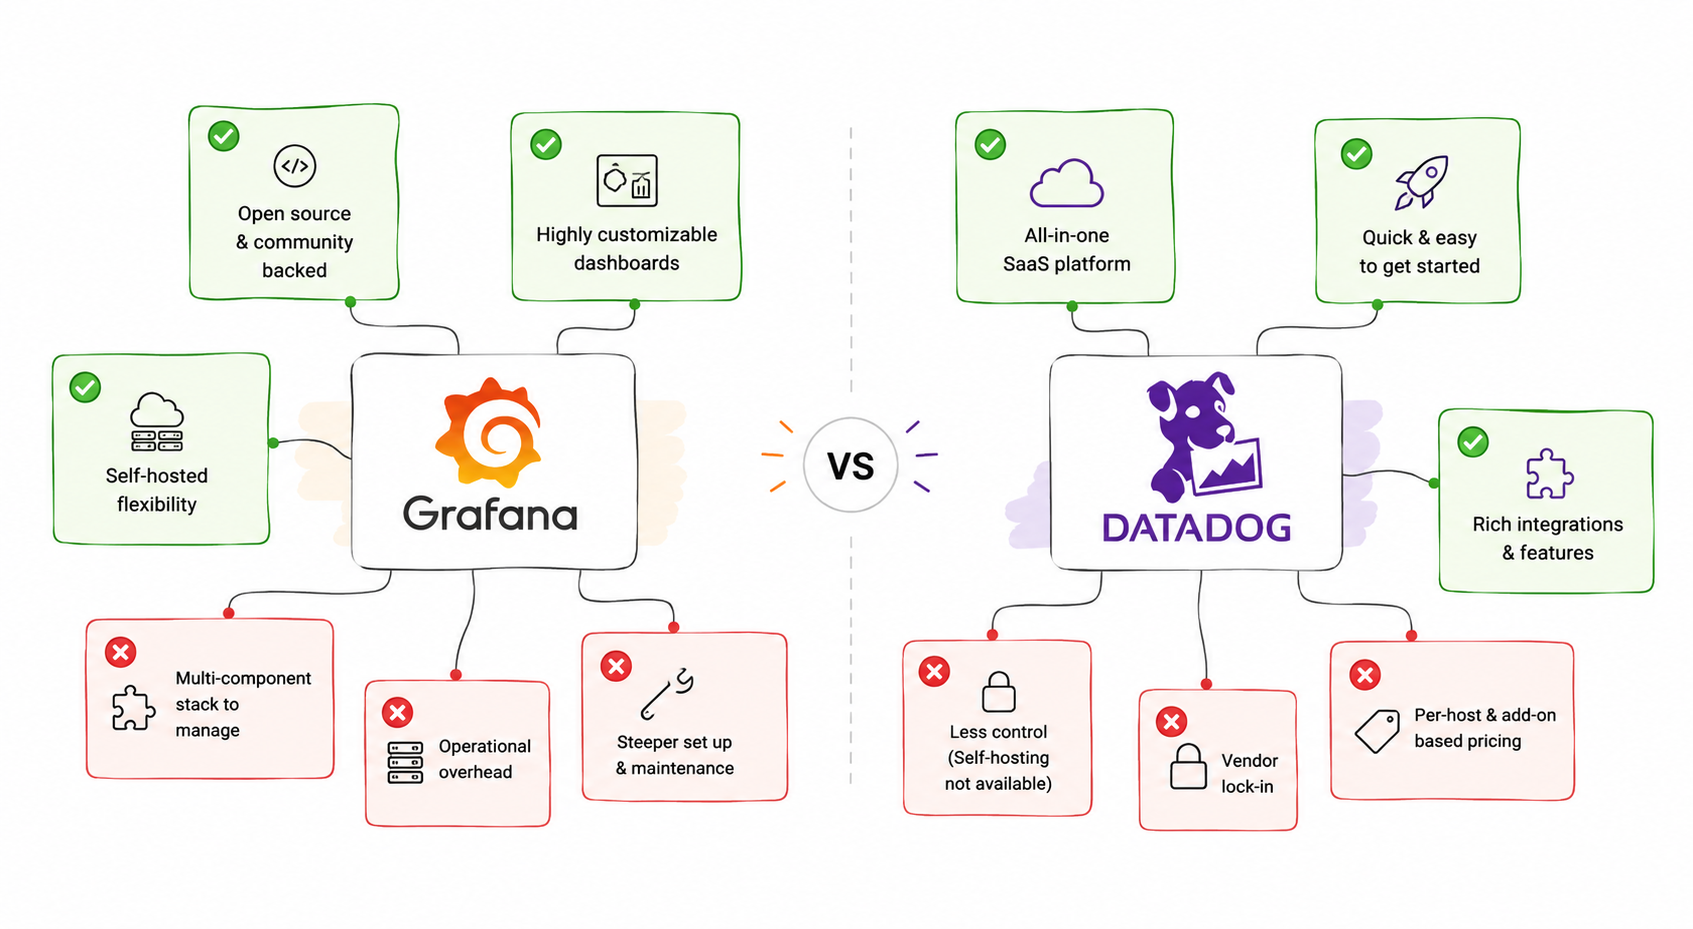
A side-by-side comparison of Grafana and Datadog on pricing and features, and where OpenObserve fits as a unified alternative to both.
AI Observability by OpenObserve
OpenTelemetry-native observability for agents and LLMs.