7 Langfuse Alternatives for LLM Observability (2026)




Ready to get started?
Try OpenObserve Cloud today for more efficient and performant observability.
TL;DR
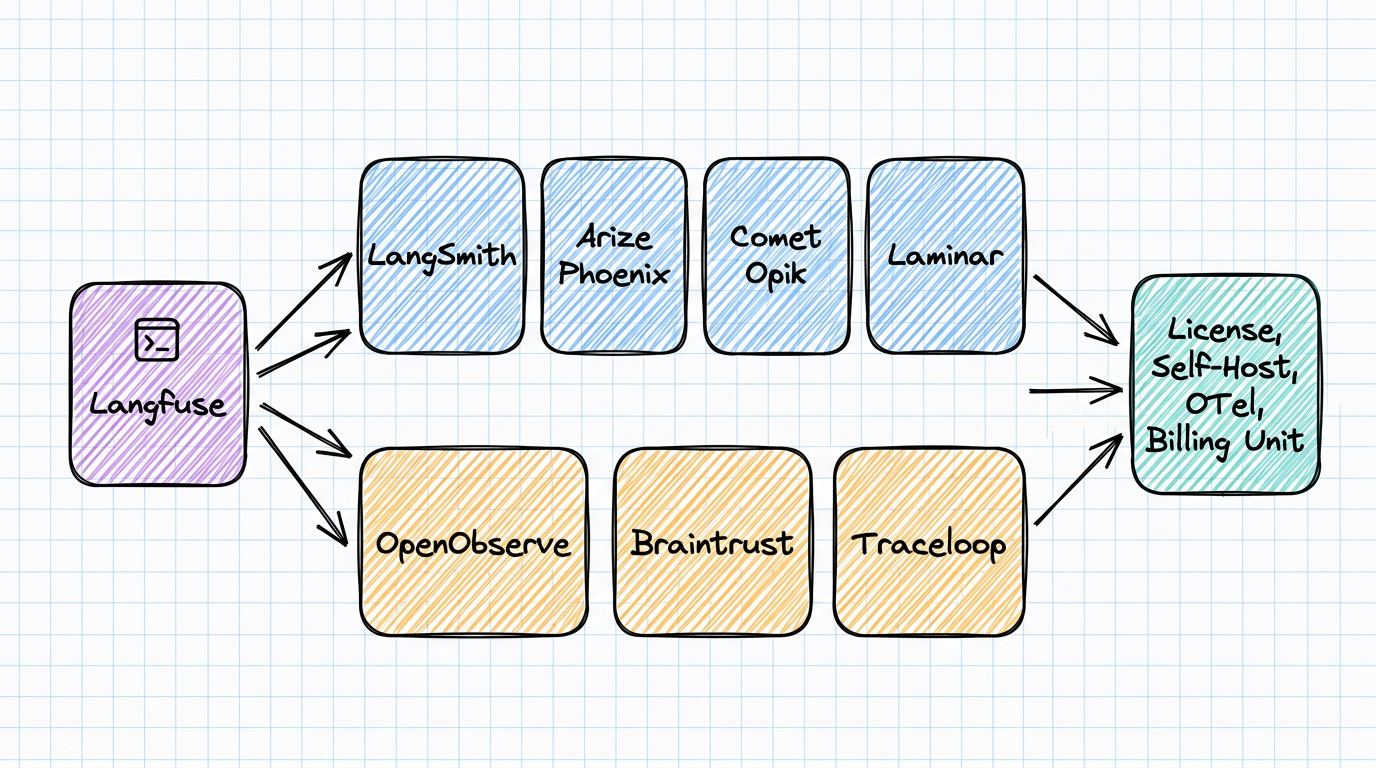
Most people searching for Langfuse alternatives in 2026 are doing it for one of two reasons: ClickHouse acquired Langfuse in January and they want to know what that means, or their trace bill stopped making sense as they moved from chat apps to agents. This post covers seven alternatives, what each one is genuinely better at, and the case for not switching at all.
- The best overall alternative is OpenObserve. It stores LLM spans in the same OpenTelemetry-native backend as your infrastructure logs, metrics, and traces, with no proprietary SDK, and self-hosts as a single binary under AGPL-3.0. If the reason you are looking is consolidation rather than a missing feature, it is the strongest option on this list.
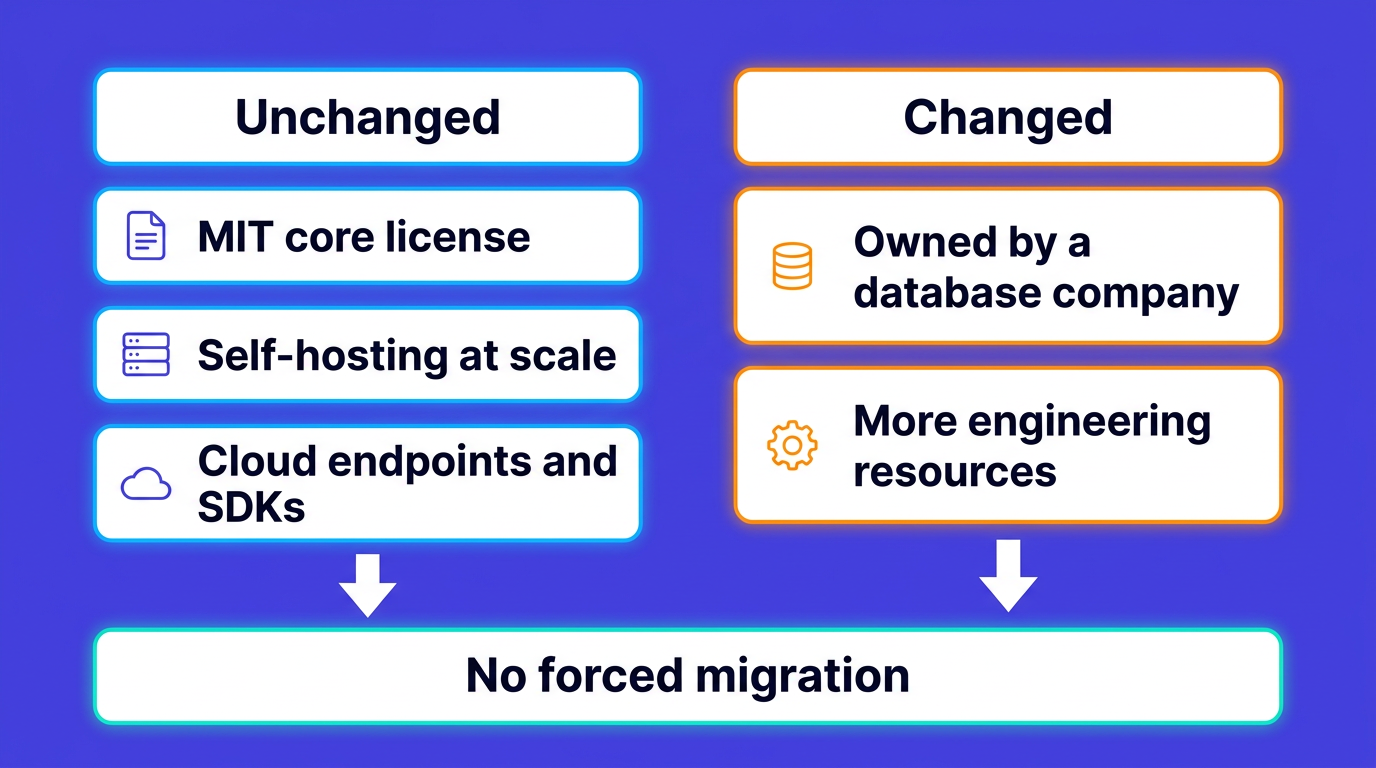
- The acquisition changed less than you think. ClickHouse announced it on January 16, 2026. The MIT core license, self-hosting, and Cloud endpoints are unchanged, and both companies committed to keeping it that way.
- The seven: OpenObserve, LangSmith, Arize Phoenix, Comet Opik, Laminar, Braintrust, and Traceloop/OpenLLMetry.
- Half of these are not competitors. Some are development platforms (prompts, datasets, evals), some are observability backends, and one is an instrumentation library. Comparing across those categories is where most tool evaluations go wrong.
- Billing units matter more than headline prices. Units, traces, spans, seats, and GB are five different models, which is why quotes for the same workload are so hard to compare.
- "Open source" hides three different licenses. MIT (Langfuse core), Apache-2.0 (Opik, Laminar), and Elastic License 2.0 (Phoenix) are not the same commitment.
Why people are looking for Langfuse alternatives in 2026
Langfuse earned its position. It is one of the most widely adopted open source LLM observability platforms, with 31.5k GitHub stars at the time of writing, it is genuinely framework-agnostic, and the self-hosted version runs at production scale rather than being a crippled demo. For a lot of teams it is still the right answer.
Three things push teams to look anyway.
Ownership changed. ClickHouse acquired Langfuse on January 16, 2026, alongside a $400M Series D that valued ClickHouse at $15 billion. Nothing broke, but any acquisition prompts a re-evaluation, especially for teams who picked Langfuse specifically because it was independent and open source.
Trace shape changed. A chat application produces a handful of spans per user interaction. An agent produces dozens: nested tool calls, retries, and sub-agent hops that run for minutes. That is far more data per interaction, and every tool that bills per trace or per span responds to it differently. Teams often discover this only when a monthly bill jumps without a matching jump in users, which is the same pressure driving AI agent monitoring as its own discipline.
Stack sprawl. LLM traces live in Langfuse. Application traces live in an APM tool. Infrastructure logs and metrics live somewhere else. When a user reports a slow response, answering "was that the model or the database" means three tabs and manual timestamp matching.
What actually changed after ClickHouse acquired Langfuse
Worth being precise here, because most alternative roundups do not mention the acquisition at all and the ones that do tend to overstate it.
What did not change:
- The Langfuse core stays open source under MIT. Both ClickHouse and Langfuse stated there are no planned licensing changes.
- Self-hosting is still supported at production scale, on the same Docker Compose and Kubernetes paths.
- Langfuse Cloud runs as before, with the same endpoints, the same SDKs, and the same product.
- The roadmap direction is unchanged, with more engineering resources behind it.
What did change: Langfuse is now owned by a database company. Langfuse v3 already ran on ClickHouse internally before any acquisition talk, because Postgres hit bottlenecks at the row counts Langfuse was handling, so the technical fit was real rather than manufactured. The strategic question that follows is whether you want your LLM observability tied to a specific analytical database vendor, which matters if you are deciding where your whole telemetry stack consolidates over the next few years.
That is a legitimate consideration, not an emergency. For a fuller side-by-side, see OpenObserve vs Langfuse.
How to compare LLM observability tools
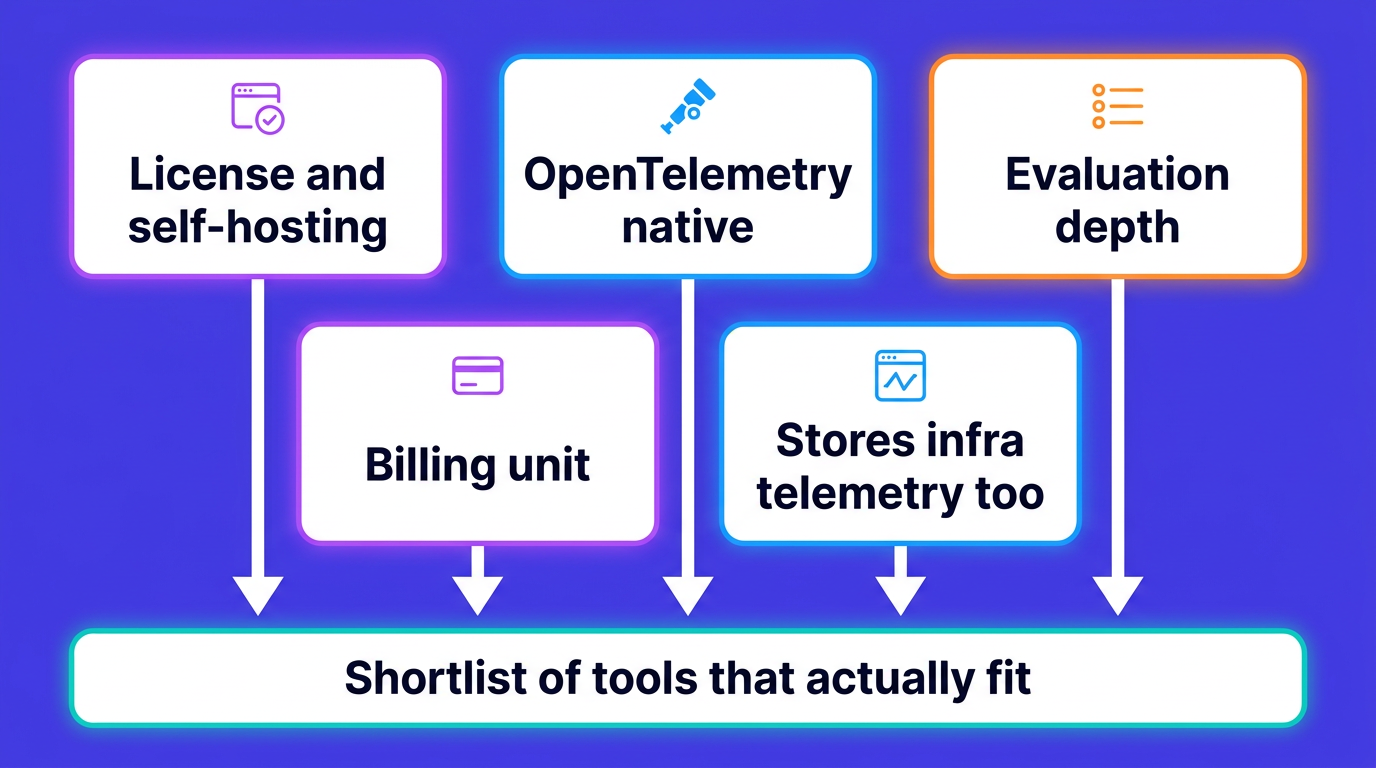
Before the list, five axes that actually separate these tools. Most comparison tables use a green checkmark for "open source" and "tracing," which tells you nothing. Our open source LLM observability tools guide goes deeper on the category itself.
1. License and self-hosting reality. "Open source" covers MIT (do what you want), Apache-2.0 (same, with a patent grant), and Elastic License 2.0 (source-available, no reselling as a service). Then ask a separate question: is the self-hosted build the full product, or is SSO, RBAC, and audit logging gated behind an enterprise plan? Teams with data residency requirements should confirm both, along with how the tool handles PII in LLM telemetry.
2. OpenTelemetry-native or proprietary SDK. If a tool ingests OTLP and reads the OpenTelemetry GenAI semantic conventions, your instrumentation is portable and switching backends later is a config change. If it needs its own SDK wrapping every call, you have written vendor-specific code into your application. Most tools here now accept OTLP, so the sharper question is which semantic conventions they expect on the way in.
3. Evaluation depth. Some tools store traces. Some run LLM-as-judge scoring on sampled production traffic, manage datasets, and gate CI on eval results. That is a different product category, and it is the main reason a team keeps two tools instead of one.
4. Billing unit. Units, traces, spans, seats, GB. This single choice determines whether your bill scales with users, with trace depth, or with payload size. Vendors change their rates often enough that the only durable comparison is the unit, not the number attached to it.
5. Does it hold anything but LLM data? If the tool only stores LLM spans, correlating a slow completion with a saturated database connection pool means leaving the tool.
The 7 Langfuse alternatives
1. OpenObserve
Our pick for the top spot, and full disclosure, our product, so treat this section accordingly. It leads this list because it solves the problem the other six leave in place: LLM traces living in a silo, separate from the rest of your telemetry. OpenObserve is a general-purpose observability backend rather than an LLM-specific platform: it ingests OTLP and stores gen_ai.* spans in the same columnar store as your application traces, infrastructure logs, metrics, and RUM data.
Where it beats Langfuse: LLM spans sit next to everything else, so "was the slow response the model or the vector database" is one query rather than a cross-tool investigation. Instrumentation is standard OpenTelemetry with no proprietary SDK. Per-model input and output pricing is configurable, so cost fields are computed against your actual billing agreement rather than a vendor's generic pricing table, which the LLM cost monitoring guide walks through alongside instrumenting LLM apps with OpenTelemetry. It is AGPL-3.0 licensed and self-hostable as a single binary.
Where it does not: OpenObserve has no prompt management, no playground, and no dataset management, so the develop-and-iterate half of Langfuse has no equivalent here. Evaluation exists but is an enterprise feature: evaluation pipelines score sampled responses against templates you define, with results written to a separate stream and surfaced in an Evaluations tab on the trace. That is narrower than what a dedicated eval platform gives you. Plenty of teams run both.
License: AGPL-3.0 for the open source edition.
Pick it if: you already run, or want to run, infrastructure and application observability in one backend and do not want LLM telemetry to be the exception.
2. LangSmith
The default for teams already deep in LangChain and LangGraph. Tracing, evals, prompt management, and deployment workflows all speak the same abstractions your code already uses, so nothing needs translating into a new vendor's mental model.
Where it beats Langfuse: lowest friction if your stack is LangChain. Nested agent runs, chains, and tool calls render as first-class concepts rather than generic spans, and the eval and dataset tooling is mature. It also exposes an OTLP endpoint, so non-LangChain services can report into the same project.
Where it does not: it is closed source, and self-hosting is an enterprise-only arrangement. It is built by the LangChain team for LangChain users, so if you are framework-agnostic, or planning to be, that is the wrong direction from Langfuse rather than an alternative to it. Its OTLP endpoint also expects OpenLLMetry semantic conventions rather than the OpenTelemetry GenAI conventions.
License: proprietary.
Pick it if: you are all-in on LangChain or LangGraph and cloud hosting is acceptable.
3. Arize Phoenix
The closest like-for-like swap for a self-hosted Langfuse deployment. Phoenix is source-available, OpenTelemetry-native through the OpenInference conventions, and free to self-host with no usage caps or feature gates.
Where it beats Langfuse: the self-hosted build has no usage limits and can run fully air-gapped, with nothing reported back to Arize. Trace-level detail for RAG pipelines and agent runs is strong, and the OpenInference conventions give you portable instrumentation. Prompt management is a first-class feature rather than an afterthought: you can create, version, and deploy prompts, replay a traced span in a playground, and sync prompts into code through the client SDKs. There is also a commercial upgrade path (Arize AX) if you later want managed hosting.
Where it does not: the Elastic License 2.0 is source-available, not OSI open source, so you cannot offer it as a competing hosted service. Instrumentation is built around OpenInference rather than the OpenTelemetry GenAI conventions, which is portable across tools that speak OpenInference but is still a convention choice you inherit. The project also moves quickly enough that upgrades need attention.
License: Elastic License 2.0 (source-available).
Pick it if: you want a self-hosted, OpenTelemetry-native platform and the Elastic License is acceptable in your organization.
4. Comet Opik
The most permissively licensed full platform here. Opik is Apache-2.0, and the repository ships the server backend, web application, tracing, datasets, experiments, evaluations, prompt management, online evaluation, and agent optimization components under that license, not just a client SDK.
Where it beats Langfuse: Apache-2.0 with an explicit patent grant is a lower bar to clear in legal review than MIT-with-carve-outs, since the Langfuse repository is MIT "except for the ee folders." The evaluation tooling is deep, with LLM-as-judge metrics for hallucination, relevance, and moderation available out of the box.
Where it does not: the wider Comet platform is oriented around ML experiment tracking, so Opik carries some of that framing, and it is a less obvious fit if you have no ML lifecycle needs. Its community is smaller than Langfuse's (20.7k GitHub stars against Langfuse's 31.5k), which shows up in the number of third-party integration guides. Comet also sells an Enterprise tier with SSO and compliance certifications, so confirm which security features your deployment needs before assuming the self-hosted build covers them.
License: Apache-2.0.
Pick it if: license permissiveness is your top constraint, or you want deep evals without paying for them.
5. Laminar
Built for agent workloads specifically, with the argument that agent traces are a different data shape from prompt-and-completion logging: longer, deeper, and far larger per interaction.
Where it beats Langfuse: billing on ingested data volume rather than per trace means a deep agent run and a short chat turn are priced by what they actually cost to store. Laminar claims roughly 20x trace compression, though that is their own figure and worth testing against your payloads. The platform gives you raw SQL access over trace data rather than a fixed query UI, and its Signals feature extracts structured events from plain-language descriptions of what went wrong. The debugger records and replays runs with a cache, which is genuinely useful for iterating on an agent loop.
Where it does not: it is a younger project with a smaller ecosystem, and per-GB billing works against you if your traces are small and numerous, which is exactly the chat-app case Langfuse handles cheaply. Prompt management is limited to playground-style span replay rather than the versioning and deployment workflow Langfuse and Phoenix offer.
License: Apache-2.0.
Pick it if: you run agents with deep traces and per-trace billing has stopped being predictable.
6. Braintrust
An evaluation-first platform that treats traces as the input to a scoring and CI workflow rather than as the product. Its strongest feature is blocking a deploy when eval scores regress.
Where it beats Langfuse: the eval UI and experiment comparison workflow are the most polished in this list, and CI integration is a first-class feature rather than something you build with scripts and webhooks. For teams whose main problem is "did this prompt change make things worse," it is a better fit than an observability tool.
Where it does not: closed source, managed only, no self-hosting outside enterprise arrangements. If data sovereignty is why you chose Langfuse, this is not an alternative for you.
License: proprietary.
Pick it if: evals and CI gating are the job, and hosted is fine.
7. Traceloop / OpenLLMetry
Not a backend, which is the point. OpenLLMetry is a set of OpenTelemetry instrumentation libraries that patch the OpenAI, Anthropic, LangChain, and LlamaIndex clients and emit standard gen_ai.* spans to any OTLP endpoint. Traceloop is the commercial platform built on top.
Where it beats Langfuse: it decouples instrumentation from storage. Instrument once, send those spans to Langfuse, Phoenix, OpenObserve, or several at once, and switching backends later never means touching application code. This is the pattern behind our Helicone migration guide, where the instrumentation layer was the whole migration.
Where it does not: on its own it stores nothing, queries nothing, and evaluates nothing. It is one layer of the stack, so treating it as a Langfuse replacement means you still need to pick a backend.
License: Apache-2.0.
Pick it if: you have not committed to a backend yet, or you want the freedom to change your mind later.
Comparison table
| Tool | License | Self-host | OTLP ingest | Evals | Prompt mgmt | Infra telemetry | Billing unit |
|---|---|---|---|---|---|---|---|
| Langfuse | MIT, except ee folders |
Yes, full scale | Yes | Yes | Yes | No | Units |
| OpenObserve | AGPL-3.0 | Yes, single binary | Yes | Enterprise feature | No | Yes | GB ingested + queried |
| LangSmith | Proprietary | Enterprise only | Yes (OpenLLMetry semconv) | Yes | Yes | No | Traces + seats |
| Arize Phoenix | Elastic 2.0 | Yes, no caps | Yes (OpenInference) | Yes | Yes, with playground | No | Spans |
| Comet Opik | Apache-2.0 | Yes, full platform | Yes | Yes, deep | Yes | No | Spans |
| Laminar | Apache-2.0 | Yes | Yes, OTel-native | Yes | Playground replay only | No | GB ingested |
| Braintrust | Proprietary | Enterprise only | Yes | Yes, deep | Yes | No | Processed GB + seats |
| Traceloop/OpenLLMetry | Apache-2.0 | N/A (library) | Emits OTLP | No | No | N/A | N/A |
Read the billing-unit column carefully, because it is where budget surprises come from. The same workload costs one thing under per-trace billing and something very different under per-GB billing, depending entirely on how many spans and how much payload each call produces. Deep agent traces punish per-span pricing. Large context windows punish per-GB pricing. Work out your own average trace shape first, then price it against each vendor's current published rates.
Which one to pick
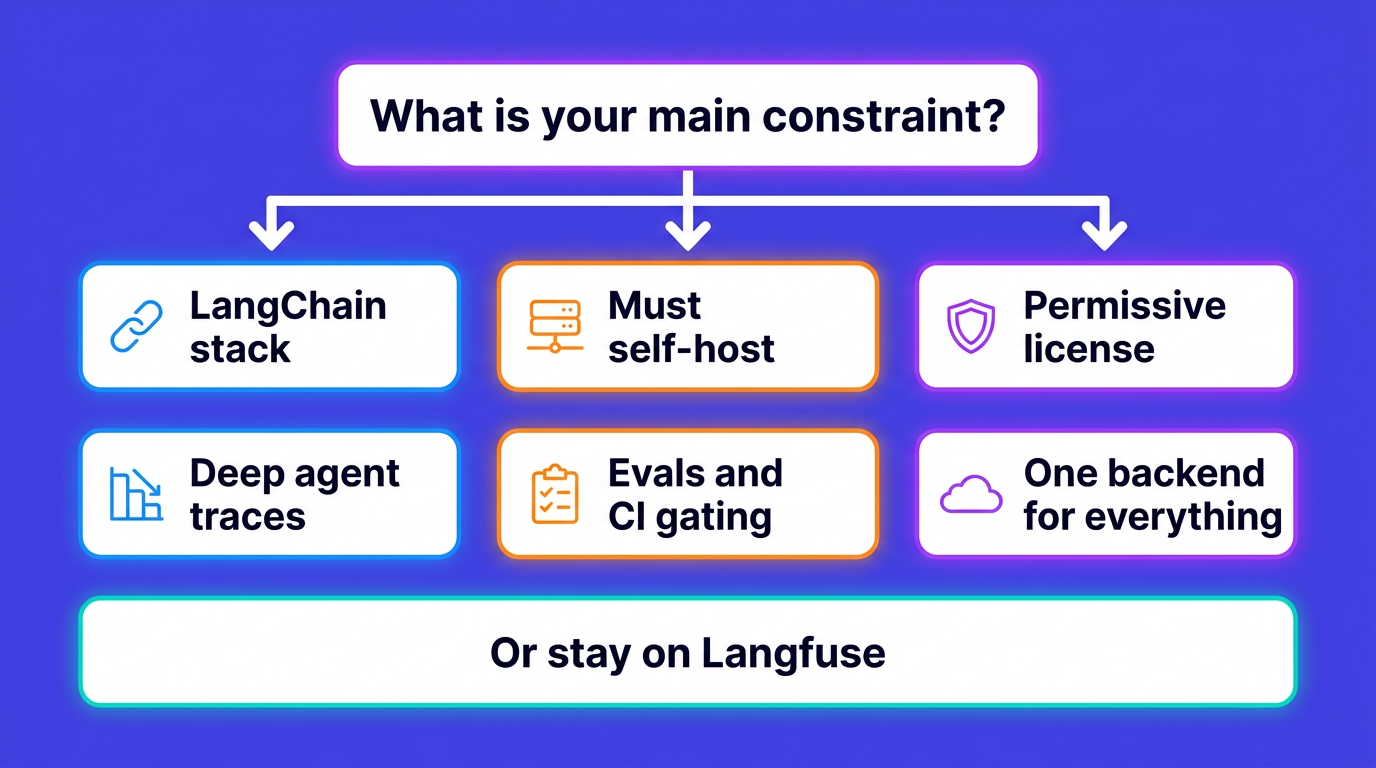
- You want LLM telemetry in the same backend as infrastructure and application telemetry. OpenObserve. For most teams this consolidation is the strongest reason to move at all.
- You are on LangChain or LangGraph and hosting is not a concern. LangSmith. The friction saving is real.
- You need self-hosted, OpenTelemetry-native, and full features. Arize Phoenix, or Comet Opik if the Elastic License is a problem in your legal review.
- Your legal team requires OSI-approved permissive licensing. Comet Opik or Laminar, both Apache-2.0.
- Your agents produce deep traces and per-trace billing broke. Laminar.
- Evals and CI gating are the actual problem. Braintrust.
- You have not decided yet. Instrument with OpenLLMetry and stay portable while you evaluate.
- Stay on Langfuse if you are happy with it, the self-hosted deployment is running fine, and the acquisition is your only concern. The license is intact, the roadmap is funded, and switching costs are real. "The company got acquired" is a reason to check in, not a reason to migrate.
Send LLM traces to OpenObserve
If OpenObserve is on your shortlist, the setup is standard OpenTelemetry with no product-specific SDK. Install OpenLLMetry, which patches your model clients and emits gen_ai.* spans:
pip install traceloop-sdk
from traceloop.sdk import Traceloop

Traceloop.init(app_name="my-llm-app")
Then point the SDK at your OpenObserve instance:
export TRACELOOP_BASE_URL="https://api.openobserve.ai/api/<your_org>"
export TRACELOOP_HEADERS="Authorization=Basic%20<your_base64_token>,stream-name=default"
Two things that will cost you an afternoon if you miss them. The Traceloop SDK does not read the generic OTEL_EXPORTER_OTLP_ENDPOINT variable: set TRACELOOP_BASE_URL instead, or it will default to Traceloop's own cloud and fail asking for an API key. And header values must be URL-encoded per the OTLP specification, so the space in Basic <token> has to be written as %20. Get that wrong and the SDK silently drops the Authorization header, exports succeed locally, and nothing arrives.
The base endpoint is enough, since the SDK appends /v1/traces itself. Grab the org slug and token from Data Sources → Custom → Traces in the UI. For self-hosted OpenObserve, swap the base URL for your instance, for example http://localhost:5080/api/default.
Because this is plain OTLP underneath, the same spans can go to a second backend at the same time. That is the practical way to trial an alternative: dual-ship for a couple of weeks, compare what each tool shows you, then decide.
Try OpenObserve Cloud
If the part of this that resonated was "I do not want LLM traces in a separate silo," that is the problem OpenObserve is built for: LLM spans, application traces, infrastructure logs, metrics, and RUM in one columnar store you can query with SQL. Start on OpenObserve Cloud, or run the self-hosted single binary for free under AGPL-3.0.
Frequently Asked Questions
About the Author
Gorakhnath Yadav


Gorakhnath is a passionate developer advocate, working on bridging the gap between developers and the tools they use. He focuses on building communities and creating content that empowers developers to build better software.
Follow OpenObserve on Google
Add OpenObserve as a preferred source to see more of our articles in Google Search and Top Stories.













