Getting Started with OpenObserve
A comprehensive comparison of the top 10 open source APM tools in 2026: OpenObserve, Uptrace, Jaeger, Grafana Tempo, and Zipkin. Covers unified observability, OpenTelemetry support, storage efficiency, and self-hosted deployment options.
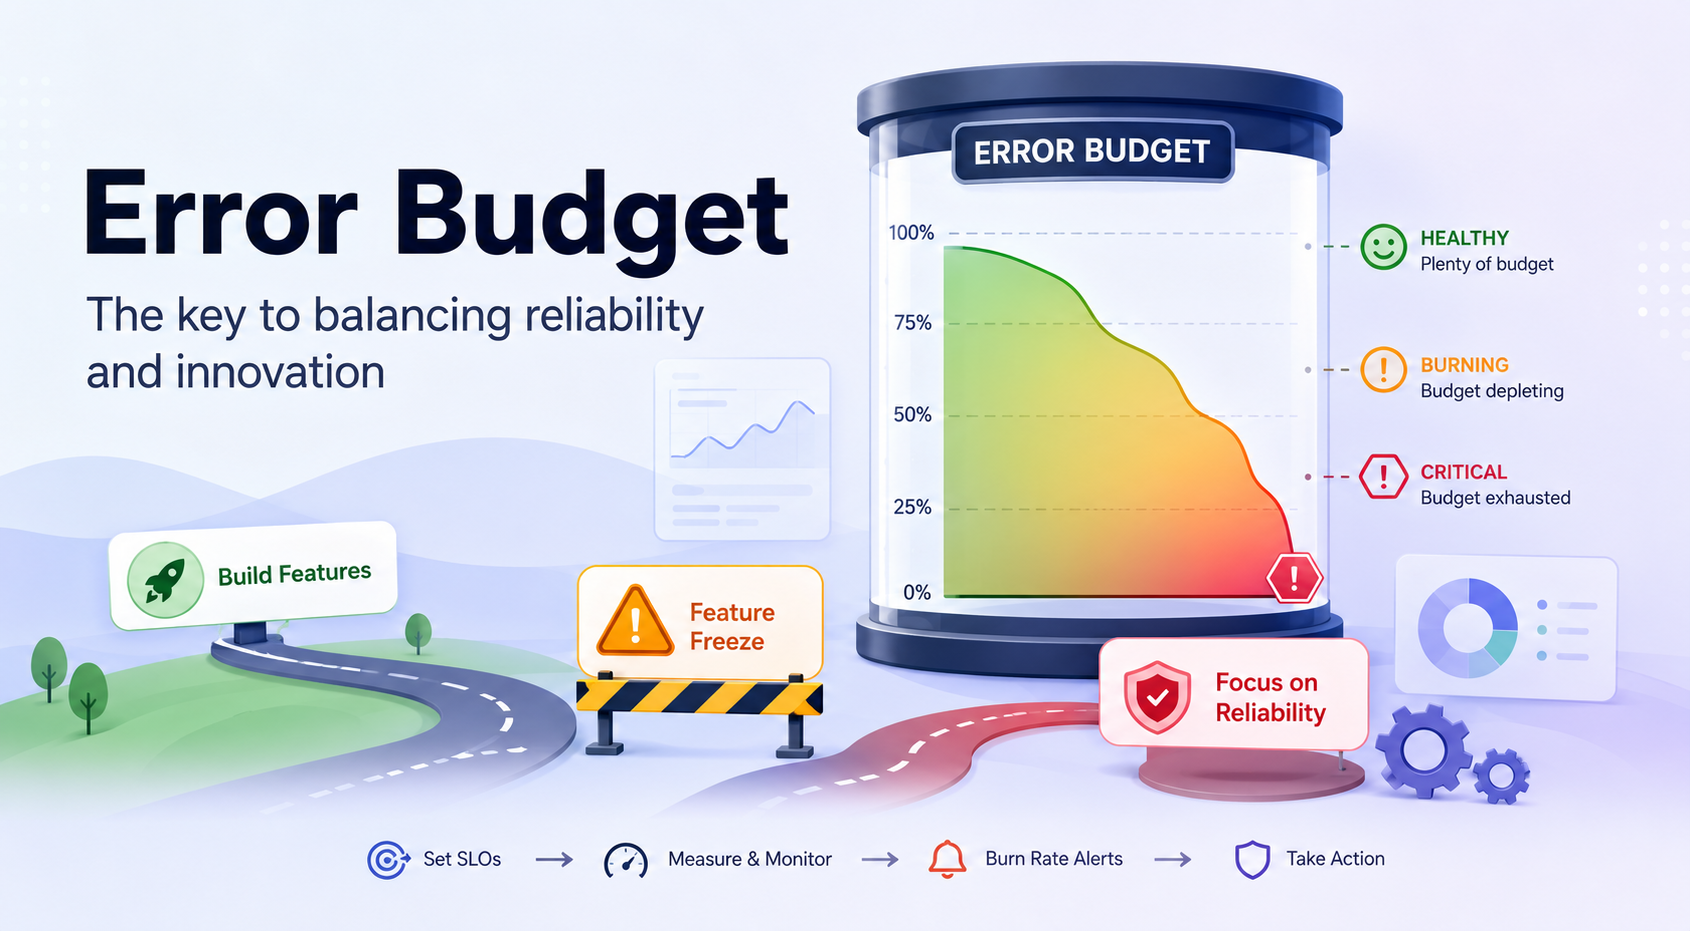
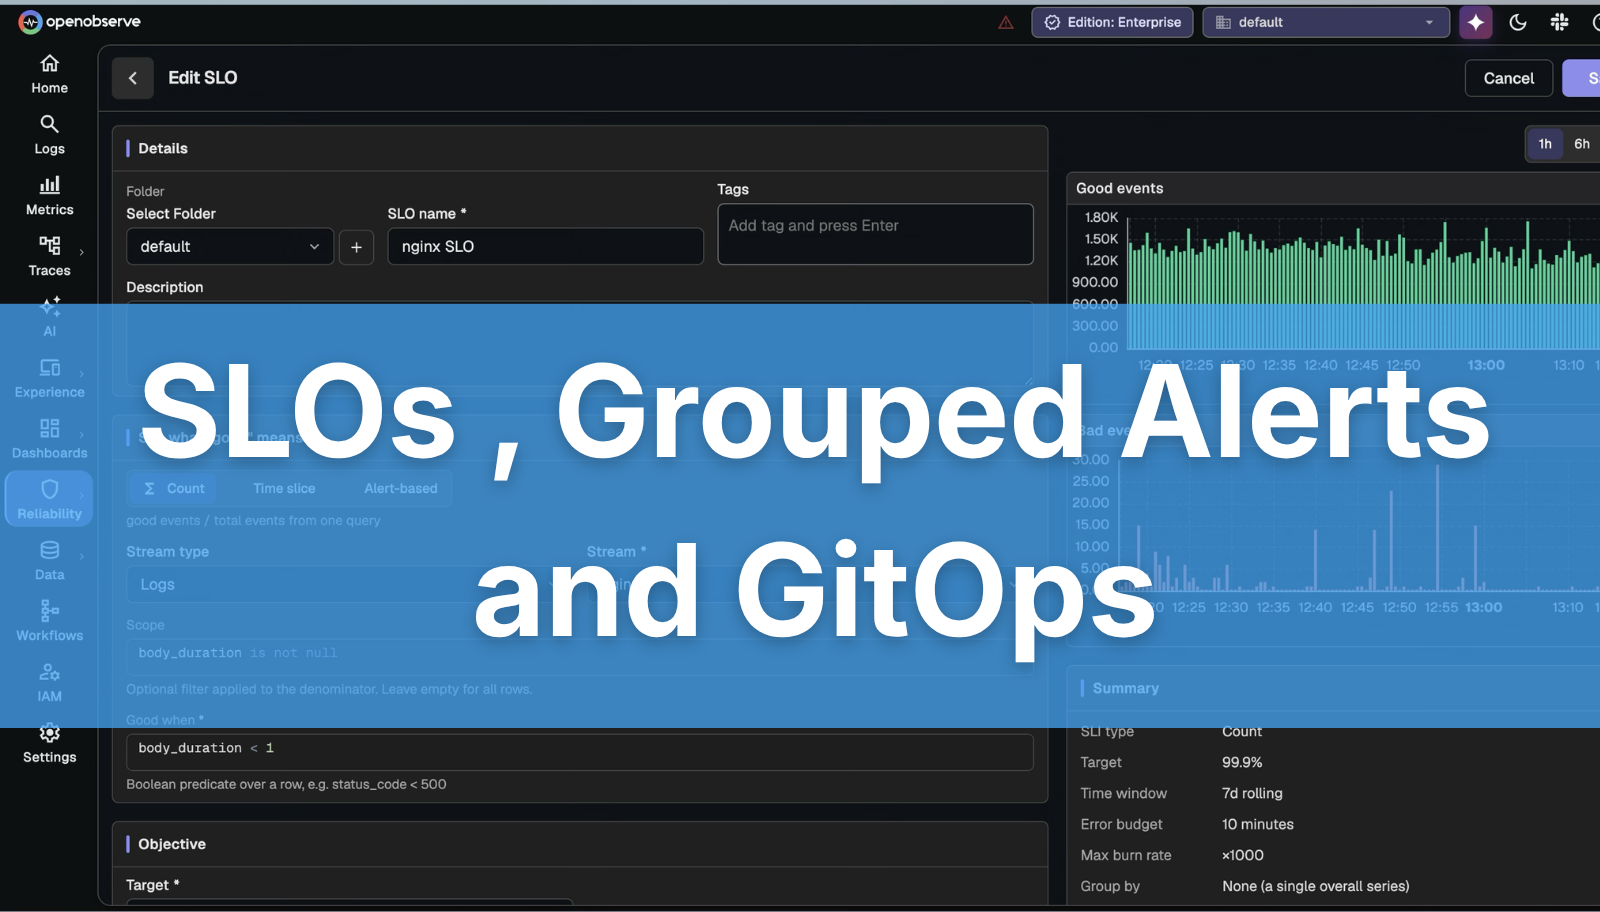
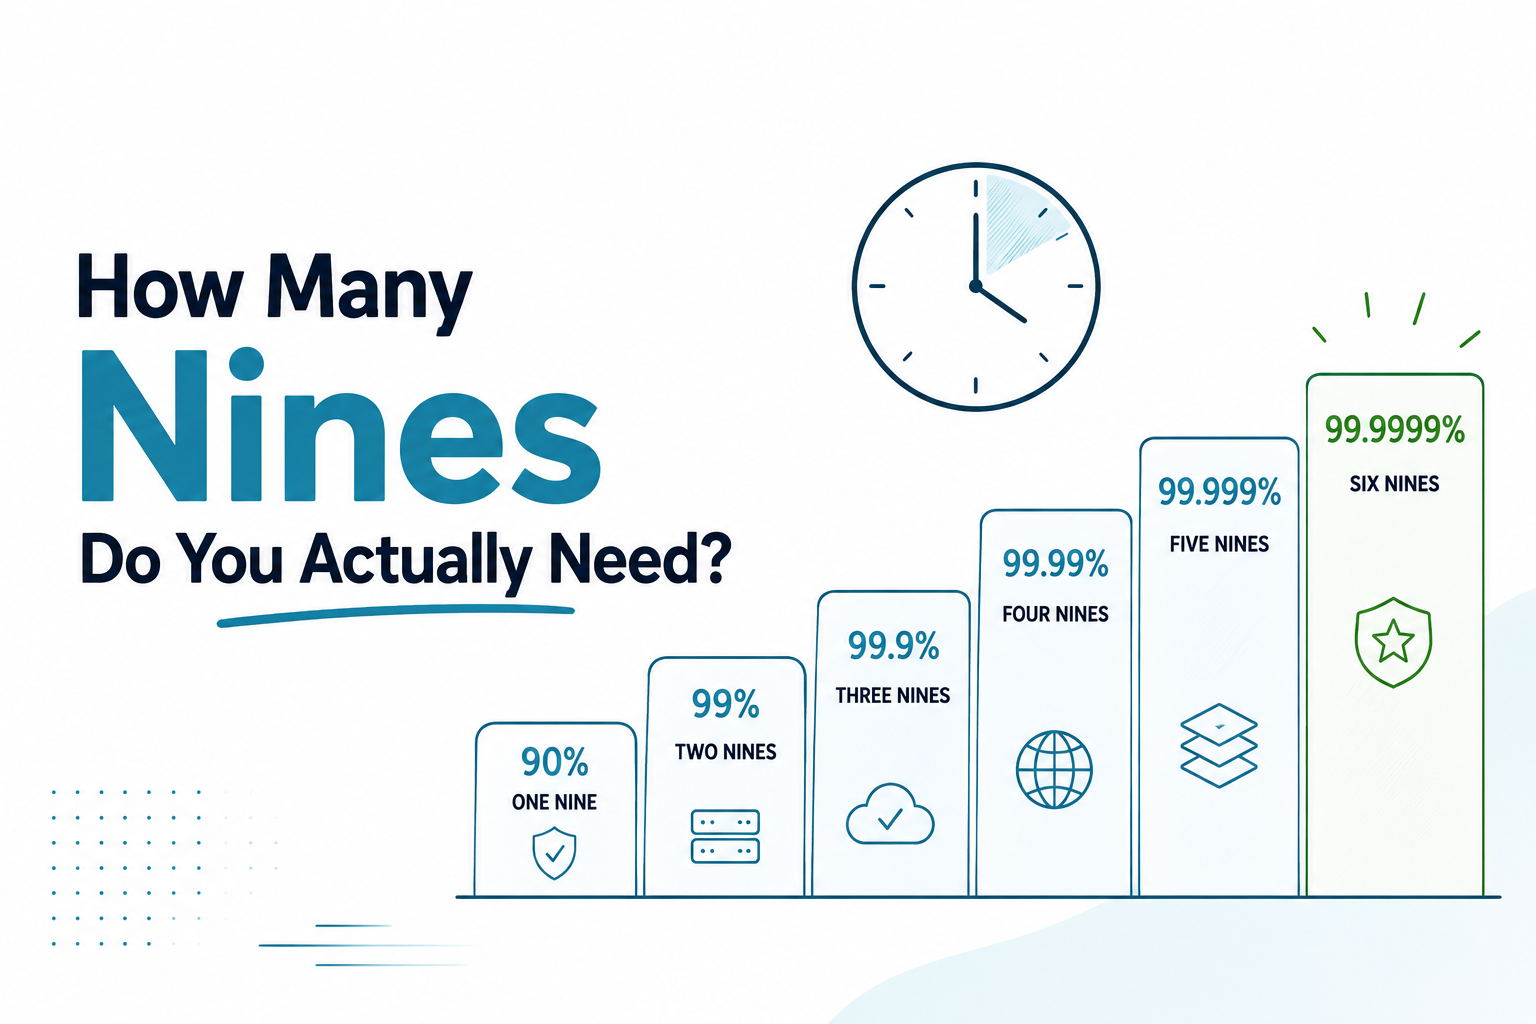
Struggling with SLOs? Learn how to set meaningful Service Level Objectives that reflect real user impact. Avoid common mistakes, define better SLIs, and build effective SLO-based alerting.
Compare the top 10 APM tools in 2026 — features, pricing, and use cases. OpenObserve delivers 60-90% cost savings with unified observability for logs, metrics, traces, and APM.
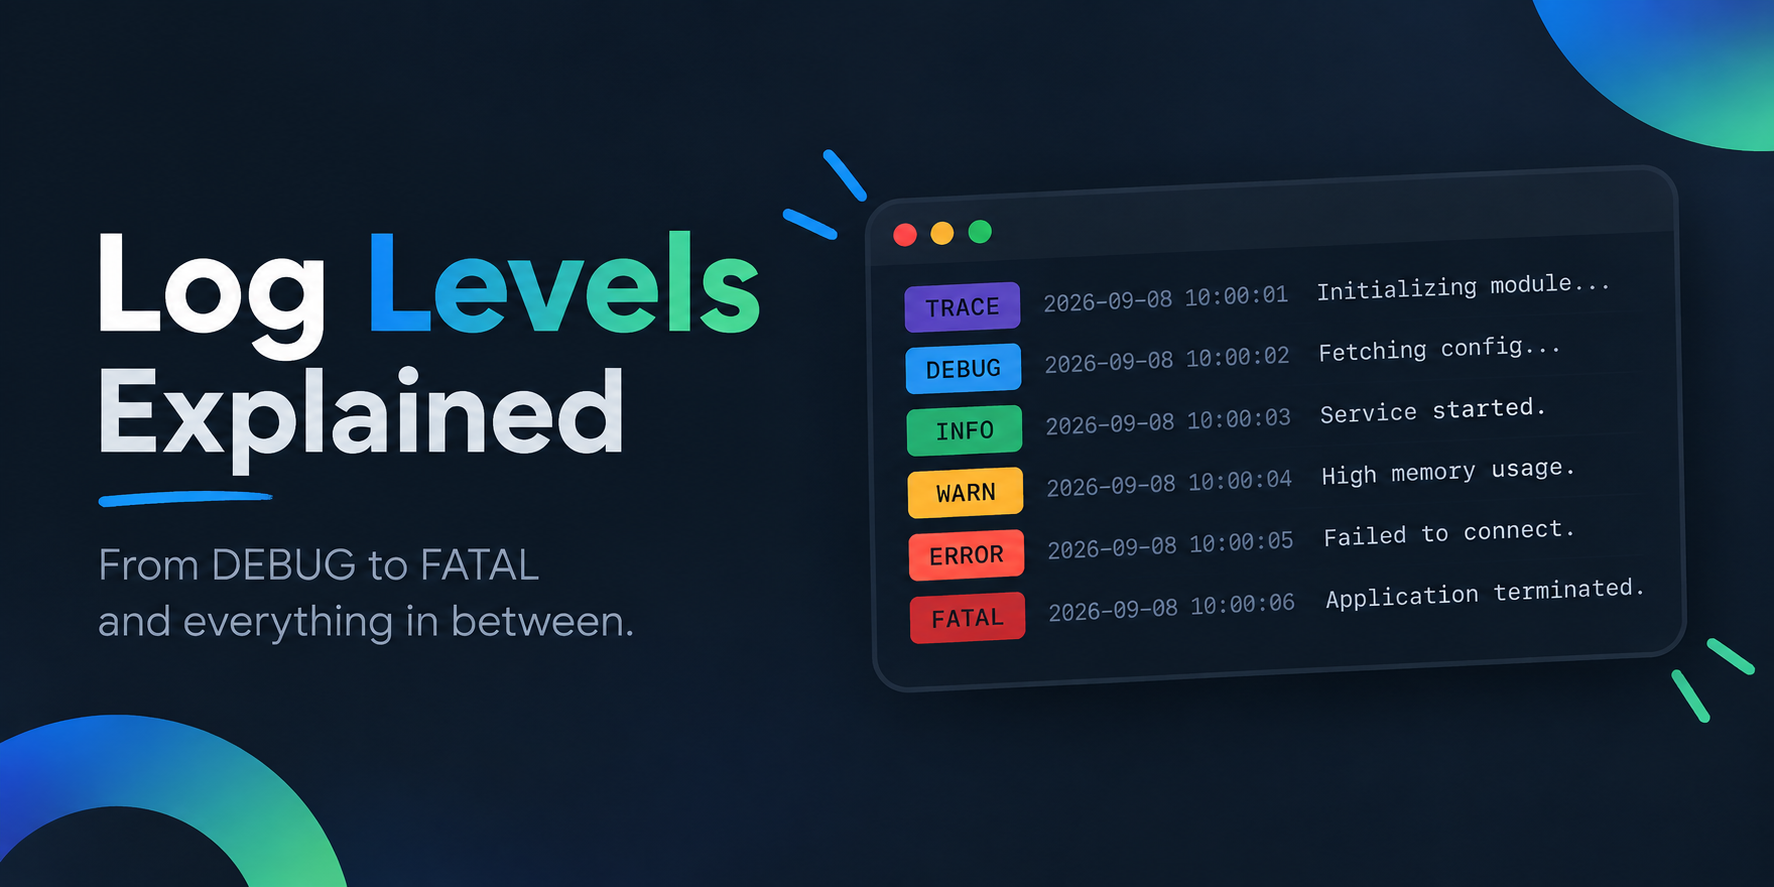
Best log monitoring and management tools for 2026, open source and commercial - plus when you need a SIEM and when log management is enough.
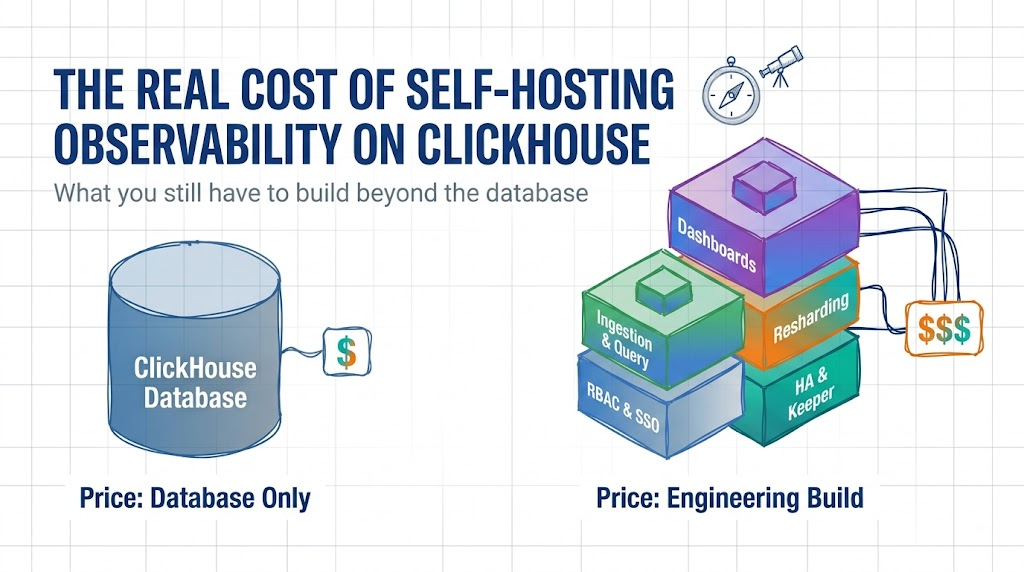
Compare the top 10 open source observability tools in 2026: OpenObserve, Prometheus, Grafana, Jaeger, and Loki. Covers logs, metrics, traces, deployment options, and cost trade-offs.
OpenObserve vs SigNoz compared in detail: architecture (object storage vs ClickHouse), pricing, self-hosting overhead, RUM and session replay, query language, and migration. A full feature-by-feature breakdown for teams choosing an open-source, OpenTelemetry-native observability platform.
Prometheus vs OpenTelemetry: do they compete or complement? What each does, how they work together, and which your team needs.
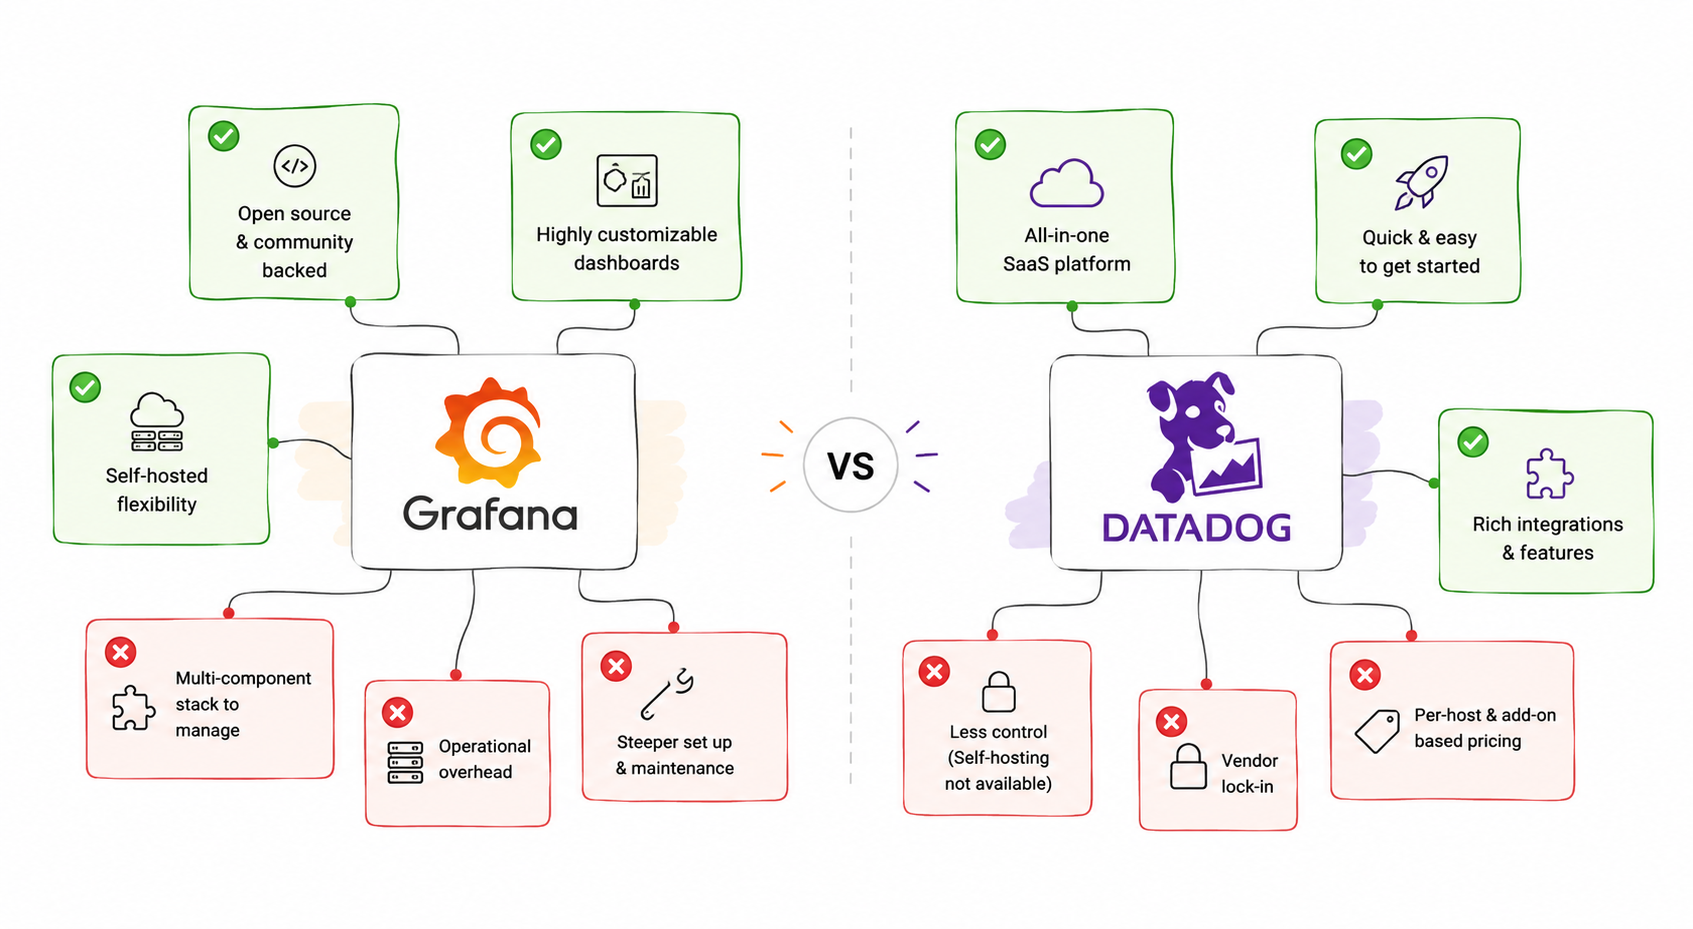
Compare the top 10 Datadog competitors and alternatives in 2026: OpenObserve, Grafana, New Relic, Dynatrace, and Splunk. Pricing breakdowns, feature tables, and migration guidance for DevOps and SRE teams.
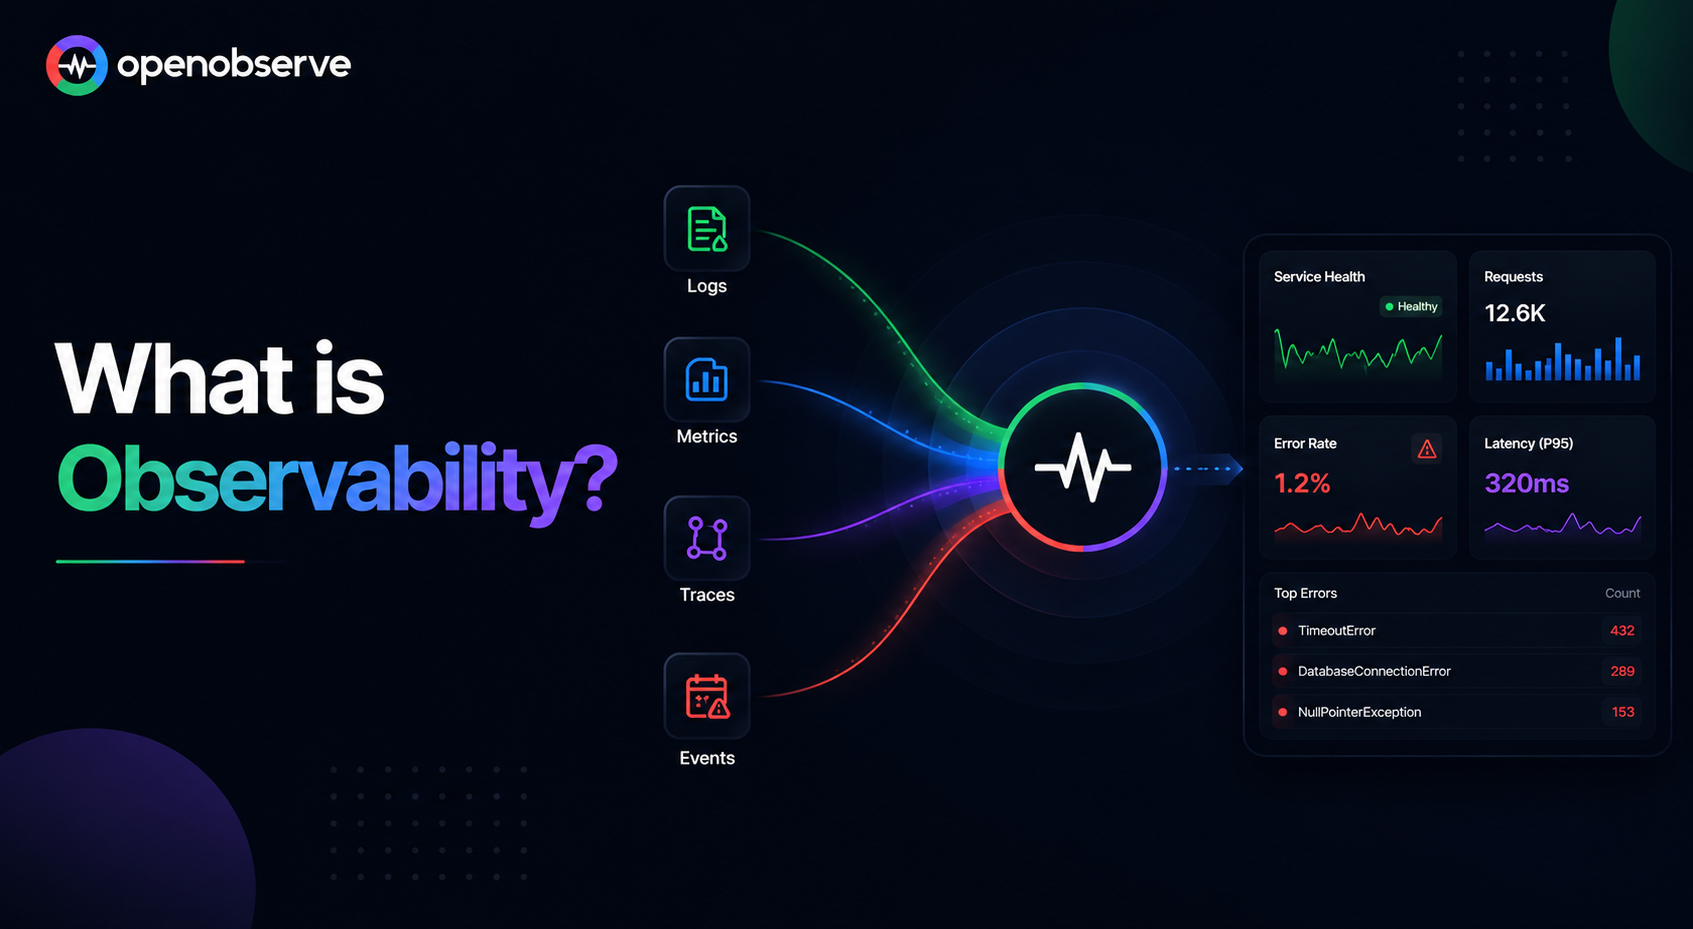
Observability vs monitoring explained. Learn how they differ, what each costs, and why modern teams layer observability on top of monitoring.
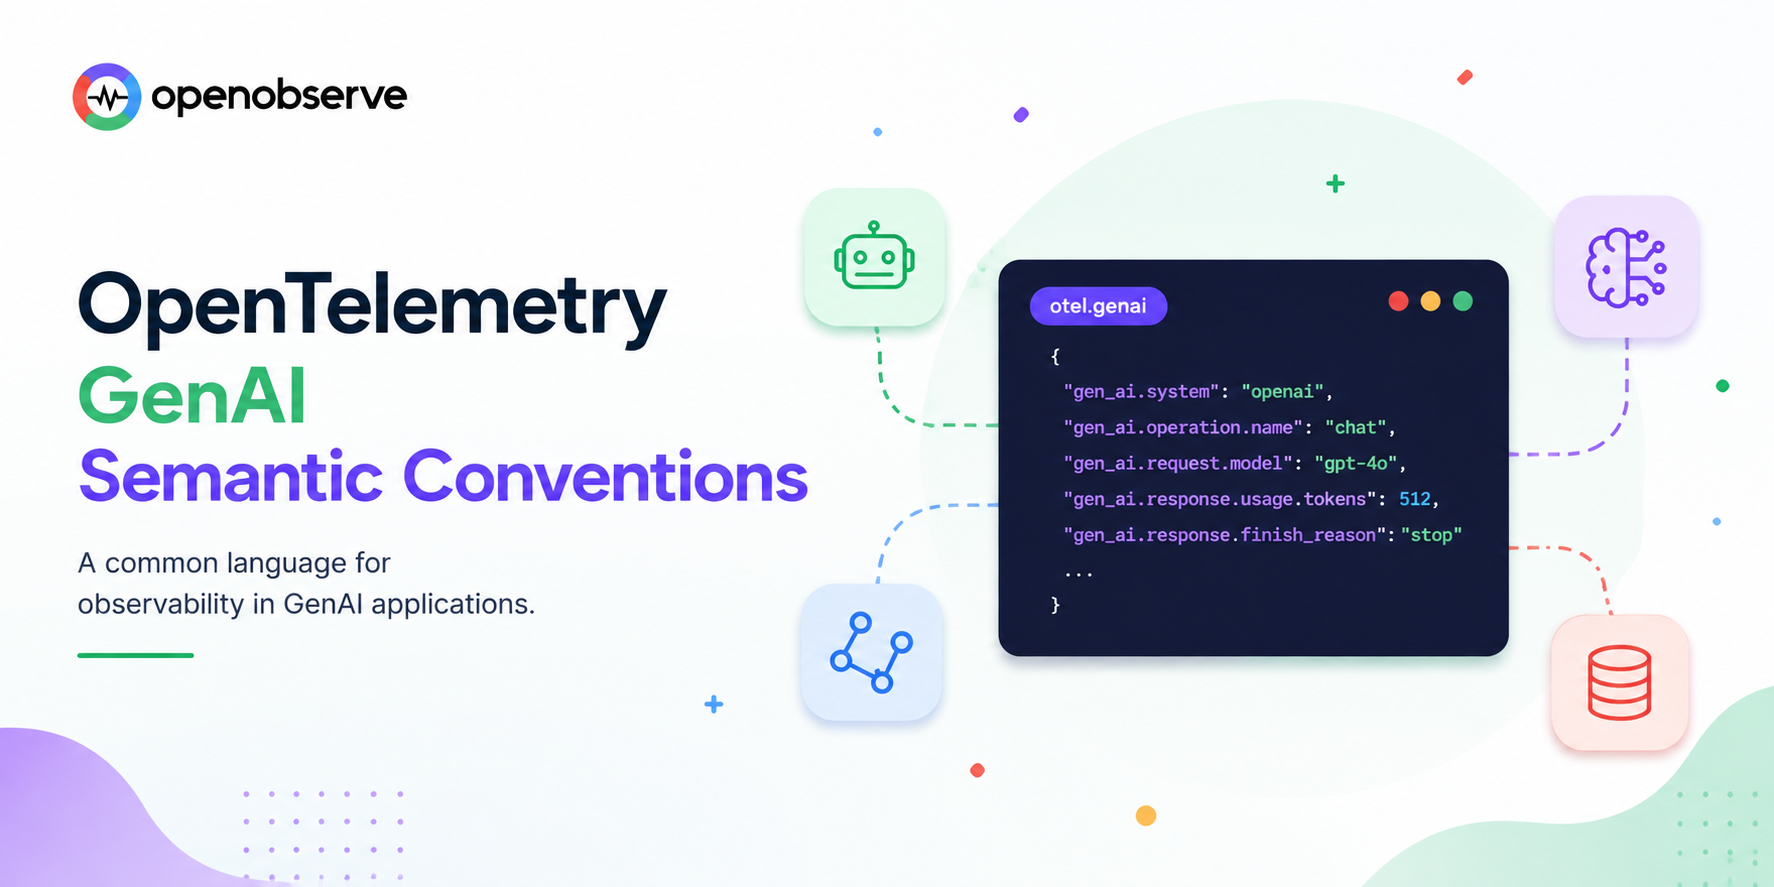
LLM observability explained for engineers: what it is, why traditional APM misses LLM failures, the three layers (computational, semantic, agentic), the core signals to track in production, and how OpenTelemetry GenAI semantic conventions standardize instrumentation.
Struggling with alert fatigue? Learn how to reduce noisy alerts, improve signal quality, and build effective alerting strategies that actually help teams respond faster.
Seven Langfuse alternatives compared for 2026: OpenObserve, LangSmith, Arize Phoenix, Comet Opik, Laminar, Braintrust, and Traceloop. Real licenses, self-hosting limits, OpenTelemetry support, and what the ClickHouse acquisition actually changed.
Seven LangSmith alternatives compared for 2026: OpenObserve, Langfuse, Comet Opik, Arize Phoenix, Laminar, MLflow, and Traceloop. Licenses audited from source, real self-hosting limits, and which tools survived a year of acquisitions.
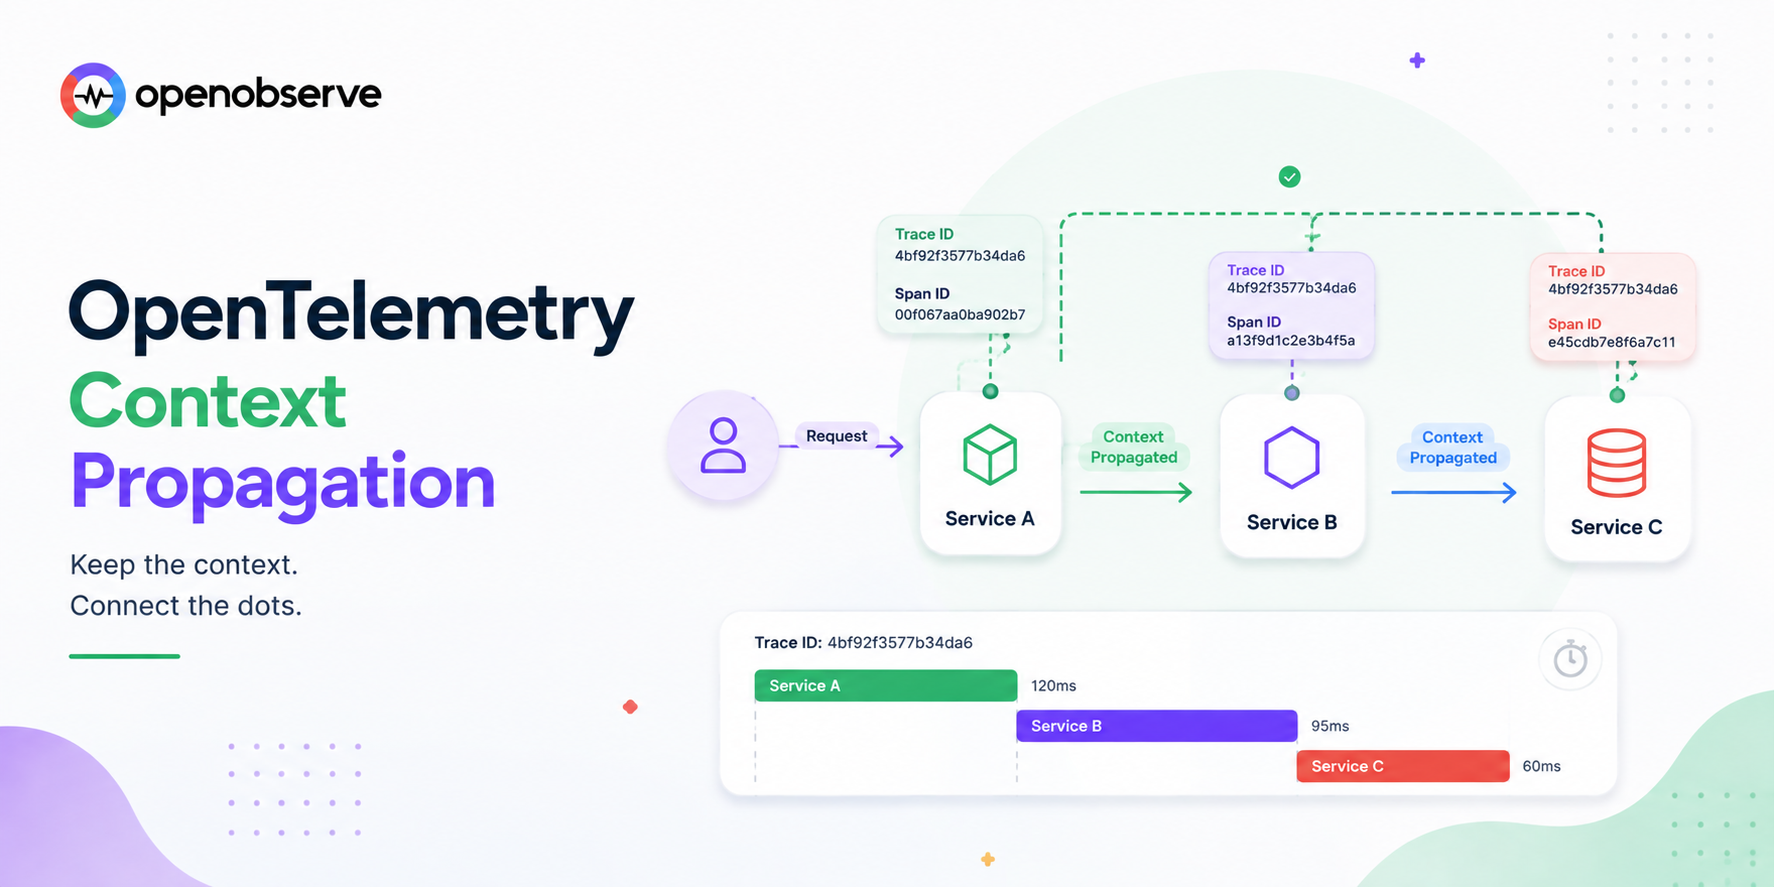
A complete OpenTelemetry overview: architecture, components, OTLP, and the Collector, plus what its 2026 CNCF graduation means.
Learn the difference between head-based and tail-based sampling in observability. Compare pros, cons, and use cases to choose the right strategy for tracing.
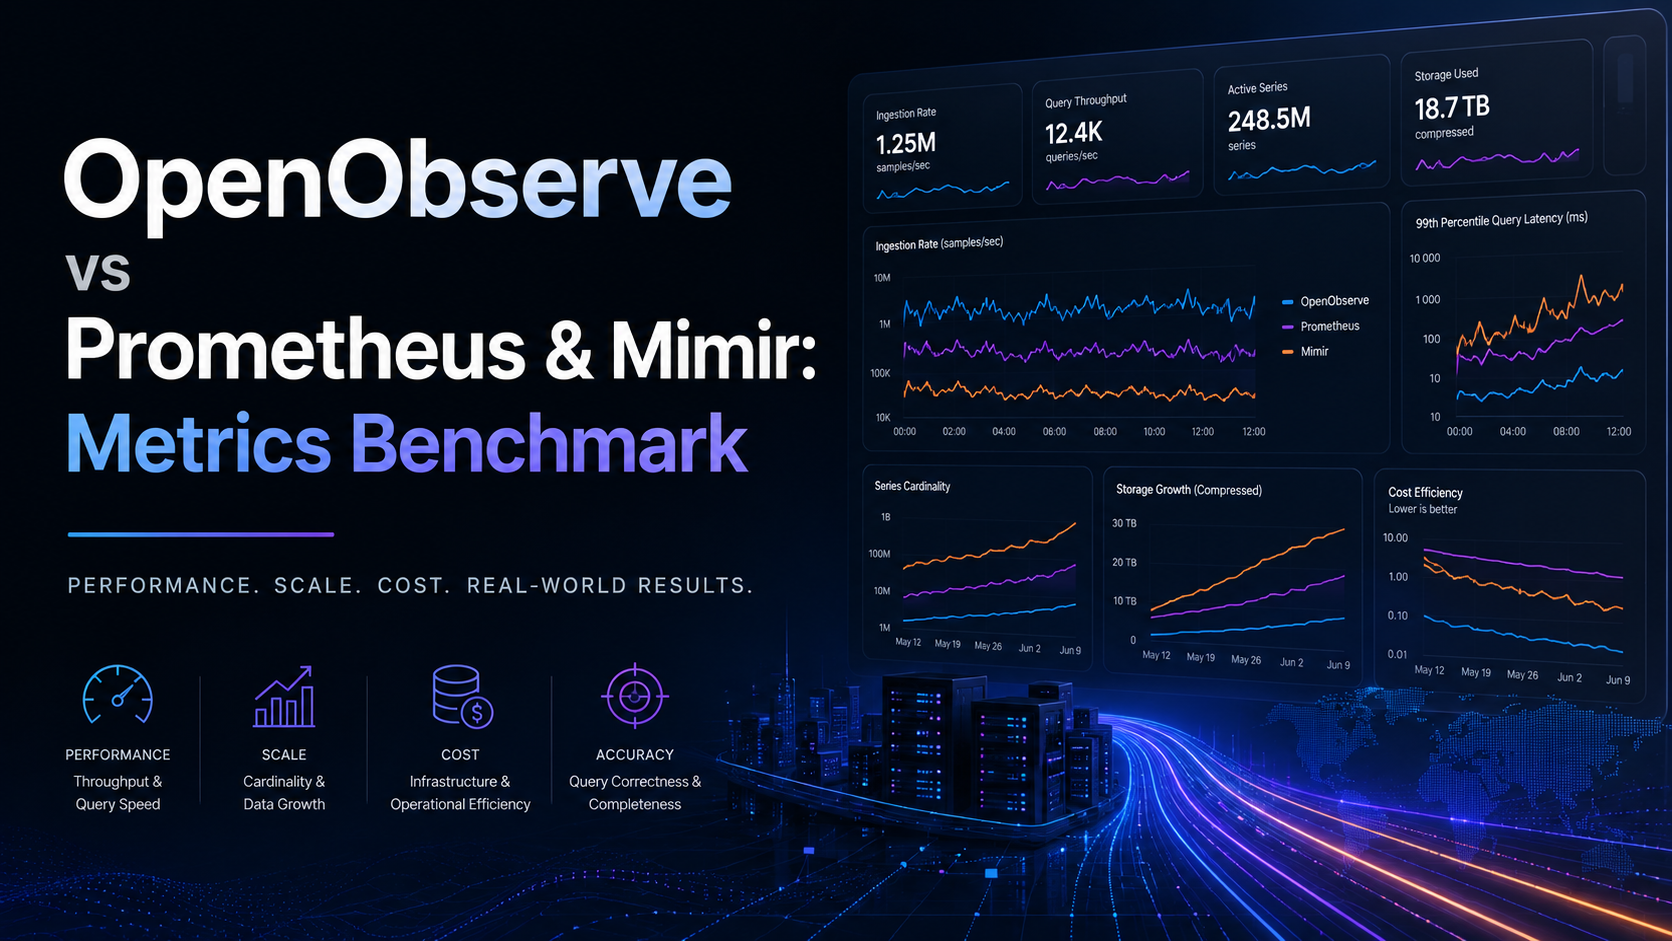
Compare the best Prometheus alternatives in 2026 for metrics at scale. See how OpenObserve, VictoriaMetrics, Thanos, Mimir, Cortex, and more handle high cardinality, long-term storage, and cost.
Add real observability to CrewAI: map Crew, Agent, and Task objects to OpenTelemetry spans, tell CrewAI's own anonymous telemetry apart from your own tracing, and send the full multi-agent trace to OpenObserve.
Helicone entered maintenance mode after Mintlify's March 2026 acquisition, with new signups closed and the roadmap frozen. Here's how to move LLM observability off Helicone's proxy and onto OpenObserve: replace the base-URL proxy with OpenTelemetry instrumentation, map Properties, Users, and Sessions to gen_ai attributes, and get infra correlation in the same backend.
You asked, we shipped: make one dashboard the org-wide landing view in OpenObserve. Pin it from the dashboard list or the dashboard header, and everyone on the team sees the same Home tab, server-side and across devices.
Trace the OpenAI Agents SDK with OpenTelemetry: map handoffs, guardrails, and agent spans to OTLP and send the full trace to OpenObserve, not OpenAI's backend.
Twelve config-level tactics for observability cost optimization, sampling, pipeline filtering, retention tiers, and cardinality control, with before/after numbers and real config examples for logs, metrics, and traces.