Getting Started with OpenObserve.
Explore latest insights and updates.
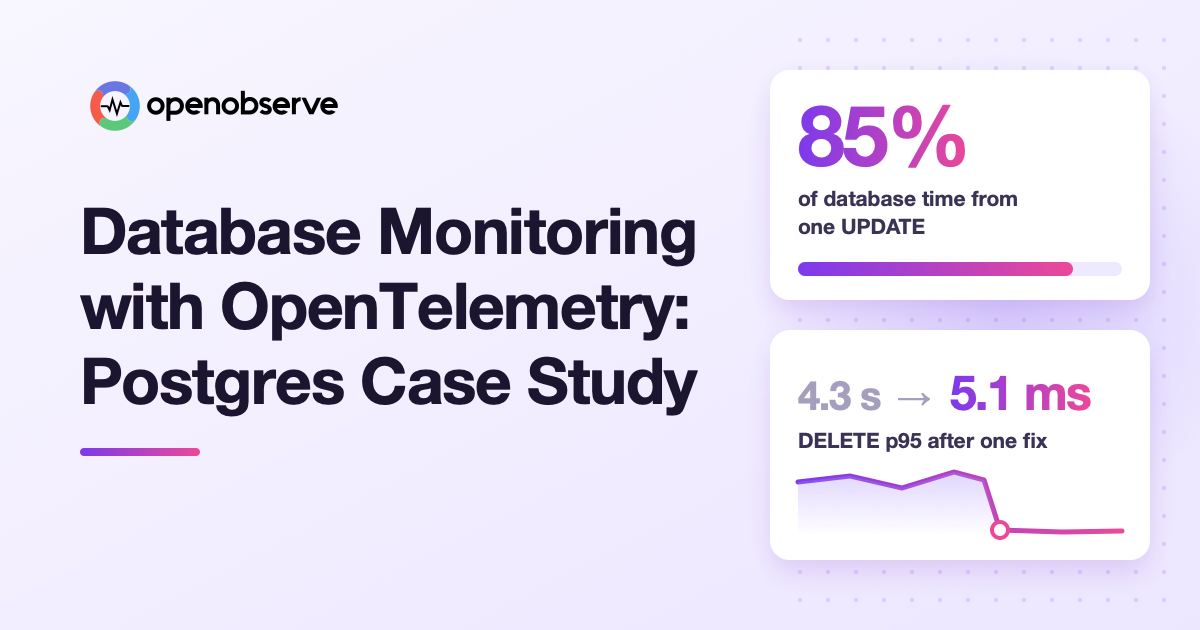
How OpenTelemetry-based database monitoring found three slow PostgreSQL queries in OpenObserve's compactor, the fixes, and how to set it up yourself.
Compare the 10 best Graylog alternatives for log management in 2026, with sourced pricing, licenses, pros, cons, and a migration path.
Learn what high cardinality means for metrics, logs, and traces, why it breaks time-series databases and budgets, and how to measure and handle it.
15 logging best practices for application logging, with Python, Node.js, Go, and Java examples for structure, levels, trace IDs, redaction, and cost.
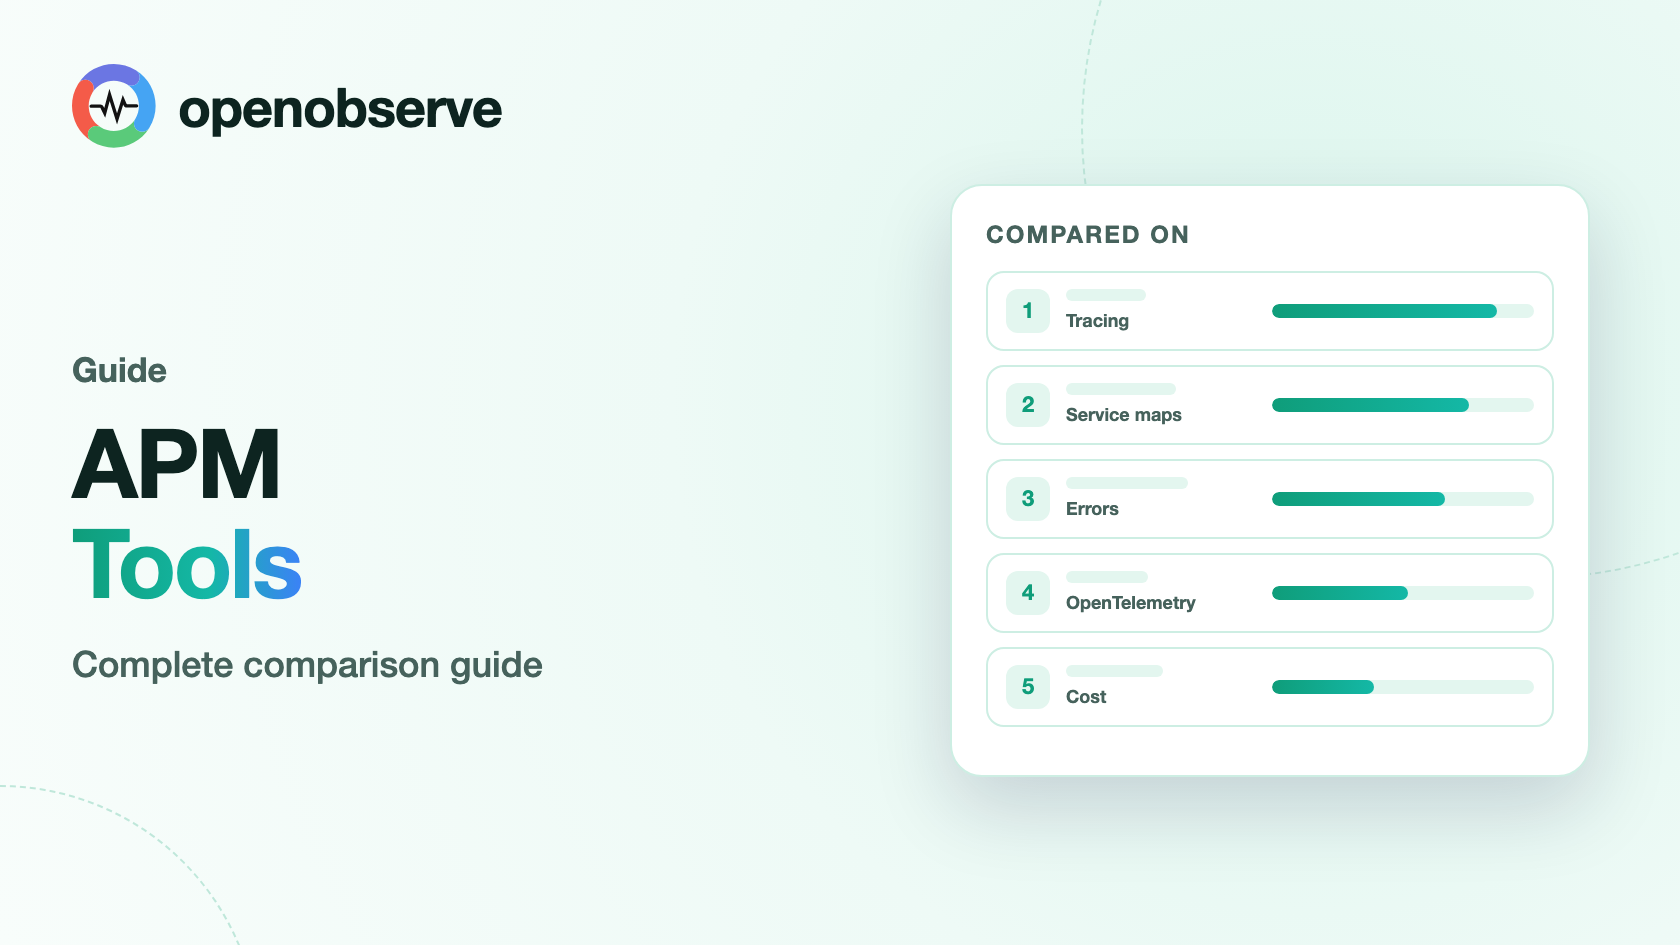
Compare the top 12 APM tools in 2026 - features, pricing, pros, cons, and use cases. OpenObserve unifies logs, metrics, traces, and APM with simple per-GB pricing.
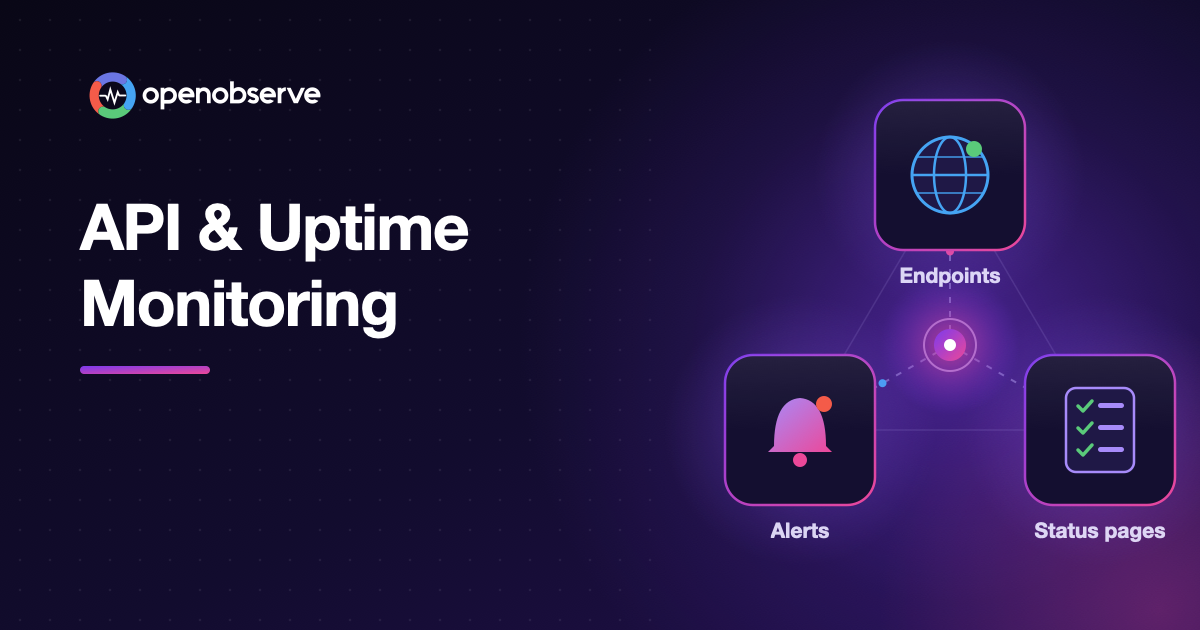
A complete guide to API and uptime monitoring: how endpoint checks work, which metrics to track, how to alert without noise, what uptime targets really allow, status pages, best practices, and how to set it all up in OpenObserve.
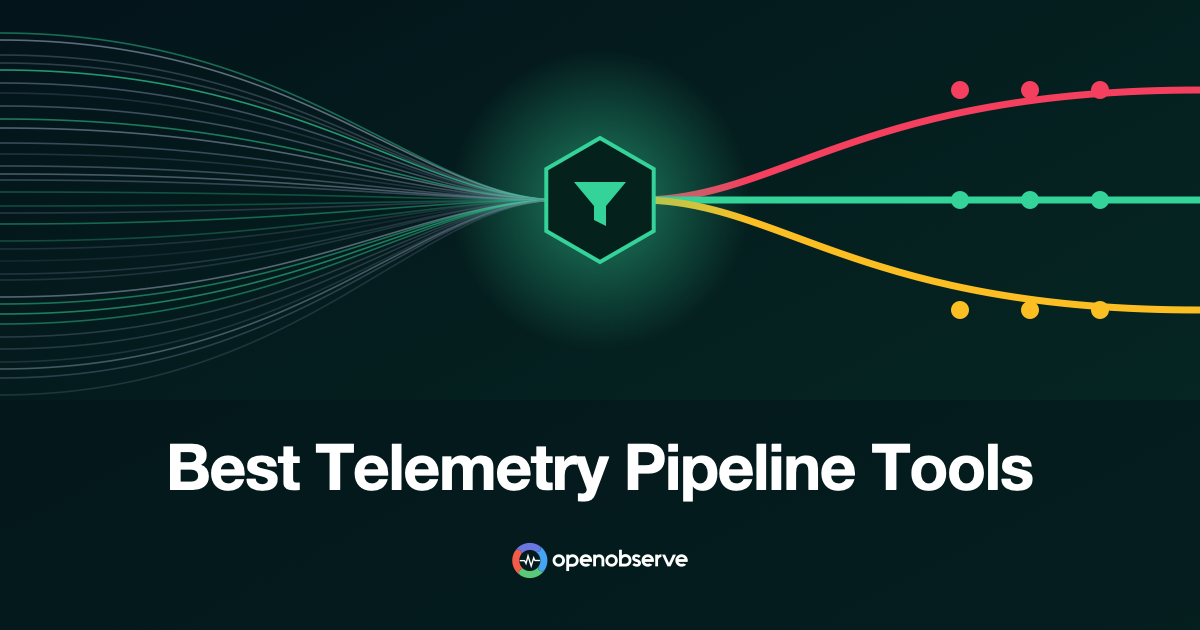
The best telemetry pipeline tools (also called observability pipeline tools) compared on routing, filtering, transformation, licensing, and cost: OpenObserve Pipelines, the OpenTelemetry Collector, Vector, Fluent Bit, Cribl Stream, and Logstash.
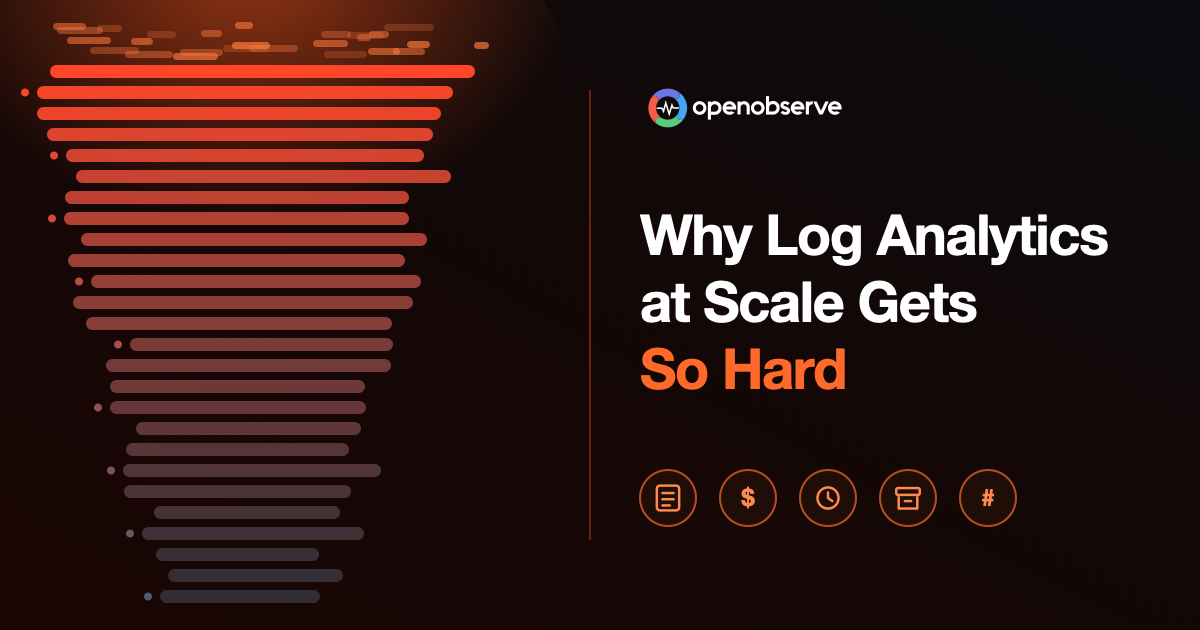
The five biggest log analytics challenges at scale: index bloat, rising storage costs, slow queries, retention trade-offs, and high cardinality. What causes each, with real numbers, and how to handle high-volume logs.
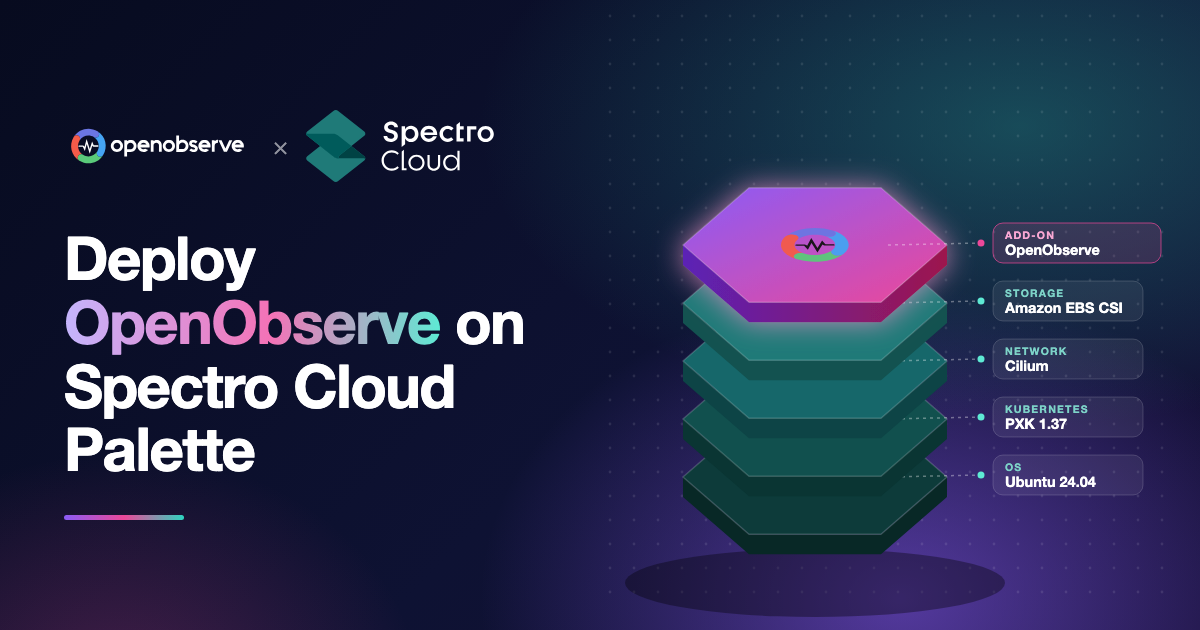
A step-by-step guide to running OpenObserve on a Spectro Cloud Palette AWS cluster: build the cluster profile, add the OpenObserve pack as an add-on, configure PostgreSQL, and open the UI.
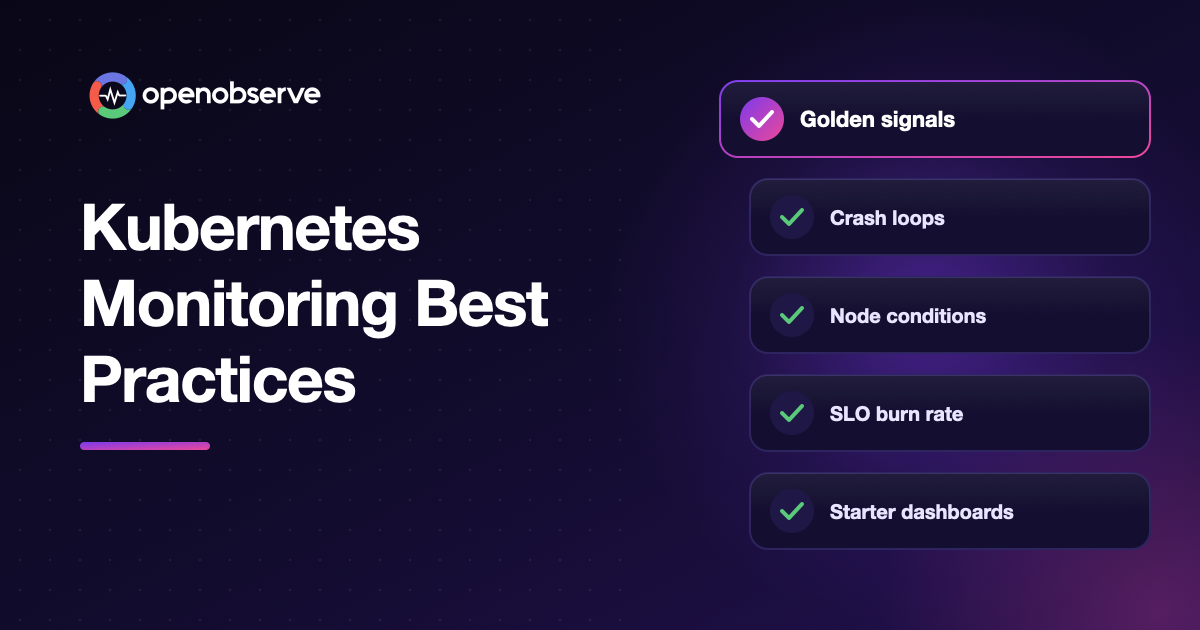
Kubernetes monitoring best practices for 2026: what to monitor in a cluster, which metrics to alert on, how to cut alert noise, the dashboards to start with, and a checklist you can work through.
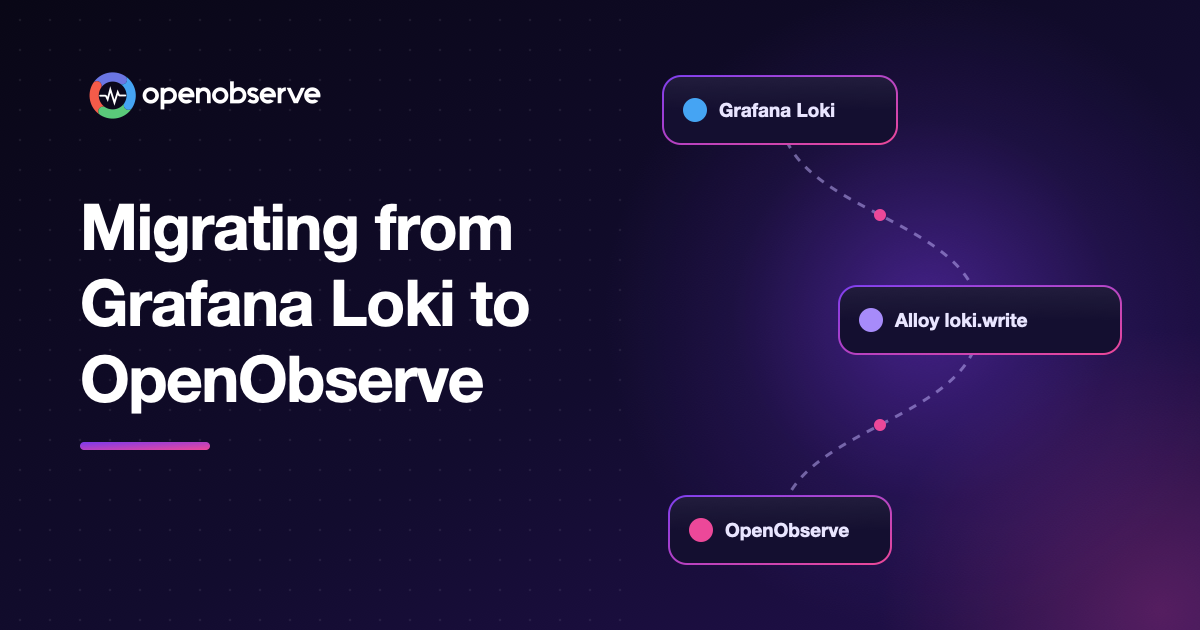
Move logs from Grafana Loki to OpenObserve: repoint Alloy, Promtail, the OpenTelemetry Collector, Fluent Bit, or Vector, run both side by side, translate LogQL to SQL, and rebuild dashboards and alerts.
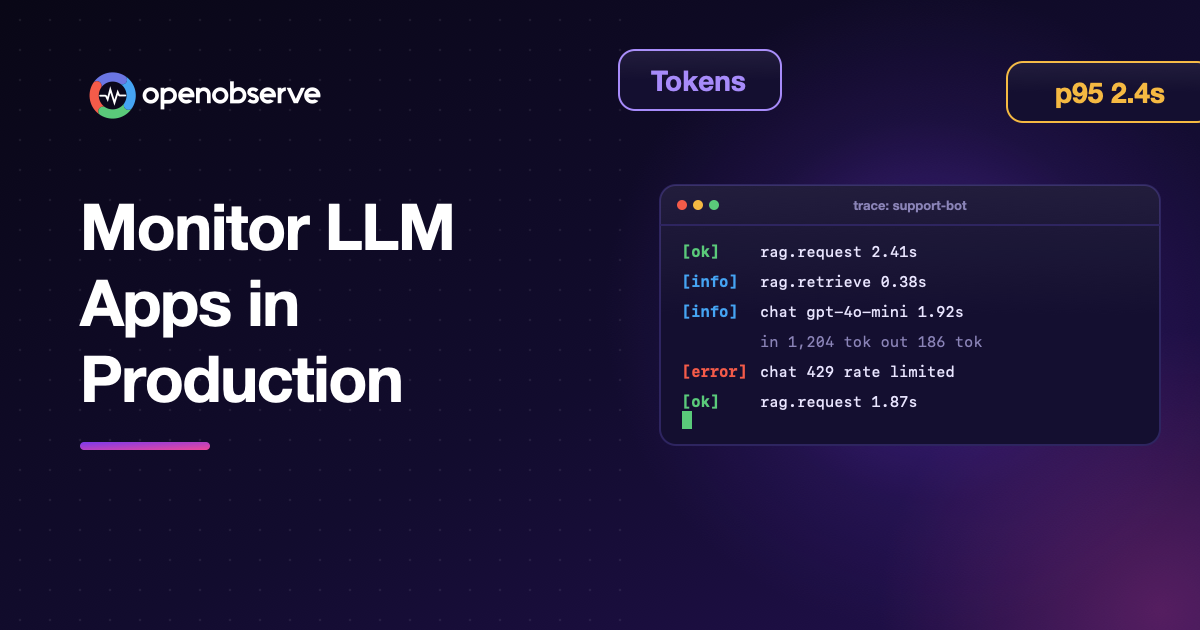
A hands-on guide to monitoring LLM applications in production with OpenTelemetry: instrument model calls, trace RAG pipelines, group conversations into sessions, alert on cost, latency, and errors, and improve quality with evaluations, prompt management, datasets, and experiments.
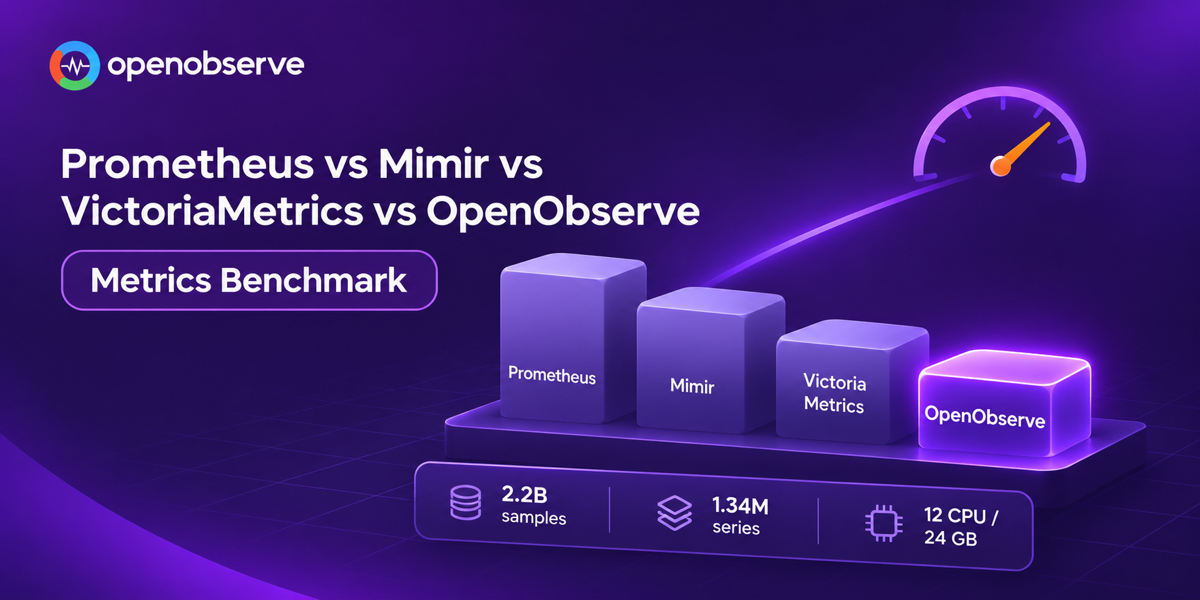
We wrote the same 2.2 billion samples and 1.34 million series into Prometheus, Grafana Mimir, VictoriaMetrics and OpenObserve v1.1.1, then ran identical PromQL over identical time windows on identical hardware. OpenObserve answered all 16 query and window combinations fastest.
A complete guide to full stack observability - covering frontend, backend, infrastructure, traces, logs, metrics, AI/LLM layers, and OpenTelemetry for DevOps and SRE teams in 2026.
Learn how to implement OpenTelemetry logging in .NET applications using OpenObserve. Step-by-step guide to configure, collect, and analyze logs.
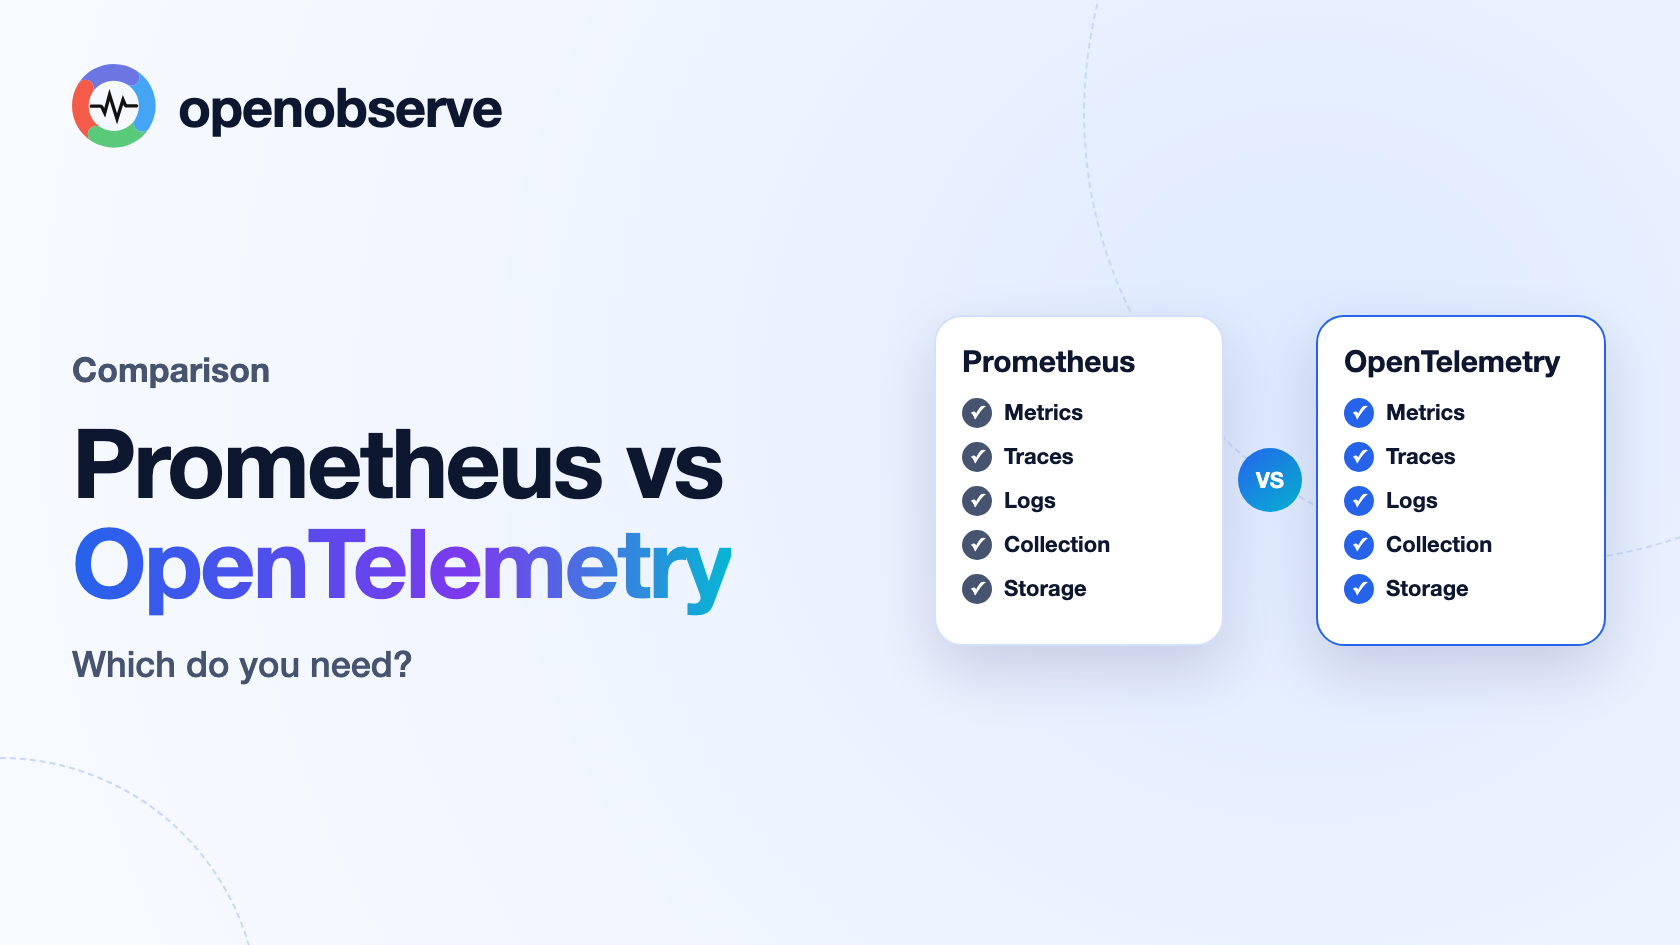
OpenTelemetry vs Prometheus: do they compete or complement? What each does, how their metric models differ, where OpenMetrics fits, how they work together, and which your team needs.
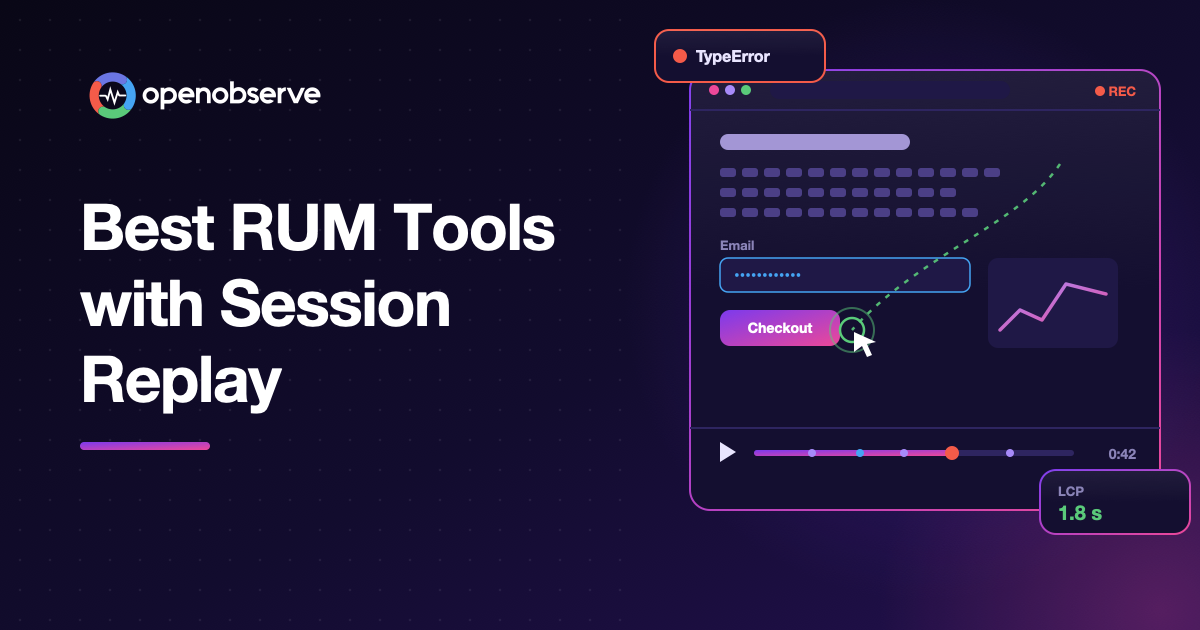
Seven RUM tools that include session replay, compared on privacy masking defaults, how they price replays, and what else they bring to frontend debugging.
What an AI SRE is, how it investigates incidents and finds root causes, how it differs from AIOps, what it can and can't do yet, and how OpenObserve's AI SRE Agent works.
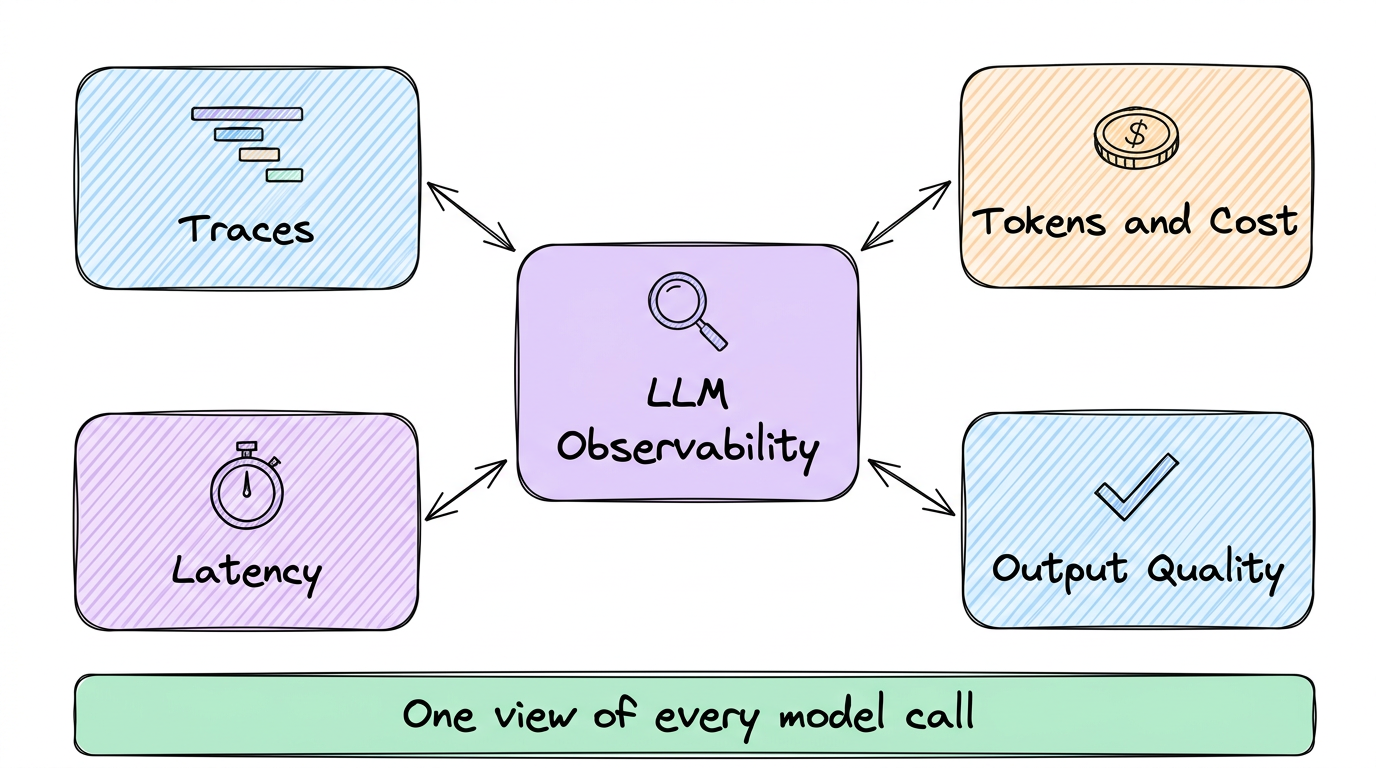
LLM observability explained for engineers: what it is, why traditional APM misses LLM failures, the three layers (computational, semantic, agentic), the core signals to track in production, and how OpenTelemetry GenAI semantic conventions standardize instrumentation.
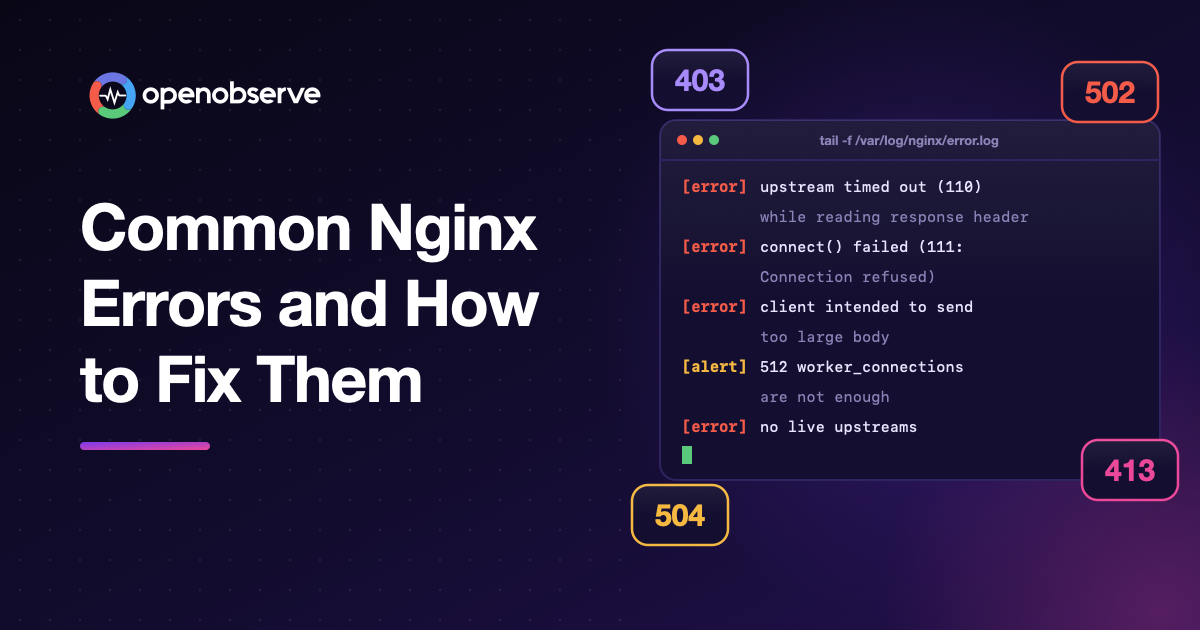
How to diagnose and fix the most common Nginx errors: 502 Bad Gateway, 504 Gateway Timeout, 413, 414 and 400 header errors, upstream buffer errors, worker connection limits, 403 and 404, with the directives and defaults from the Nginx docs.
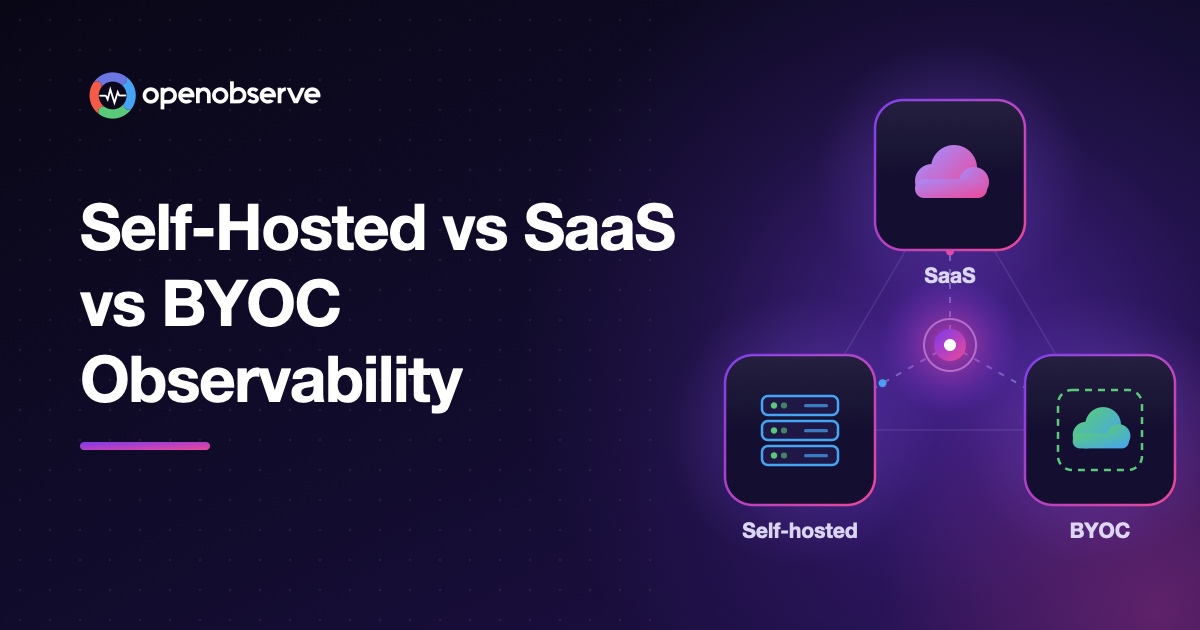
A decision framework for choosing how to run observability: what self-hosted, SaaS, and BYOC each cost at three data volumes, how much operational work each takes, and when each one wins.
AI Observability by OpenObserve.
OpenTelemetry-native observability for agents and LLMs.