

LangServe → OpenObserve
Trace every remote chain invocation when calling a LangServe-hosted API from a Python client. LangServe uses LangChain under the hood, so the LangChain instrumentor captures RemoteRunnable calls as workflow spans and records end-to-end latency for each remote invocation.
Prerequisites
- Python 3.8+
- A running LangServe server (see the server setup below)
- An OpenObserve account (cloud or self-hosted)
- Your OpenObserve organisation ID and Base64-encoded auth token
Installation
pip install openobserve-telemetry-sdk opentelemetry-instrumentation-langchain langserve python-dotenv
Configuration
Create a .env file in your project root:
OPENOBSERVE_URL=https://api.openobserve.ai/
OPENOBSERVE_ORG=your_org_id
OPENOBSERVE_AUTH_TOKEN=Basic <your_base64_token>
LANGSERVE_URL=http://localhost:8000
Server setup
Start a minimal LangServe server before running the instrumented client. Install the server dependencies separately:
from fastapi import FastAPI
from langchain_openai import ChatOpenAI
from langchain_core.output_parsers import StrOutputParser
from langchain_core.prompts import ChatPromptTemplate
from langserve import add_routes

app = FastAPI()
llm = ChatOpenAI(model="gpt-4o-mini")
prompt = ChatPromptTemplate.from_template("Answer in one sentence: {input}")
chain = prompt | llm | StrOutputParser()
add_routes(app, chain, path="/chain")

if __name__ == "__main__":
    import uvicorn
    uvicorn.run(app, host="0.0.0.0", port=8000)
Instrumentation
Call LangchainInstrumentor().instrument() before importing or instantiating RemoteRunnable.
from dotenv import load_dotenv
load_dotenv()

from opentelemetry.instrumentation.langchain import LangchainInstrumentor
from openobserve import openobserve_init

LangchainInstrumentor().instrument()
openobserve_init()

import os
from langserve import RemoteRunnable

chain = RemoteRunnable(f"{os.environ.get('LANGSERVE_URL', 'http://localhost:8000')}/chain/")

result = chain.invoke({"input": "What is OpenTelemetry?"})
print(result)
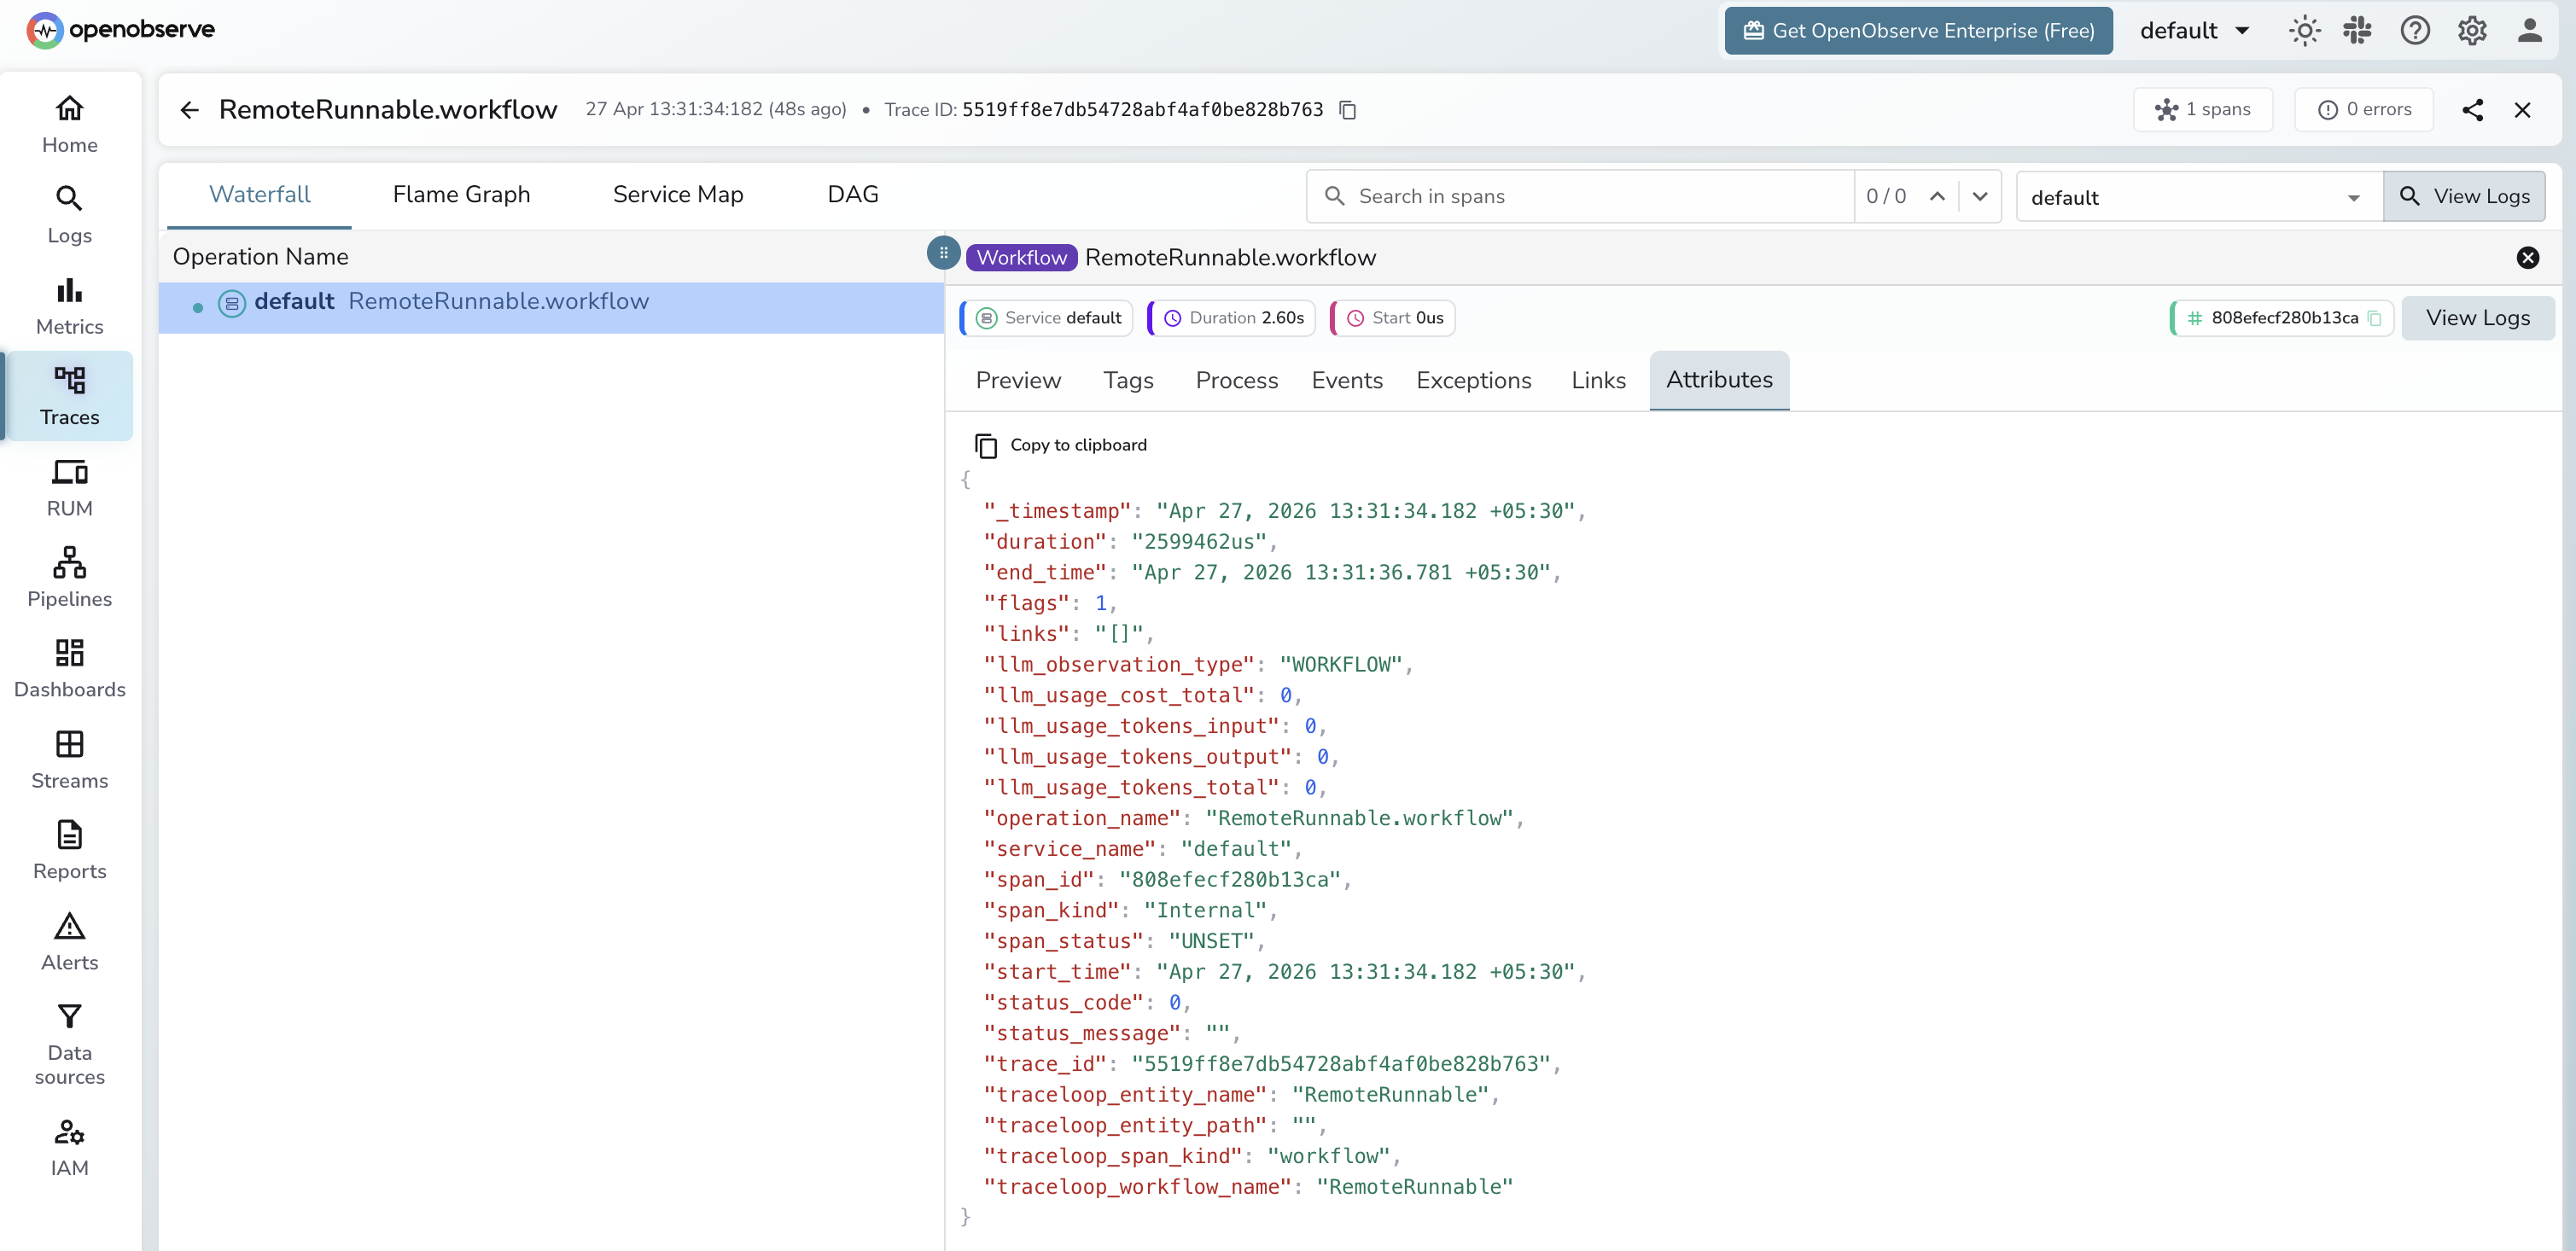
What Gets Captured
| Attribute | Description |
|---|---|
operation_name |
RemoteRunnable.workflow |
llm_observation_type |
WORKFLOW |
traceloop_entity_name |
RemoteRunnable |
traceloop_workflow_name |
RemoteRunnable |
traceloop_span_kind |
workflow |
span_kind |
Internal |
span_status |
UNSET on success, ERROR on failure |
duration |
End-to-end latency for the remote chain call |
Token counts are not available on the client side because the LLM call happens inside the server. To capture token usage, instrument the server with the same LangchainInstrumentor and point it at OpenObserve.
Viewing Traces
- Log in to OpenObserve and navigate to Traces
- Spans appear with
operation_name: RemoteRunnable.workflow - Use
durationto monitor remote chain latency end-to-end - Error spans from invalid endpoints appear with
span_status: ERROR
Next Steps
With LangServe instrumented, every remote chain call is recorded in OpenObserve. From here you can monitor API latency per endpoint and alert on error rates.