

LangGraph → OpenObserve
Automatically trace every graph execution, node transition, and LLM call in your LangGraph application. LangGraph builds on LangChain, so the same LangChain instrumentor captures the full graph execution.
Prerequisites
- Python 3.8+
- An OpenObserve account (cloud or self-hosted)
- Your OpenObserve organisation ID and Base64-encoded auth token
- An OpenAI API key (or whichever model backend your graph uses)
Installation
pip install openobserve-telemetry-sdk opentelemetry-instrumentation-langchain langchain-openai langgraph python-dotenv
Configuration
Create a .env file in your project root:
OPENOBSERVE_URL=https://api.openobserve.ai/
OPENOBSERVE_ORG=your_org_id
OPENOBSERVE_AUTH_TOKEN=Basic <your_base64_token>
OPENAI_API_KEY=your-openai-api-key
Instrumentation
Call LangchainInstrumentor().instrument() before importing LangGraph or LangChain modules.
from dotenv import load_dotenv
load_dotenv()

from opentelemetry.instrumentation.langchain import LangchainInstrumentor
from openobserve import openobserve_init

LangchainInstrumentor().instrument()
openobserve_init()

from typing import TypedDict
from langchain_openai import ChatOpenAI
from langgraph.graph import StateGraph, END

llm = ChatOpenAI(model="gpt-4o-mini")


class State(TypedDict):
    question: str
    answer: str


def answer_node(state: State):
    response = llm.invoke([{"role": "user", "content": state["question"]}])
    return {"answer": response.content}


graph = StateGraph(State)
graph.add_node("answer", answer_node)
graph.set_entry_point("answer")
graph.add_edge("answer", END)
app = graph.compile()

result = app.invoke({"question": "What is OpenTelemetry?", "answer": ""})
print(result["answer"])
Multi-node graph
def summarise_node(state: State):
    response = llm.invoke([
        {"role": "user", "content": f"Summarise in five words: {state['answer']}"}
    ])
    return {"answer": response.content}

graph = StateGraph(State)
graph.add_node("answer", answer_node)
graph.add_node("summarise", summarise_node)
graph.set_entry_point("answer")
graph.add_edge("answer", "summarise")
graph.add_edge("summarise", END)
app = graph.compile()

result = app.invoke({"question": "What is distributed tracing?", "answer": ""})
print(result["answer"])
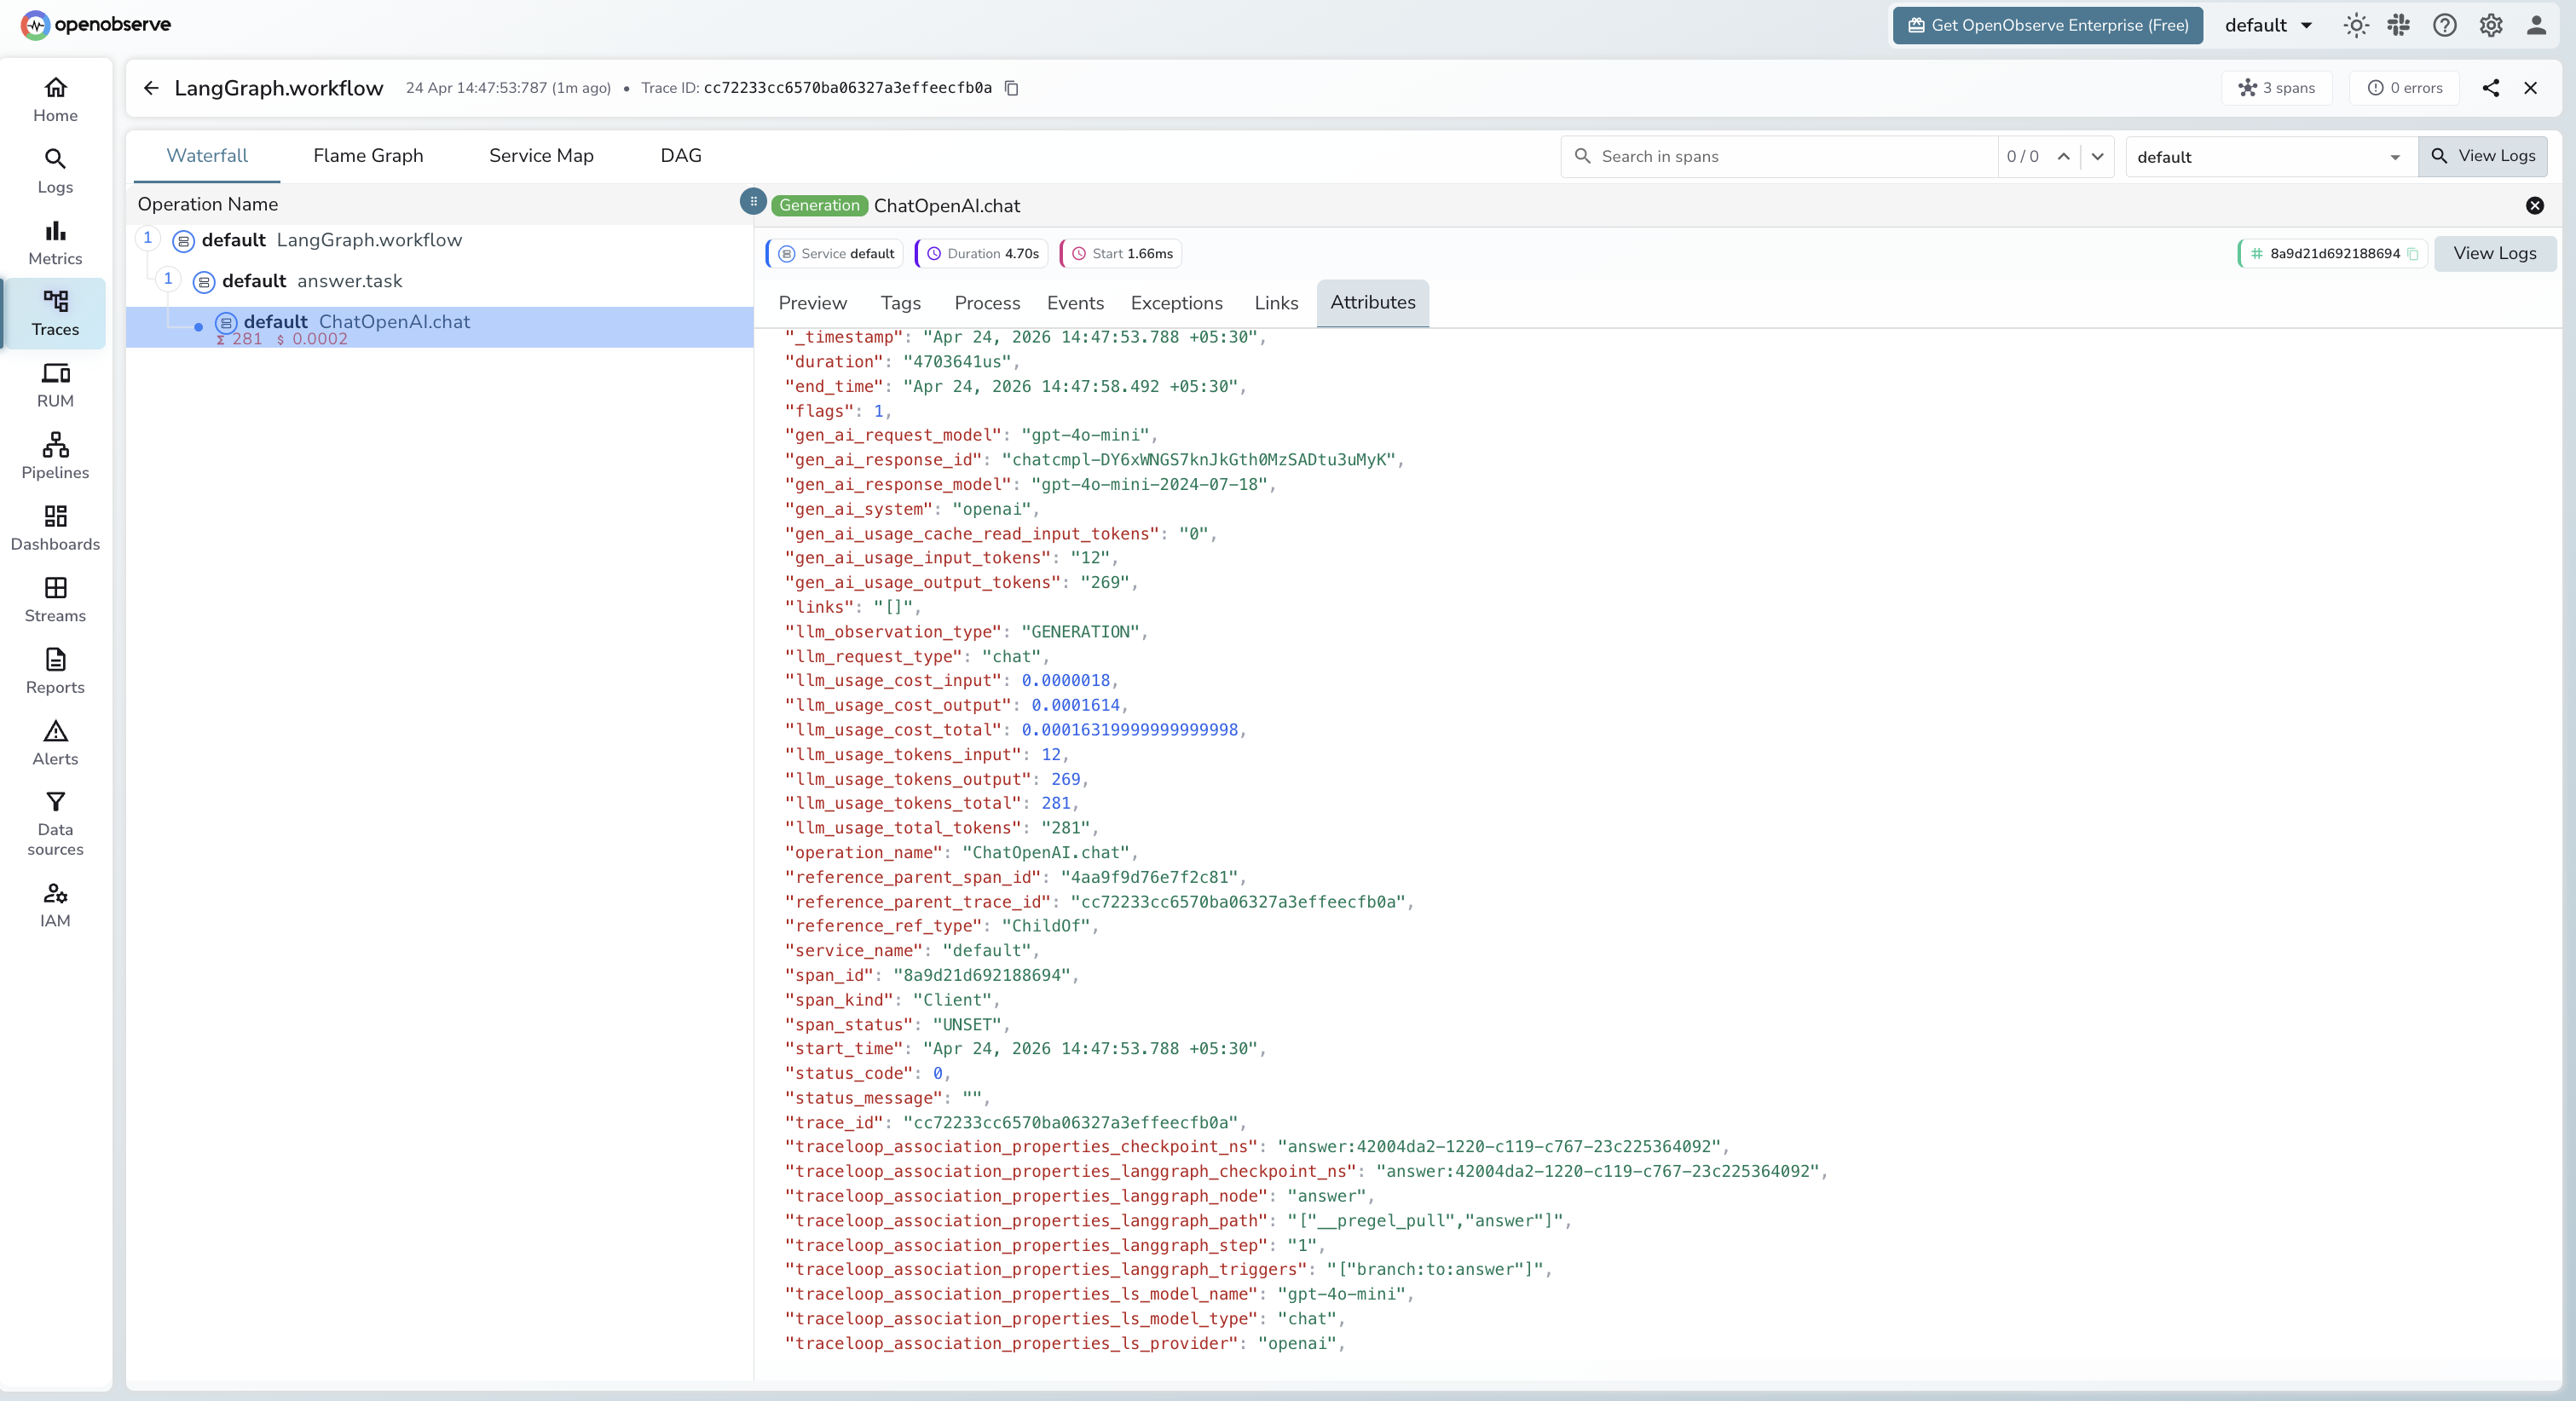
What Gets Captured
Each app.invoke() call produces a root span with child spans per node and LLM call. LangGraph adds graph-specific context via traceloop_association_properties_langgraph_* attributes.
| Attribute | Description |
|---|---|
operation_name |
ChatOpenAI.chat for LLM spans |
traceloop_workflow_name |
LangGraph |
traceloop_entity_path |
Graph node that made the call (e.g. answer) |
traceloop_association_properties_langgraph_node |
Node name |
traceloop_association_properties_langgraph_step |
Execution step number |
traceloop_association_properties_langgraph_triggers |
Node triggers for this step |
traceloop_association_properties_ls_model_name |
Model alias (e.g. gpt-4o-mini) |
traceloop_association_properties_ls_provider |
openai |
gen_ai_request_model |
Model name requested |
gen_ai_response_model |
Resolved model version (e.g. gpt-4o-mini-2024-07-18) |
gen_ai_system |
openai |
gen_ai_usage_input_tokens |
Input token count |
gen_ai_usage_output_tokens |
Output token count |
llm_usage_tokens_input |
Input tokens (numeric) |
llm_usage_tokens_output |
Output tokens (numeric) |
llm_usage_cost_input |
Estimated input cost in USD |
llm_usage_cost_output |
Estimated output cost in USD |
llm_request_type |
chat |
duration |
Span latency |
span_status |
UNSET on success, ERROR on failure |
Viewing Traces
- Log in to OpenObserve and navigate to Traces in the left sidebar
- Filter by
traceloop_workflow_name = LangGraphto find graph execution traces - Click any root span to open the waterfall view and see per-node spans
- Check
traceloop_association_properties_langgraph_nodeto identify which graph node each LLM call belongs to
Next Steps
With LangGraph instrumented, every graph execution is recorded in OpenObserve with a full span hierarchy. From here you can visualise node execution order, measure per-node latency, and track token usage across complex multi-step pipelines.