

LiveKit → OpenObserve
Capture LLM call latency, token usage, input messages, and output content for every LiveKit Agents LLM call. LiveKit Agents is a Python framework for building real-time voice AI agents. Its LLM components can be used standalone without a LiveKit server. Register a TracerProvider with telemetry.set_tracer_provider() and every LLM call is automatically traced as nested llm_request and llm_request_run spans, plus your own manual root spans.
Prerequisites
- Python 3.10+
- An OpenObserve account (cloud or self-hosted)
- Your OpenObserve organisation ID and Base64-encoded auth token
- An OpenAI API key
Installation
pip install "livekit-agents[openai]" opentelemetry-exporter-otlp-proto-http \
  opentelemetry-sdk python-dotenv
Configuration
Create a .env file in your project root:
OPENAI_API_KEY=your-openai-api-key
OTEL_EXPORTER_OTLP_ENDPOINT=https://api.openobserve.ai/api/your_org_id/v1/traces
OTEL_EXPORTER_OTLP_HEADERS=Authorization=Basic <your_base64_token>
Instrumentation
Build a TracerProvider with an OTLP exporter and pass it to telemetry.set_tracer_provider() before making any LLM calls. The LiveKit SDK then attaches its own spans as children of any active span.
from dotenv import load_dotenv
load_dotenv()

import asyncio
import os
from opentelemetry.sdk.trace import TracerProvider
from opentelemetry.sdk.trace.export import BatchSpanProcessor
from opentelemetry.exporter.otlp.proto.http.trace_exporter import OTLPSpanExporter
from opentelemetry.sdk.resources import Resource
from opentelemetry import trace as trace_api

auth_header = os.environ["OTEL_EXPORTER_OTLP_HEADERS"].replace("Authorization=", "")

provider = TracerProvider(resource=Resource.create({"service.name": "my-app"}))
provider.add_span_processor(
    BatchSpanProcessor(
        OTLPSpanExporter(
            endpoint=os.environ["OTEL_EXPORTER_OTLP_ENDPOINT"],
            headers={"Authorization": auth_header},
        )
    )
)
trace_api.set_tracer_provider(provider)

from livekit.agents import telemetry, llm
from livekit.plugins import openai as lk_openai

telemetry.set_tracer_provider(provider)
tracer = trace_api.get_tracer(__name__)

model = lk_openai.LLM(model="gpt-4o-mini")


async def main():
    with tracer.start_as_current_span("livekit.llm_call") as span:
        span.set_attribute("livekit.question", "What is distributed tracing?")
        ctx = llm.ChatContext()
        ctx.add_message(role="user", content="What is distributed tracing?")
        stream = model.chat(chat_ctx=ctx)
        collected = await stream.collect()
        usage = collected.usage
        span.set_attribute("livekit.input_tokens", usage.prompt_tokens if usage else 0)
        span.set_attribute("livekit.output_tokens", usage.completion_tokens if usage else 0)
        span.set_attribute("livekit.answer_preview", (collected.text or "")[:80])
        span.set_attribute("span_status", "OK")
        print(collected.text)

    provider.force_flush()


asyncio.run(main())
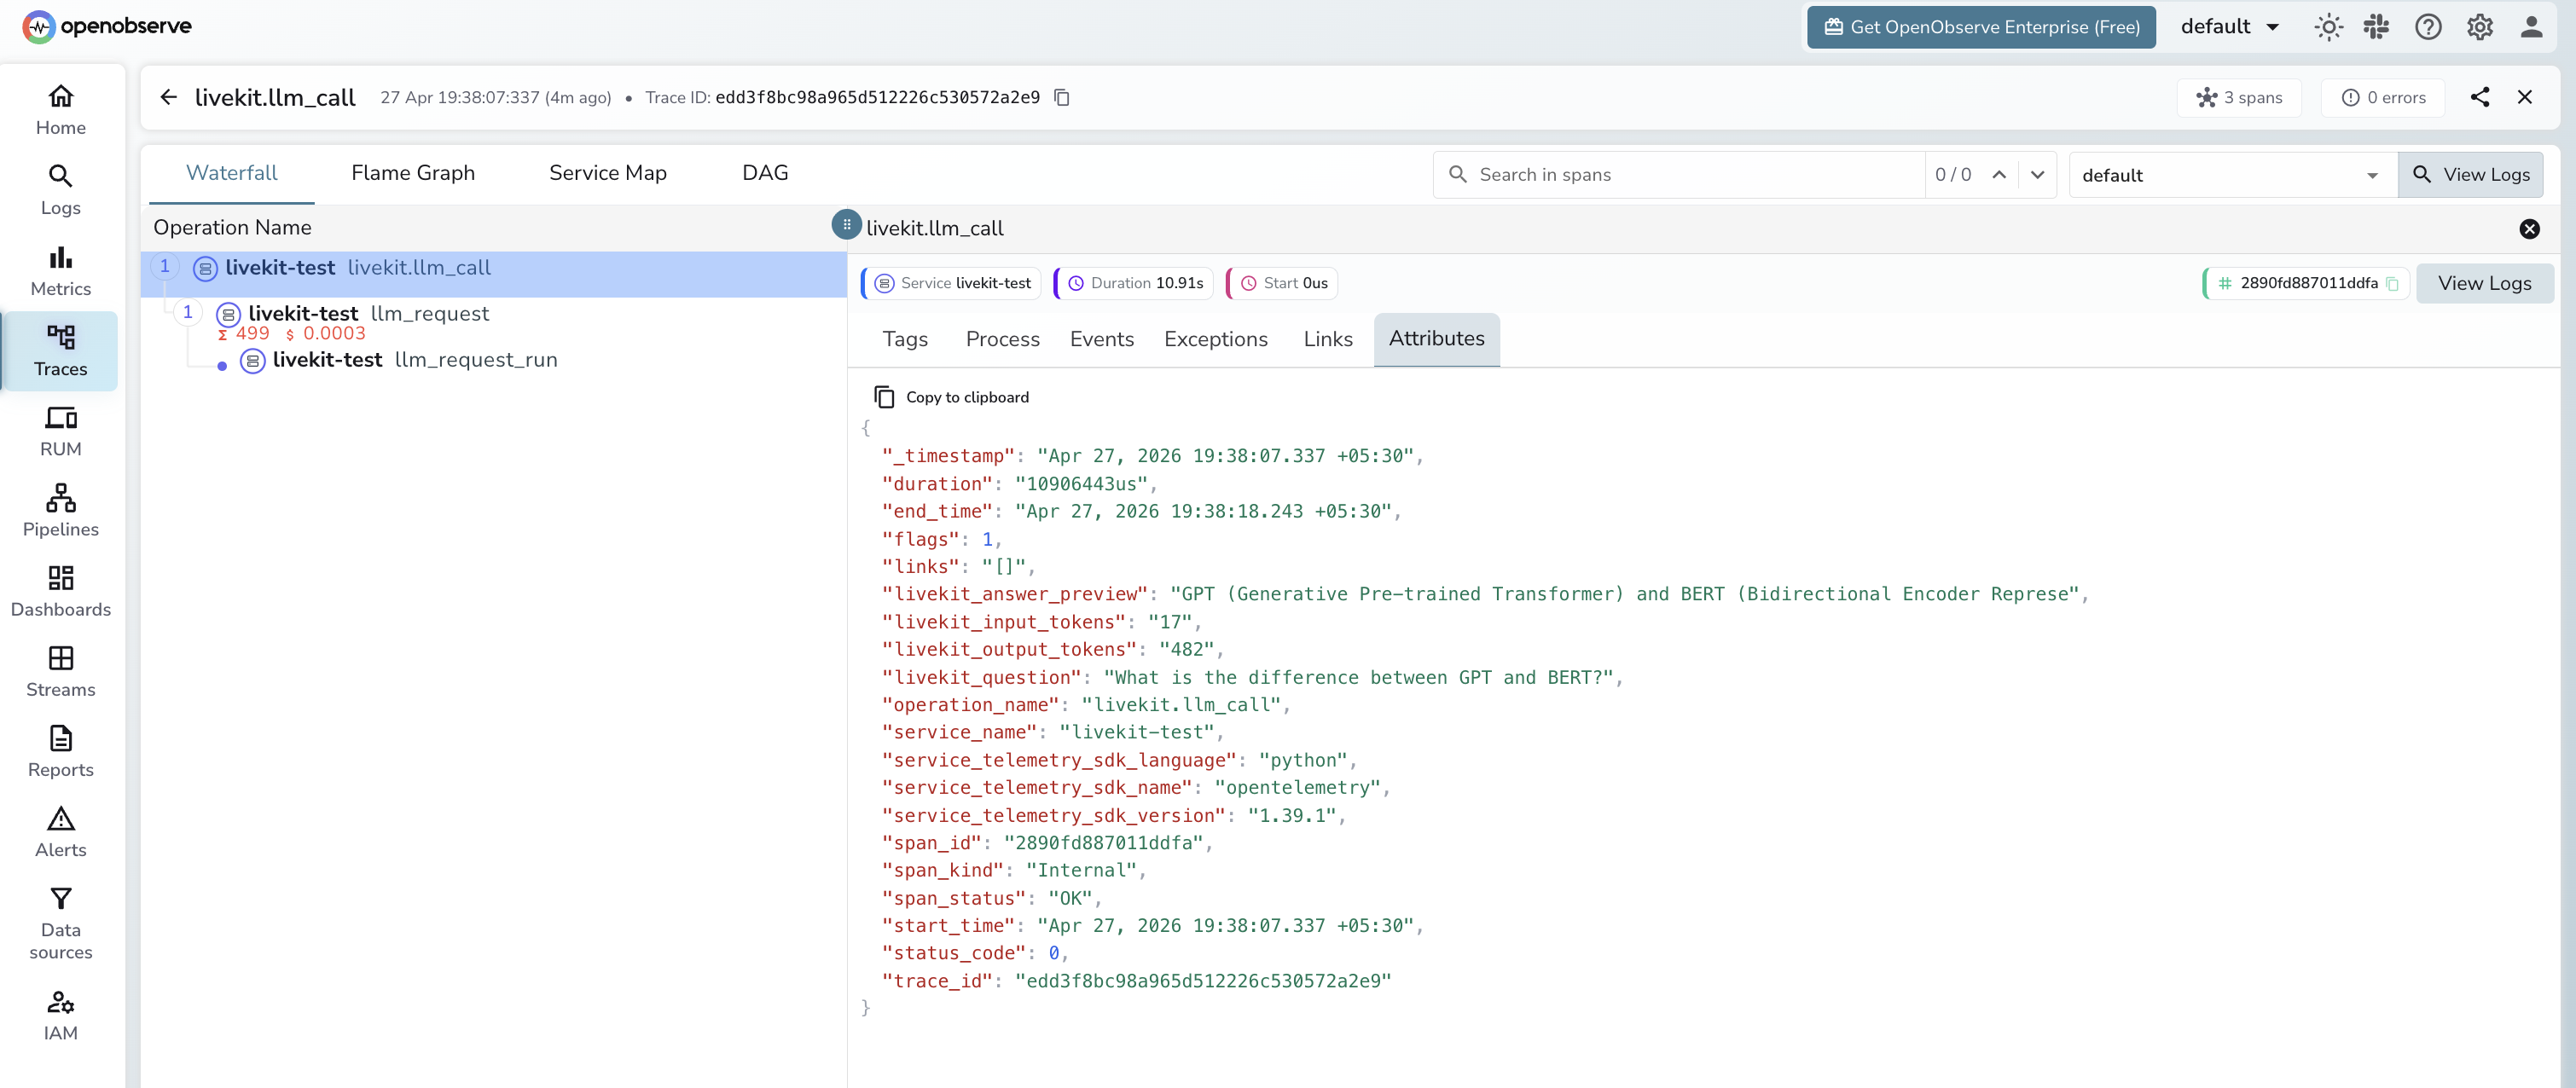
What Gets Captured
Each LLM call produces a manual livekit.llm_call root span with nested spans from the LiveKit SDK.
livekit.llm_call span (manual root)
| Attribute | Description |
|---|---|
livekit_question |
User prompt passed to the LLM |
livekit_input_tokens |
Prompt tokens for the call |
livekit_output_tokens |
Completion tokens generated |
livekit_answer_preview |
First 80 characters of the response |
span_status |
OK or ERROR |
duration |
End-to-end call latency |
llm_request span (auto-instrumented child)
| Attribute | Description |
|---|---|
gen_ai_request_model |
Model requested (e.g. gpt-4o-mini) |
gen_ai_response_model |
Model that served the response |
gen_ai_system |
Provider system (e.g. api.openai.com) |
gen_ai_usage_input_tokens |
Input tokens (numeric) |
gen_ai_usage_output_tokens |
Output tokens (numeric) |
llm_input |
Full input messages as JSON |
llm_output_content |
Full response text |
Viewing Traces
- Log in to OpenObserve and navigate to Traces
- Filter by
service_name = livekit-testto isolate LiveKit spans - Filter by
operation_name = livekit.llm_callto see the root span for each call - Expand a trace to see the nested
llm_requestandllm_request_runspans - Filter by
span_status = ERRORto find failed calls
Next Steps
With LiveKit Agents instrumented, every LLM call is recorded in OpenObserve. From here you can monitor turn latency, track token usage per session, and alert on high-latency or failed calls.