

Flowise → OpenObserve
Trace every prediction request made to a Flowise chatflow by wrapping the REST API calls in manual OpenTelemetry spans. Flowise is an open-source drag-and-drop LLM flow builder. This integration instruments a Python client that calls the Flowise prediction API and exports spans to OpenObserve.
Prerequisites
- Docker installed
- An OpenObserve account (cloud or self-hosted)
- Your OpenObserve organisation ID and Base64-encoded auth token
- OpenAI API key (or another provider supported by Flowise)
Installation
Configuration
Start Flowise via Docker, passing your OpenObserve endpoint as the OTLP export target:
docker run -d \
  --name flowise \
  -p 3000:3000 \
  -e OTEL_EXPORTER_OTLP_ENDPOINT=http://host.docker.internal:5080/api/default/v1/traces \
  "-e OTEL_EXPORTER_OTLP_HEADERS=Authorization=Basic <your_base64_token>" \
  -e OTEL_SERVICE_NAME=flowise \
  flowiseai/flowise
Replace host.docker.internal with your OpenObserve host if it is not running on the same machine.
Once Flowise is running, open http://localhost:3000, build a chatflow, and copy the chatflow ID from the canvas URL.
Set the following in your .env file:
OPENOBSERVE_URL=http://localhost:5080/
OPENOBSERVE_ORG=default
OPENOBSERVE_AUTH_TOKEN=Basic <your_base64_token>
FLOWISE_BASE_URL=http://localhost:3000
FLOWISE_CHATFLOW_ID=<your_chatflow_id>
Instrumentation
Wrap each prediction call in a manual span using the OpenTelemetry tracer:
from dotenv import load_dotenv
load_dotenv()

from openobserve import openobserve_init
openobserve_init()

from opentelemetry import trace
import os
import requests

tracer = trace.get_tracer(__name__)

base_url = os.environ["FLOWISE_BASE_URL"]
chatflow_id = os.environ["FLOWISE_CHATFLOW_ID"]

with tracer.start_as_current_span("flowise.chatflow_predict") as span:
    span.set_attribute("flowise_chatflow_id", chatflow_id)
    span.set_attribute("flowise_question", "Explain distributed tracing in one sentence.")
    resp = requests.post(
        f"{base_url}/api/v1/prediction/{chatflow_id}",
        headers={"Content-Type": "application/json"},
        json={"question": "Explain distributed tracing in one sentence."},
        timeout=30,
    )
    resp.raise_for_status()
    text = resp.json().get("text", "")
    span.set_attribute("flowise_answer_length", len(text))
    span.set_attribute("span_status", "OK")
    print(text)
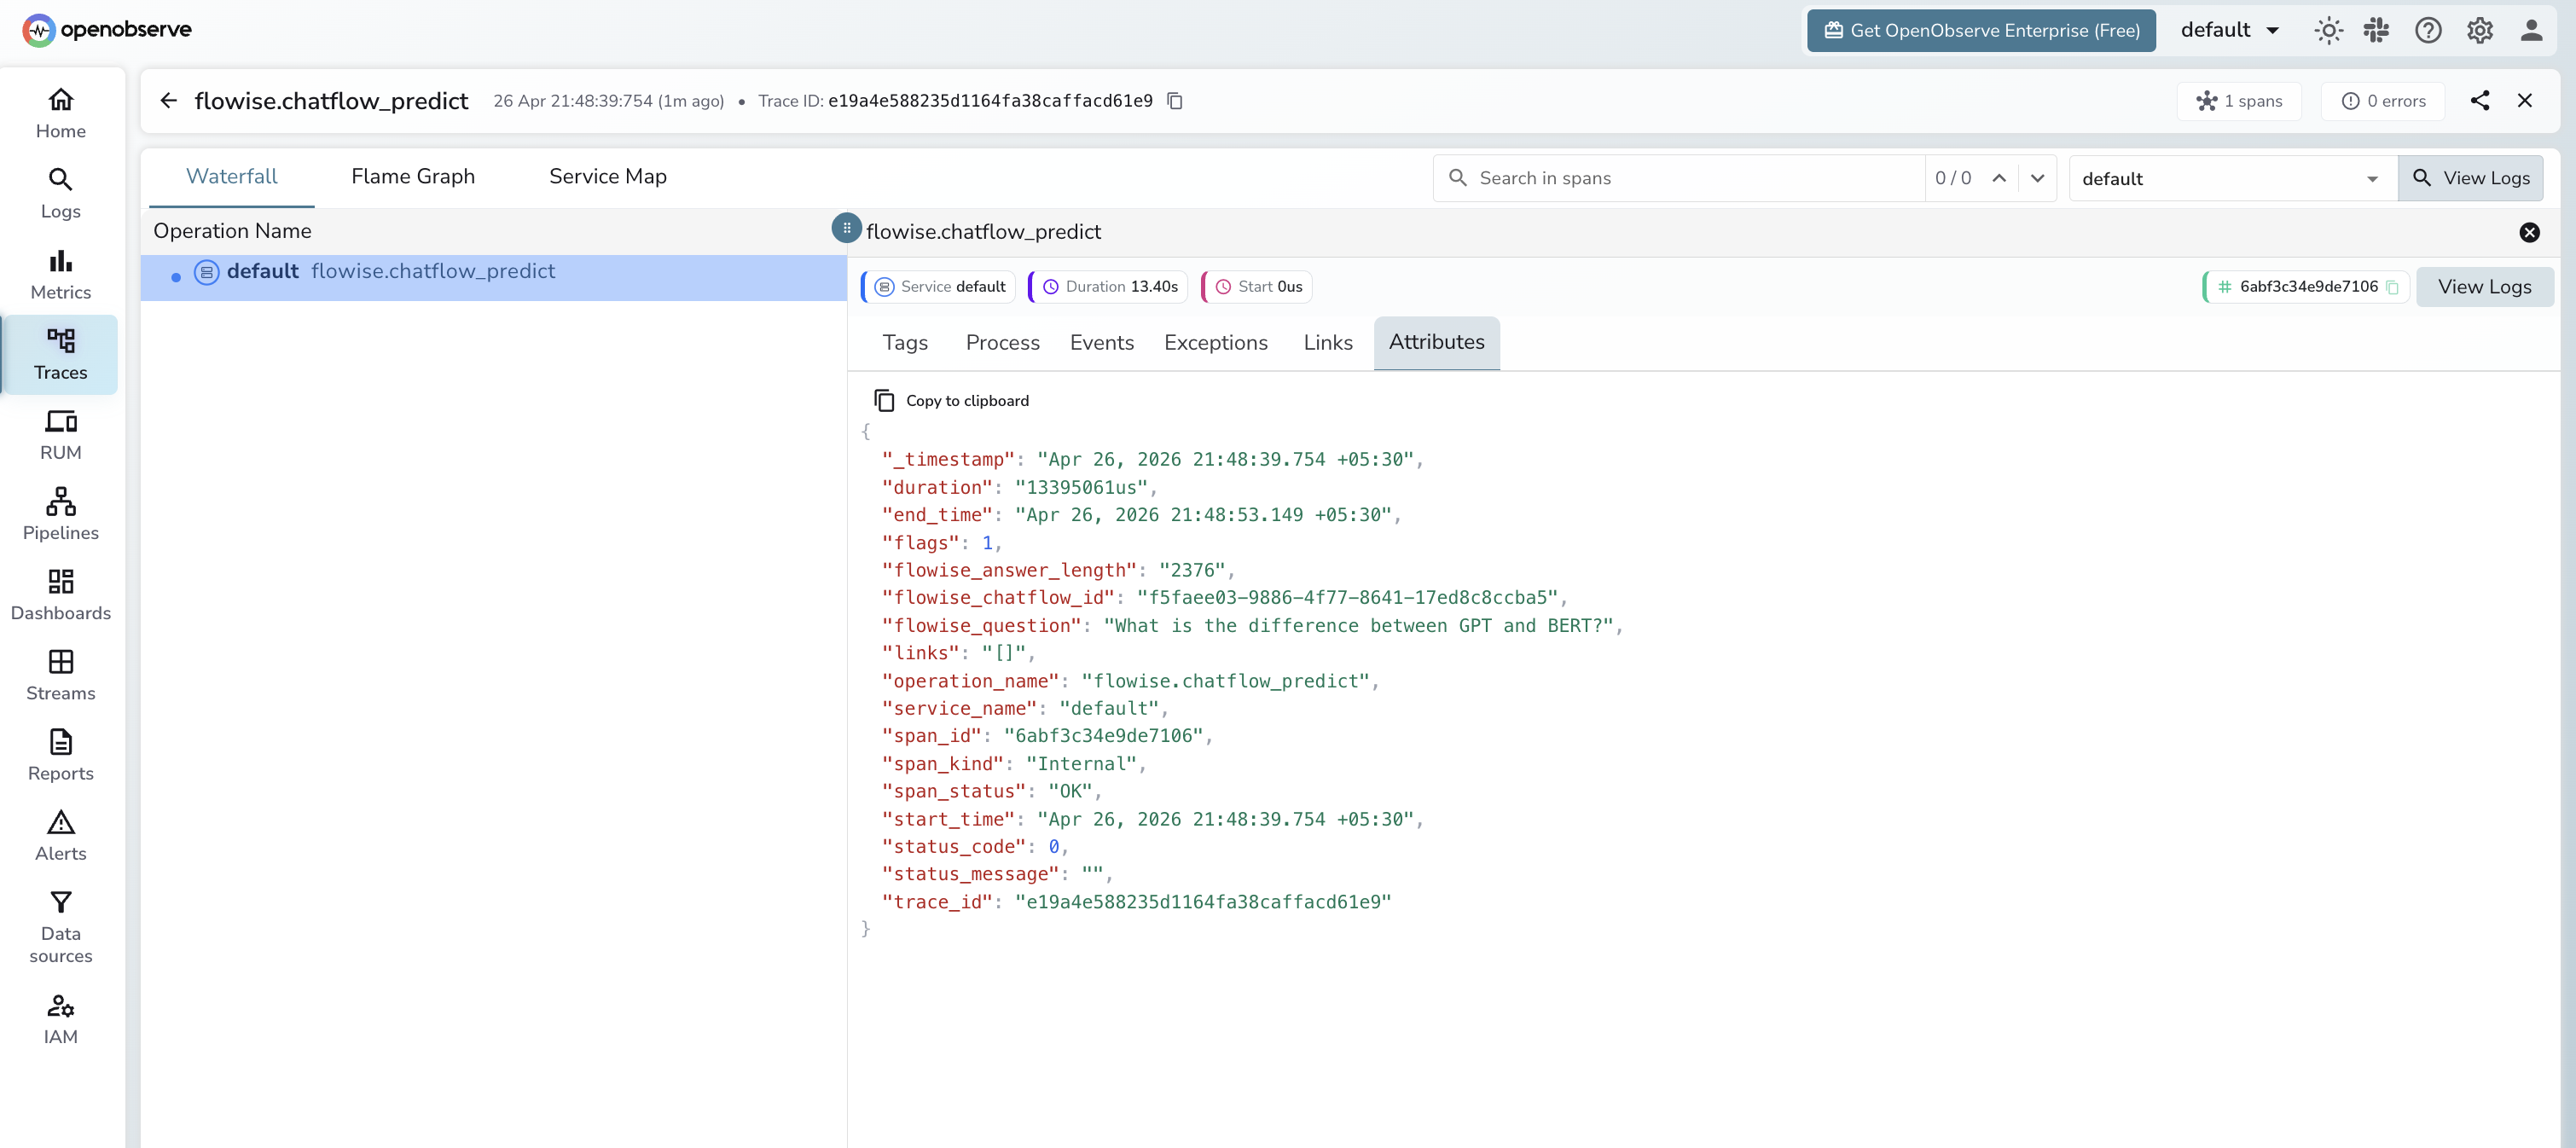
What Gets Captured
Each prediction call emits one flowise.chatflow_predict span:
| Attribute | Description |
|---|---|
flowise_chatflow_id |
The chatflow UUID that handled the request |
flowise_question |
The question text sent to the chatflow |
flowise_answer_length |
Character length of the response |
span_status |
OK on success, ERROR on failure |
error_message |
Error detail when the request fails |
duration |
Total round-trip latency in microseconds |
Viewing Traces
- Log in to OpenObserve and navigate to Traces
- Filter by
operation_name=flowise.chatflow_predictto isolate Flowise spans - Click a trace to inspect the chatflow ID, question, and response length
- Filter by
span_status=ERRORto find failed predictions
Next Steps
With Flowise traces in OpenObserve, you can track chatflow latency over time, compare performance across different flow designs, and alert on prediction failures.