

DSPy → OpenObserve
Automatically capture module executions, LLM calls, and optimiser runs for every DSPy program in your Python application.
Prerequisites
- Python 3.9+
- An OpenObserve account (cloud or self-hosted)
- Your OpenObserve organisation ID and Base64-encoded auth token
- An OpenAI API key (or whichever LLM backend DSPy is calling)
Installation
pip install openobserve-telemetry-sdk "openinference-instrumentation-dspy==0.1.16" "dspy==2.6.13" python-dotenv
Configuration
Create a .env file in your project root:
# OpenObserve instance URL
# Default for self-hosted: http://localhost:5080
OPENOBSERVE_URL=https://api.openobserve.ai/

# Your OpenObserve organisation slug or ID
OPENOBSERVE_ORG=your_org_id

# Basic auth token — Base64-encoded "email:password"
OPENOBSERVE_AUTH_TOKEN=Basic <your_base64_token>

# LLM provider key
OPENAI_API_KEY=your-openai-key
Instrumentation
Call DSPyInstrumentor().instrument() before importing DSPy.
from dotenv import load_dotenv
load_dotenv()

from openinference.instrumentation.dspy import DSPyInstrumentor
from openobserve import openobserve_init

DSPyInstrumentor().instrument()
openobserve_init()

import os
import dspy

lm = dspy.LM("openai/gpt-4o-mini", api_key=os.environ["OPENAI_API_KEY"])
dspy.configure(lm=lm)


class QA(dspy.Signature):
    """Answer questions with short factual answers."""
    question: str = dspy.InputField()
    answer: str = dspy.OutputField()


predict = dspy.Predict(QA)
result = predict(question="What is OpenTelemetry?")
print(result.answer)
Chain of thought
chain_of_thought = dspy.ChainOfThought(QA)
result = chain_of_thought(question="Why is distributed tracing useful?")
print(result.reasoning)
print(result.answer)
What Gets Captured
Each DSPy module call produces a root CHAIN span with a child LLM span for each underlying model call.
Module span (CHAIN)
| Attribute | Description |
|---|---|
openinference_span_kind |
CHAIN |
operation_name |
Module and method name (e.g. Predict(QA).forward) |
llm_observation_type |
CHAIN |
input_mime_type |
application/json |
output_mime_type |
application/json |
duration |
End-to-end module latency |
span_status |
OK on success, ERROR on failure |
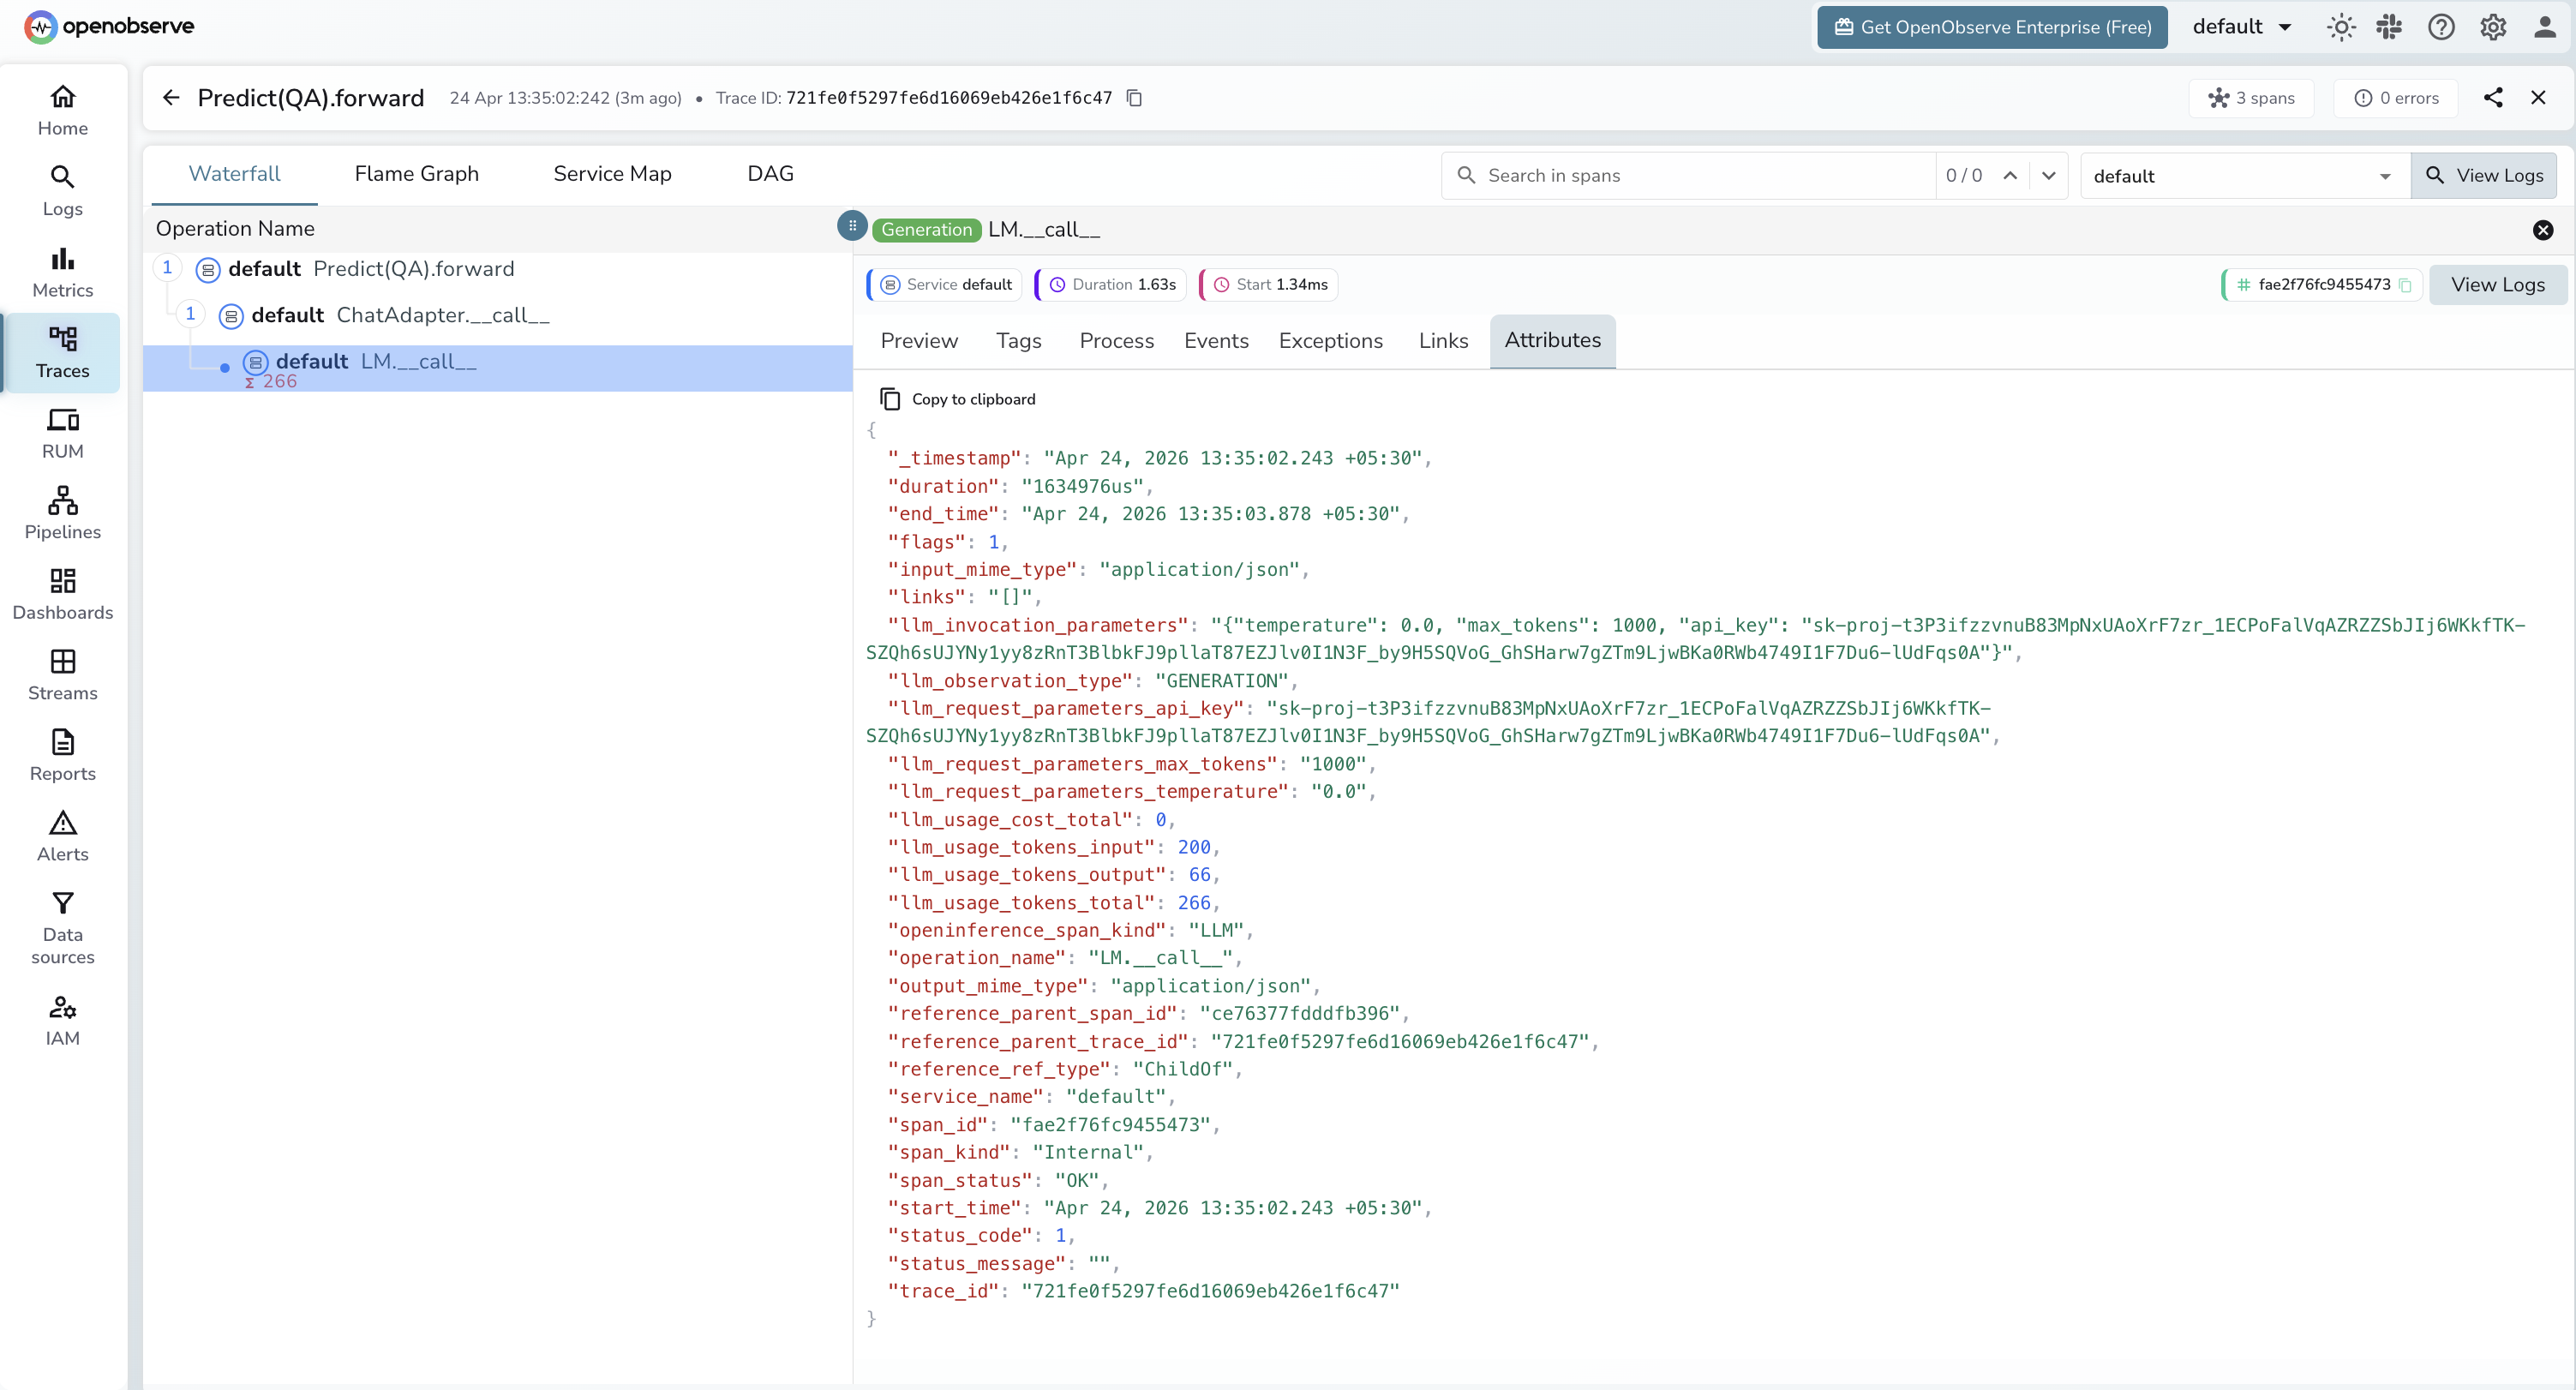
LLM call span (LLM)
| Attribute | Description |
|---|---|
openinference_span_kind |
LLM |
operation_name |
LM.__call__ |
llm_observation_type |
GENERATION |
llm_invocation_parameters |
JSON string with temperature, max_tokens, and other call parameters |
llm_request_parameters_temperature |
Temperature setting for the call |
llm_request_parameters_max_tokens |
Max tokens configured |
llm_usage_tokens_input |
Prompt token count |
llm_usage_tokens_output |
Completion token count |
llm_usage_tokens_total |
Total tokens consumed |
span_status |
OK on success, ERROR on failure |
Note: llm_invocation_parameters includes the API key in plaintext. Avoid exposing raw span data in dashboards shared with untrusted viewers.
Viewing Traces
- Log in to OpenObserve and navigate to Traces in the left sidebar
- Filter by
operation_namecontainingforwardto find DSPy module spans - Click any span to expand the trace and see the child
LM.__call__LLM span - Inspect
llm_usage_tokens_inputandllm_usage_tokens_outputon the LLM span for token counts
Next Steps
With DSPy instrumented, every module execution is recorded in OpenObserve with the full chain of LLM calls that produced the output. From here you can track token usage per module, compare latency across optimisation strategies, and monitor the effect of compiled prompts on cost and speed.