

Microsoft Agent Framework → OpenObserve
Capture agent run latency, input metadata, output size, and error details for every Microsoft Agent Framework invocation. Microsoft Agent Framework is a Python SDK for building multi-agent AI workflows with support for multiple LLM providers. Instrumentation wraps each agent.run() call in an OpenTelemetry span exported to OpenObserve.
Prerequisites
- Python 3.10+
- An OpenObserve account (cloud or self-hosted)
- Your OpenObserve organisation ID and Base64-encoded auth token
- An OpenAI API key
Installation
Configuration
Create a .env file in your project root:
OPENOBSERVE_URL=https://api.openobserve.ai/
OPENOBSERVE_ORG=your_org_id
OPENOBSERVE_AUTH_TOKEN=Basic <your_base64_token>
OPENAI_API_KEY=your-openai-api-key
Instrumentation
Call openobserve_init() to set up the tracer provider, then wrap each agent.run() call in a manual span to capture input and output attributes.
from dotenv import load_dotenv
load_dotenv()

from openobserve import openobserve_init
openobserve_init(resource_attributes={"service.name": "microsoft-agent-framework"})

from opentelemetry import trace
import asyncio
import os
from agent_framework import Agent
from agent_framework_openai import OpenAIChatClient

tracer = trace.get_tracer(__name__)

client = OpenAIChatClient(api_key=os.environ["OPENAI_API_KEY"], model="gpt-4o-mini")
agent = Agent(client=client)

async def main():
    with tracer.start_as_current_span("agent_framework.run") as span:
        span.set_attribute("agent.input", "What is distributed tracing?")
        result = await agent.run("What is distributed tracing?")
        output = result.text if hasattr(result, "text") else str(result)
        span.set_attribute("agent.output_length", len(output))
        span.set_attribute("span_status", "OK")
    print(output)

asyncio.run(main())
What Gets Captured
| Attribute | Example Value |
|---|---|
operation_name |
agent_framework.run |
agent_input |
What is distributed tracing? |
agent_output_length |
2391 |
span_kind |
Internal |
span_status |
OK on success, ERROR on failure |
error_message |
Full error string on failed calls |
service_name |
microsoft-agent-framework |
duration |
End-to-end agent run latency in microseconds |
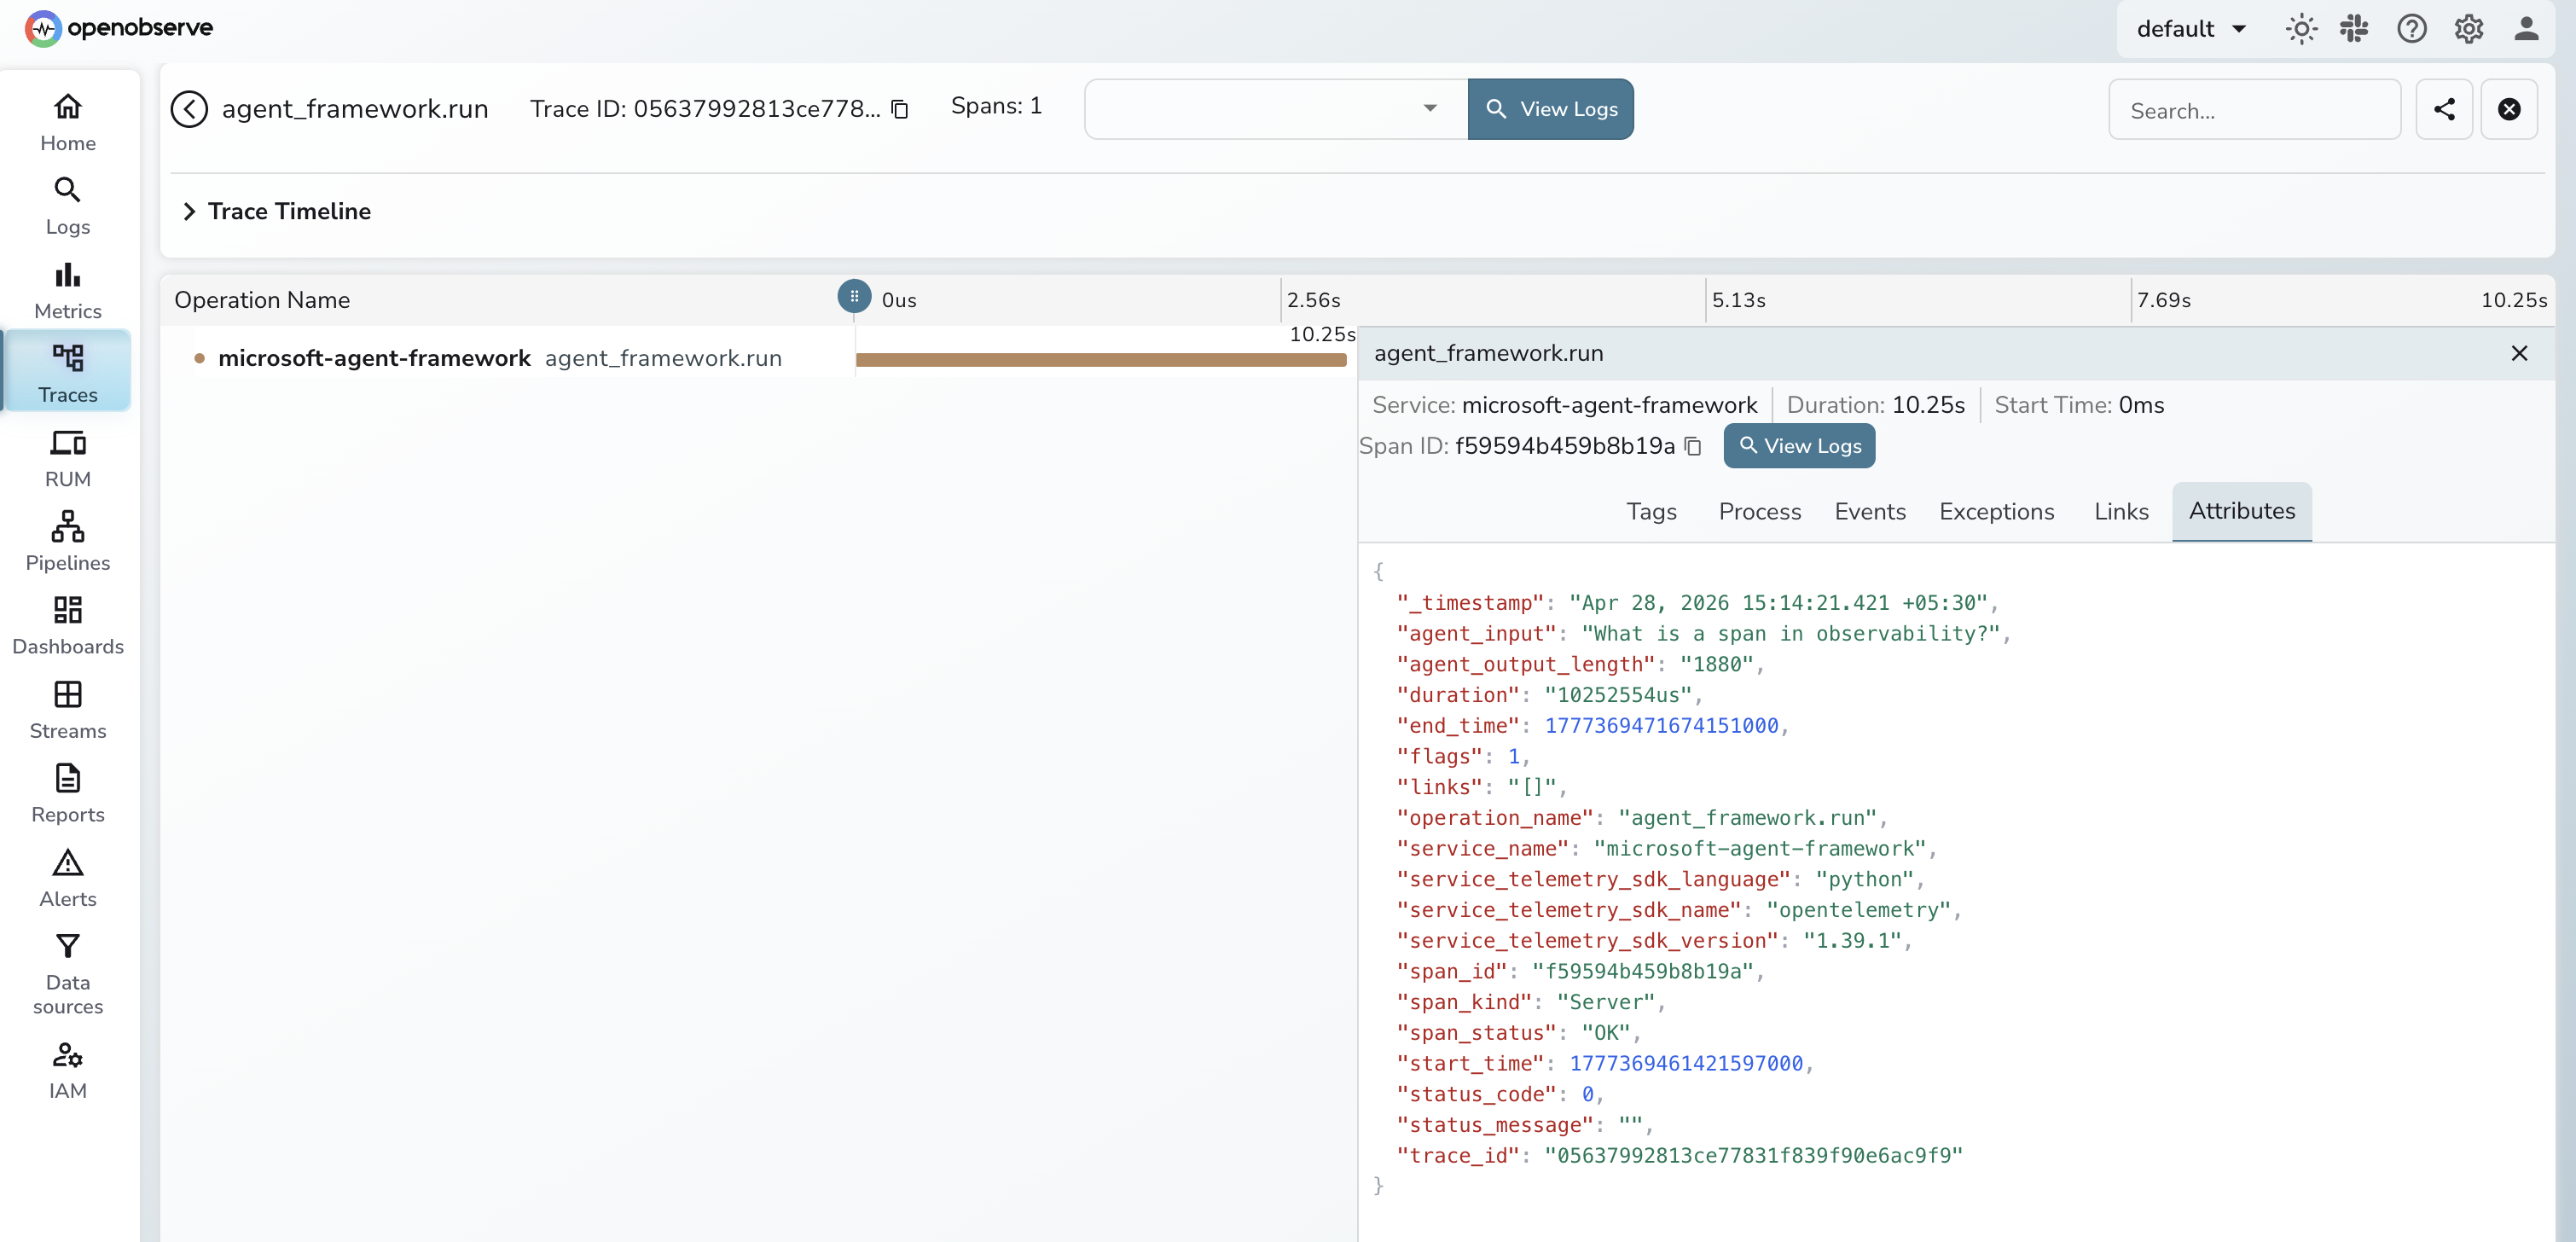
Viewing Traces
- Log in to OpenObserve and navigate to Traces
- Filter by
service_name = microsoft-agent-frameworkto see all agent runs - Click any span to inspect
agent_input,agent_output_length, andduration - Filter by
span_status = ERRORto find failed invocations and readerror_message - Sort by
durationdescending to identify the slowest agent calls
Next Steps
With Microsoft Agent Framework instrumented, every agent run is recorded in OpenObserve. From here you can track latency per prompt type, monitor error rates, and set alerts when agent calls fail in production.