

Pydantic AI → OpenObserve
Automatically capture agent runs, tool calls, structured output extractions, and LLM invocations for every Pydantic AI agent in your Python application. Pydantic AI has built-in OpenTelemetry support — no separate instrumentation package is needed.
Prerequisites
- Python 3.9+
- An OpenObserve account (cloud or self-hosted)
- Your OpenObserve organisation ID and Base64-encoded auth token
- An OpenAI API key (or whichever model backend your agent uses)
Installation
If you are on Python 3.9, pin to the last compatible version:
Configuration
Create a .env file in your project root:
# OpenObserve instance URL
# Default for self-hosted: http://localhost:5080
OPENOBSERVE_URL=https://api.openobserve.ai/

# Your OpenObserve organisation slug or ID
OPENOBSERVE_ORG=your_org_id

# Basic auth token — Base64-encoded "email:password"
OPENOBSERVE_AUTH_TOKEN=Basic <your_base64_token>

# LLM provider key
OPENAI_API_KEY=your-openai-key
Instrumentation
Pydantic AI uses the global OpenTelemetry TracerProvider. Set up openobserve_init() first to register the provider, then call Agent.instrument_all() to enable tracing on all agents.
from dotenv import load_dotenv
load_dotenv()

from openobserve import openobserve_init

openobserve_init()

from pydantic_ai import Agent
Agent.instrument_all()

agent = Agent("openai:gpt-4o-mini")

result = agent.run_sync("Explain distributed tracing in one sentence.")
print(result.output)
Structured output
from pydantic import BaseModel
from pydantic_ai import Agent


class Summary(BaseModel):
    topic: str
    key_point: str
    confidence: float


structured_agent = Agent("openai:gpt-4o-mini", output_type=Summary)

result = structured_agent.run_sync("Summarise what OpenTelemetry is.")
print(result.output.topic, result.output.key_point)
Agent with tools
from pydantic_ai import Agent, RunContext


agent = Agent("openai:gpt-4o-mini")


@agent.tool
def word_count(ctx: RunContext[None], text: str) -> int:
    """Count the number of words in a text."""
    return len(text.split())


result = agent.run_sync("How many words are in this sentence: 'The quick brown fox'?")
print(result.output)
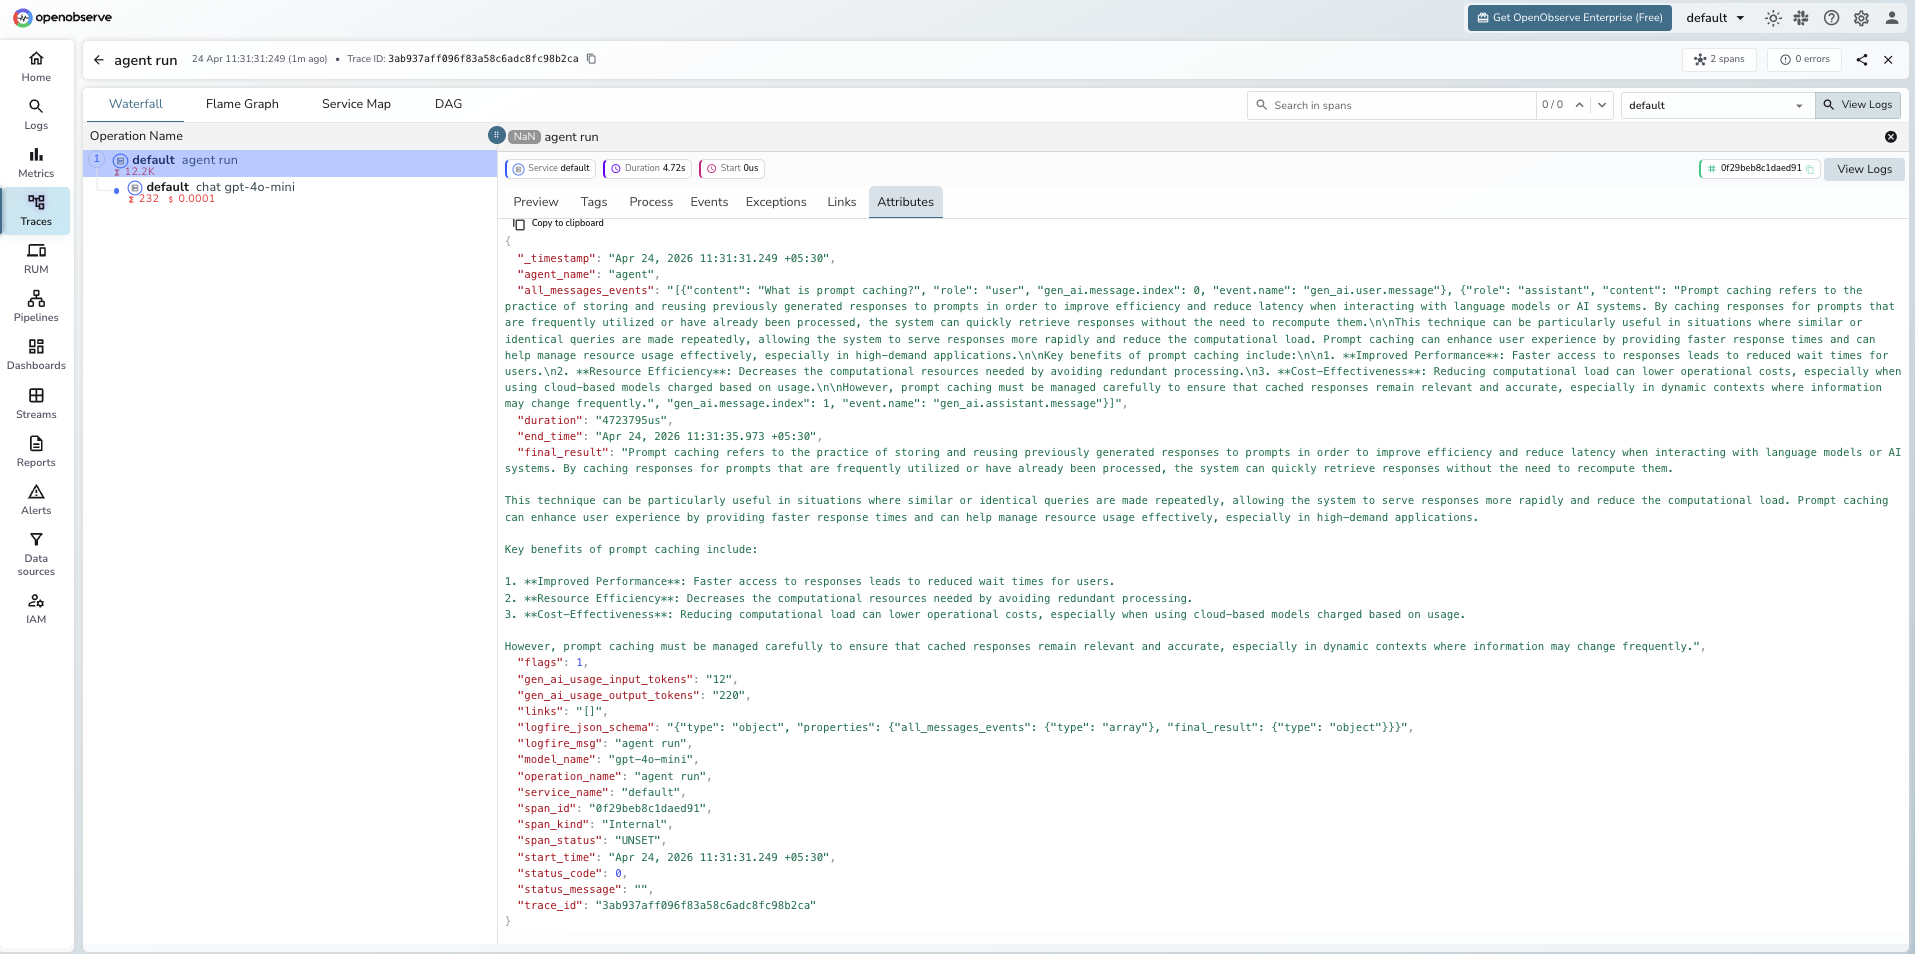
What Gets Captured
Each agent.run_sync() or agent.run() call produces a root agent span. Pydantic AI uses its own OTel schema (built on Logfire) rather than OpenInference.
| Attribute | Description |
|---|---|
operation_name |
agent run |
agent_name |
Agent identifier |
model_name |
Model used (e.g. gpt-4o-mini) |
gen_ai_usage_input_tokens |
Input tokens for the agent run |
gen_ai_usage_output_tokens |
Output tokens for the agent run |
final_result |
Full text output returned by the agent |
all_messages_events |
JSON array of all user and assistant messages |
logfire_msg |
Human-readable span label (e.g. agent run) |
duration |
End-to-end agent run latency |
span_status |
UNSET on success, ERROR on failure |
Viewing Traces
- Log in to OpenObserve and navigate to Traces in the left sidebar
- Filter by
operation_name = agent runto find Pydantic AI spans - Click any span to inspect
final_result,all_messages_events, and token counts - Filter by
model_nameto compare performance across different models
Next Steps
With Pydantic AI instrumented, every agent run is recorded in OpenObserve. From here you can track token usage per agent run, compare latency across model versions, and monitor retry behaviour when structured output validation fails.