

Codename Goose → OpenObserve
Capture session run latency, exit codes, and output lengths for every Codename Goose invocation. Codename Goose is Block's open-source AI developer agent that uses tools to complete multi-step software engineering tasks. Instrumentation wraps subprocess calls to the goose CLI in manual OpenTelemetry spans.
Prerequisites
- Python 3.8+
- An OpenObserve account (cloud or self-hosted)
- Your OpenObserve organisation ID and Base64-encoded auth token
- Codename Goose CLI installed (see below)
- An OpenAI API key (or another supported provider)
Installation
Install the Goose CLI:
Install the Python dependencies:
Configuration
Create a .env file in your project root:
OPENOBSERVE_URL=http://localhost:5080/
OPENOBSERVE_ORG=default
OPENOBSERVE_AUTH_TOKEN=Basic <your_base64_token>
OPENAI_API_KEY=your-openai-api-key
Set provider and model via environment variables at run time:
Instrumentation
Call openobserve_init() before running sessions. Wrap each goose run subprocess call in a manual span.
from dotenv import load_dotenv
load_dotenv()

from openobserve import openobserve_init
openobserve_init()

from opentelemetry import trace
import os
import subprocess

tracer = trace.get_tracer(__name__)

goose_env = {
    **os.environ,
    "GOOSE_PROVIDER": "openai",
    "GOOSE_MODEL": "gpt-4o-mini",
}

def run_goose(prompt: str):
    with tracer.start_as_current_span("goose.session_run") as span:
        span.set_attribute("goose.prompt", prompt[:100])
        span.set_attribute("goose.provider", "openai")
        span.set_attribute("goose.model", "gpt-4o-mini")
        result = subprocess.run(
            ["goose", "run", "-t", prompt, "-q"],
            capture_output=True,
            text=True,
            timeout=60,
            env=goose_env,
        )
        span.set_attribute("goose.exit_code", result.returncode)
        span.set_attribute("goose.output_length", len(result.stdout))
        span.set_attribute("span_status", "OK" if result.returncode == 0 else "ERROR")
        return result.stdout.strip()

output = run_goose("Explain distributed tracing in one sentence.")
print(output)

trace.get_tracer_provider().force_flush()
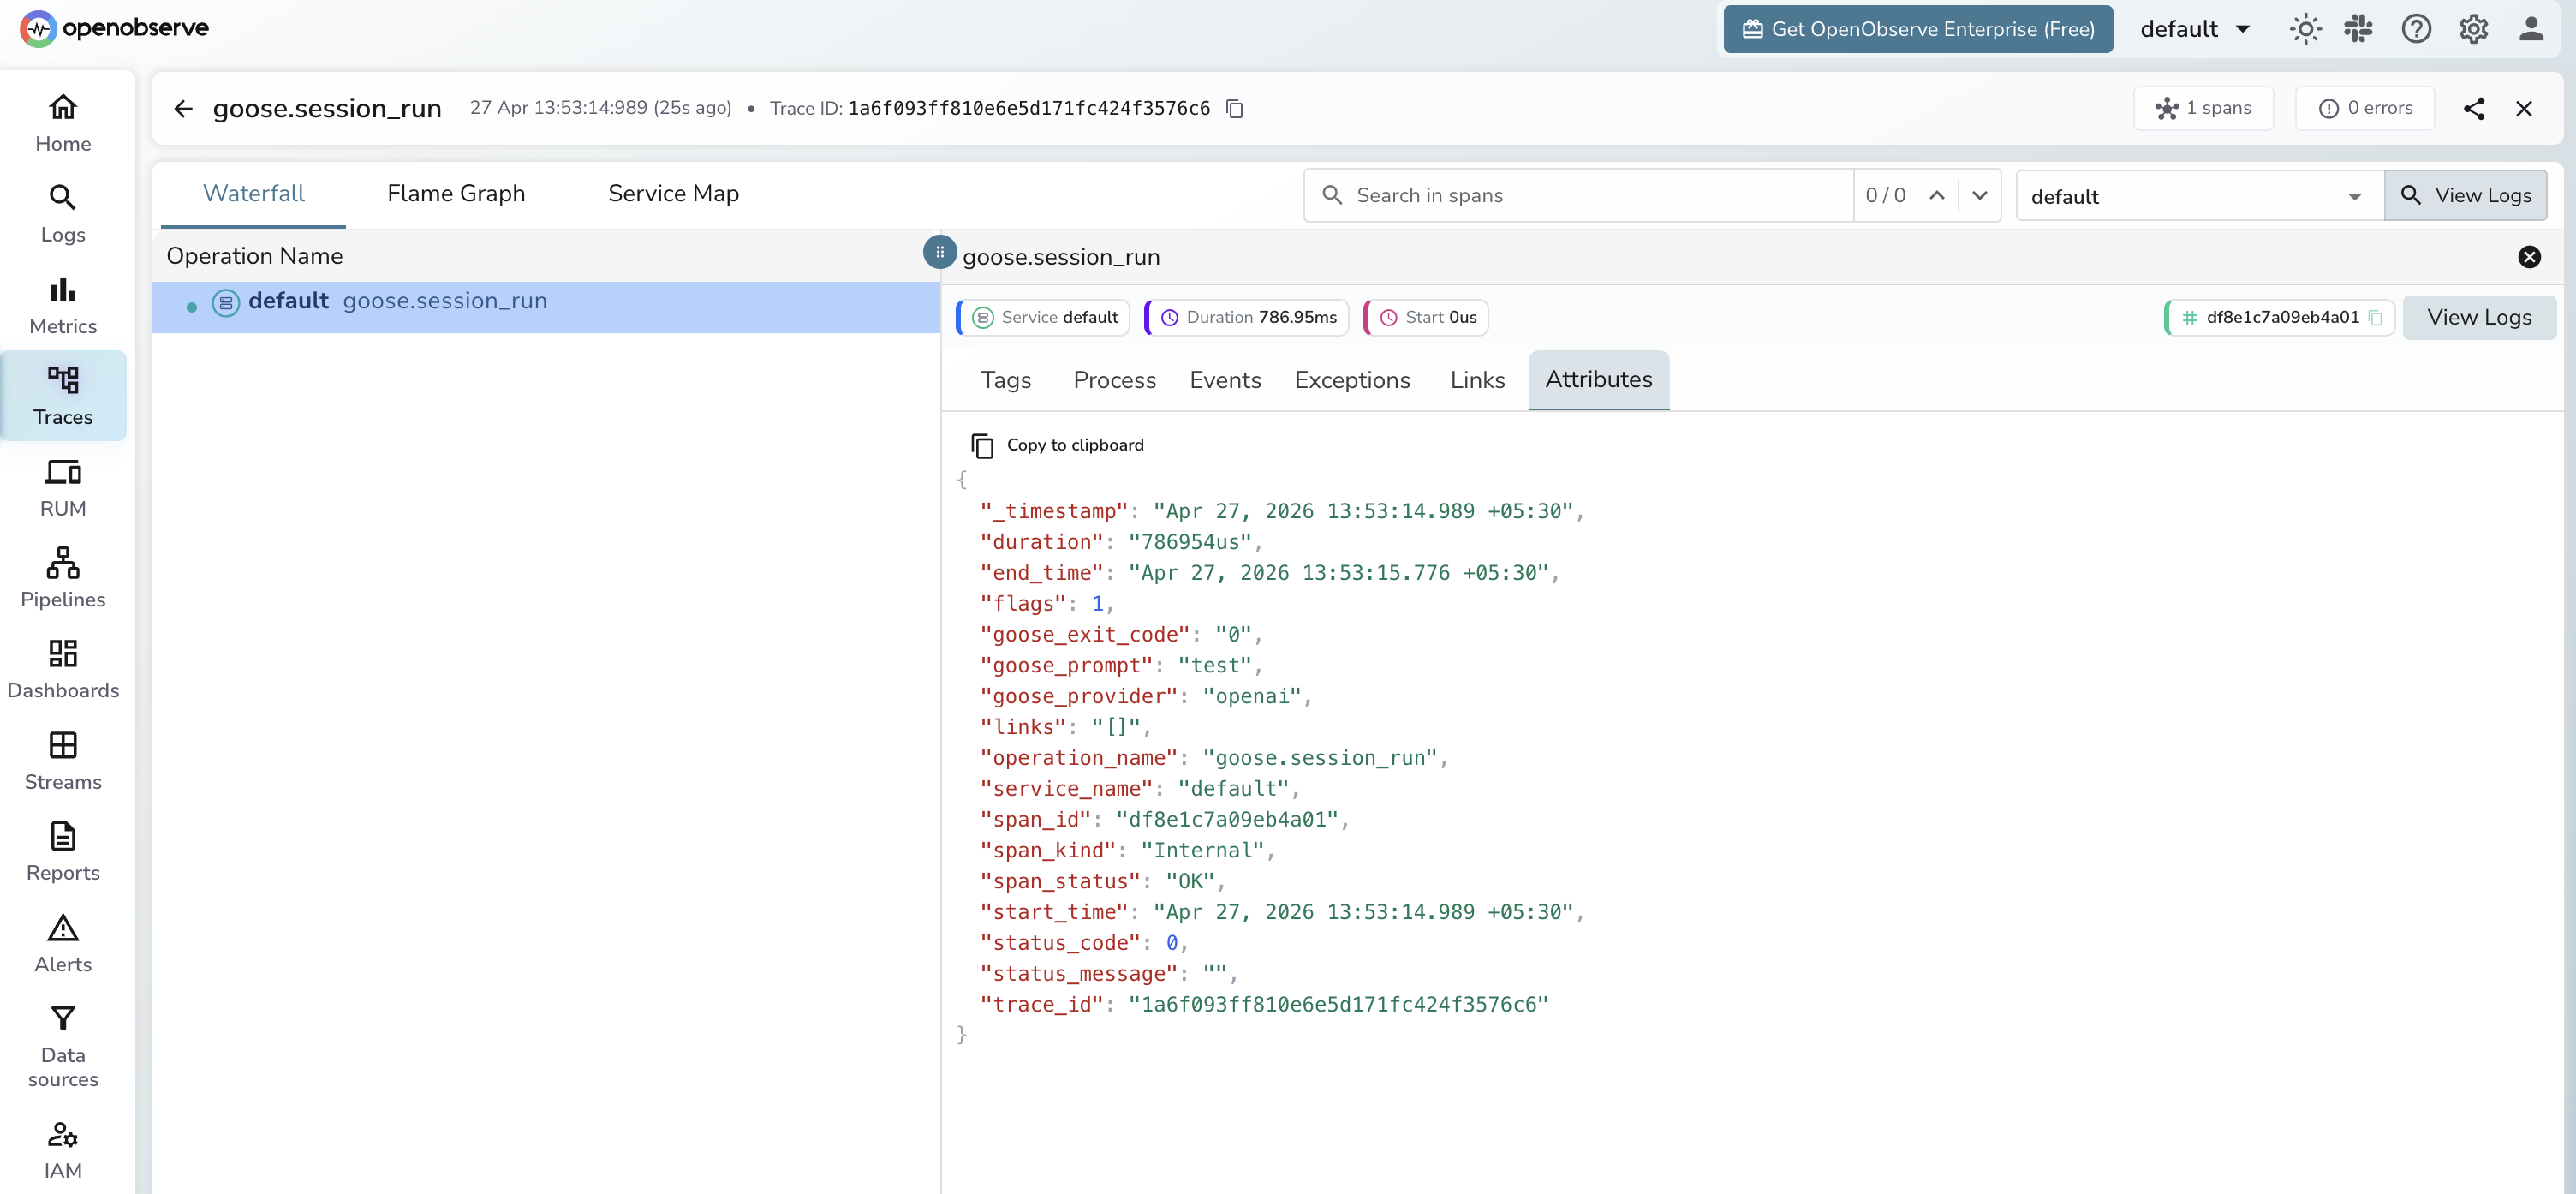
What Gets Captured
| Attribute | Description |
|---|---|
operation_name |
goose.session_run |
goose_prompt |
The prompt passed to the session (truncated to 100 chars) |
goose_provider |
The LLM provider used (e.g. openai) |
goose_model |
The model used (e.g. gpt-4o-mini) |
goose_exit_code |
Exit code of the goose process (0 = success) |
goose_output_length |
Character count of the session output |
span_status |
OK on success, ERROR on failure |
error.message |
Error detail when the process fails or times out |
duration |
Total session run latency |
Viewing Traces
- Log in to OpenObserve and navigate to Traces
- Filter by
operation_name=goose.session_runto see all session runs - Filter by
goose_exit_code!=0to find failed sessions - Sort by duration to identify the slowest prompts
Next Steps
With Codename Goose instrumented, every agent session is recorded in OpenObserve. From here you can monitor session latency, track exit code distributions, and correlate long-running sessions with specific prompt types.