

VoltAgent → OpenObserve
Capture agent run latency, model name, token usage, user ID, and session ID for every VoltAgent invocation. VoltAgent is a TypeScript-first AI agent framework with built-in OpenTelemetry support. Configure a standard OTLP exporter before importing VoltAgent and spans are emitted automatically for every agent call.
Prerequisites
- Node.js 18+
- An OpenObserve account (cloud or self-hosted)
- Your OpenObserve organisation ID and Base64-encoded auth token
- An OpenAI API key
Installation
npm install @voltagent/core @voltagent/vercel-ai "@ai-sdk/openai@^2" \
  @opentelemetry/sdk-node @opentelemetry/exporter-trace-otlp-http \
  @opentelemetry/sdk-trace-base @opentelemetry/resources dotenv
Configuration
Create a .env file in your project root:
OPENOBSERVE_URL=http://localhost:5080/
OPENOBSERVE_ORG=default
OPENOBSERVE_AUTH_TOKEN=Basic <your_base64_token>
OPENAI_API_KEY=your-openai-api-key
Instrumentation
Set up the OTel SDK with an OTLP exporter before requiring VoltAgent. VoltAgent reads the active OTel tracer provider and emits generateText spans automatically for each agent call.
process.env.OTEL_SERVICE_NAME = 'voltagent-app';
require('dotenv').config();

const { NodeSDK } = require('@opentelemetry/sdk-node');
const { OTLPTraceExporter } = require('@opentelemetry/exporter-trace-otlp-http');
const { SimpleSpanProcessor } = require('@opentelemetry/sdk-trace-base');
const { resourceFromAttributes } = require('@opentelemetry/resources');

const sdk = new NodeSDK({
  resource: resourceFromAttributes({ 'service.name': 'voltagent-app' }),
  spanProcessors: [
    new SimpleSpanProcessor(
      new OTLPTraceExporter({
        url: `${process.env.OPENOBSERVE_URL}api/${process.env.OPENOBSERVE_ORG}/v1/traces`,
        headers: { Authorization: process.env.OPENOBSERVE_AUTH_TOKEN },
      })
    ),
  ],
});
sdk.start();

const { Agent } = require('@voltagent/core');
const { VercelAIProvider } = require('@voltagent/vercel-ai');
const { openai } = require('@ai-sdk/openai');

async function main() {
  const agent = new Agent({
    name: 'observability-agent',
    description: 'A helpful assistant that answers questions about observability.',
    llm: new VercelAIProvider(),
    model: openai('gpt-4o-mini'),
  });

  const result = await agent.generateText(
    'Explain distributed tracing in one sentence.',
    { userId: 'user-123' }
  );
  console.log(result);

  await sdk.shutdown();
}

main().catch(console.error);
Run with:
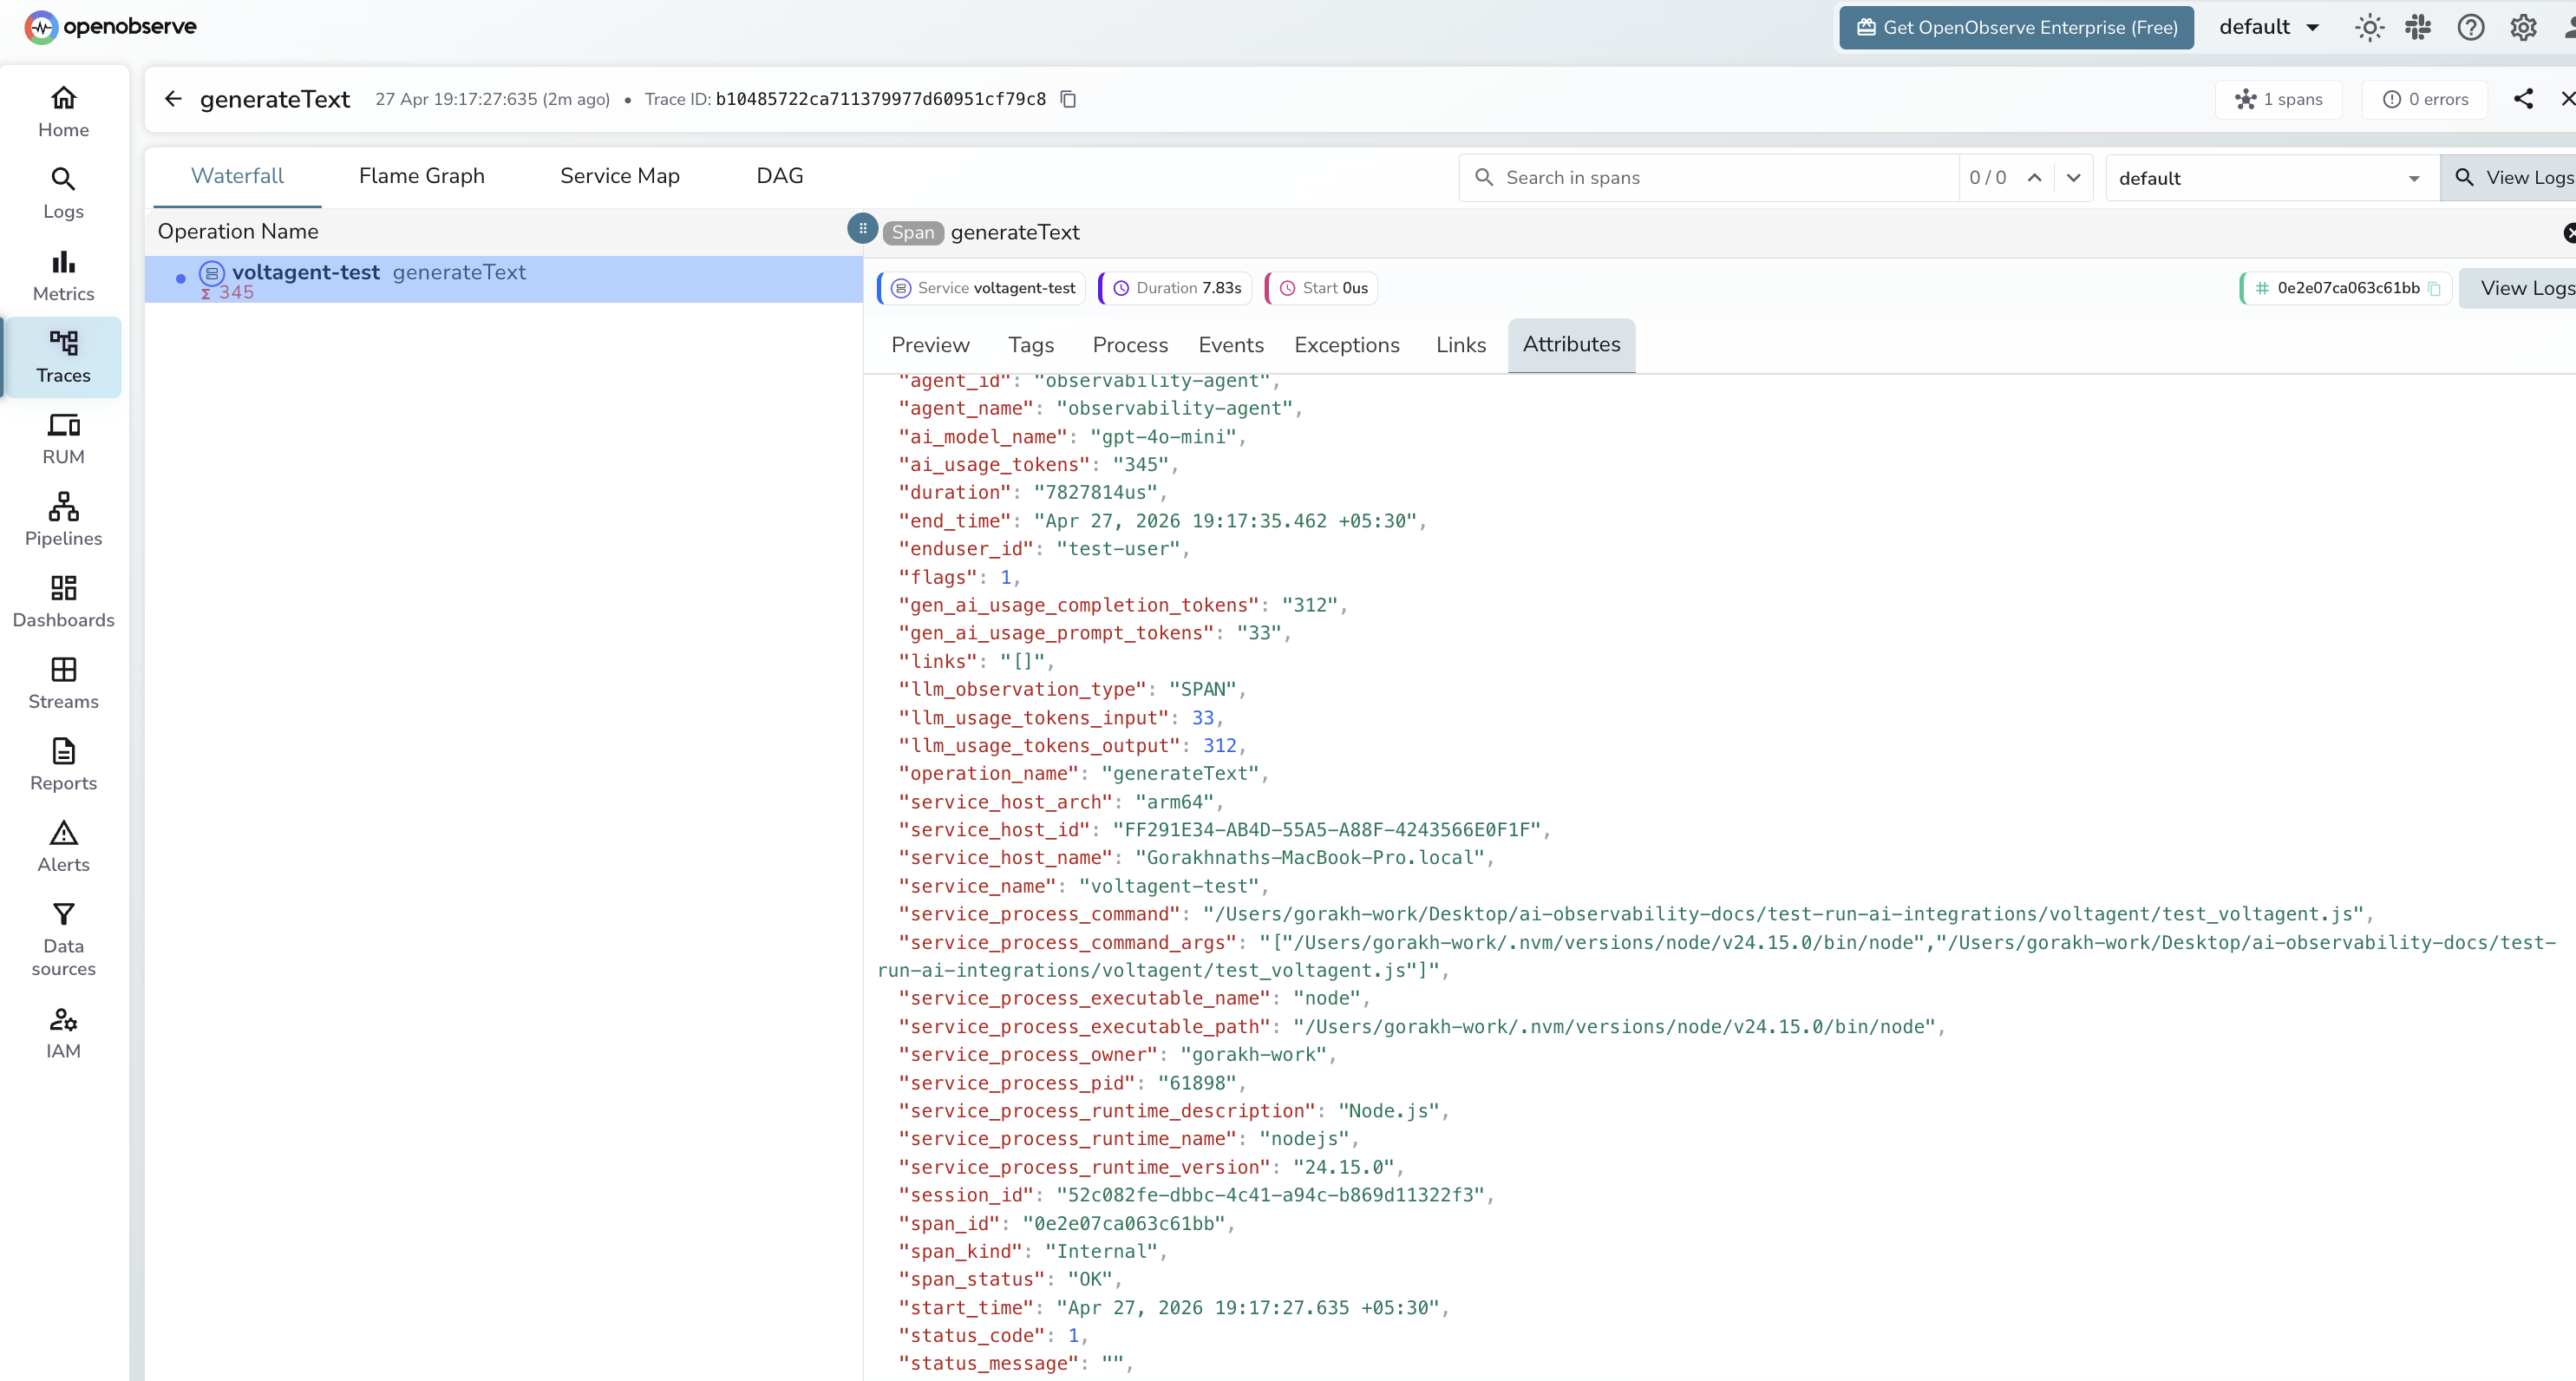
What Gets Captured
| Attribute | Description |
|---|---|
operation_name |
generateText for every agent call |
agent_id |
Internal agent identifier |
agent_name |
Agent name set in the Agent constructor |
ai_model_name |
Model used (e.g. gpt-4o-mini) |
ai_usage_tokens |
Total tokens consumed by the call |
gen_ai_usage_prompt_tokens |
Tokens in the input prompt |
gen_ai_usage_completion_tokens |
Tokens in the generated response |
enduser_id |
User ID passed in the call options |
session_id |
VoltAgent session identifier |
span_status |
OK on success, ERROR on failure |
status_message |
Error detail when the call fails |
duration |
End-to-end agent run latency |
Viewing Traces
- Log in to OpenObserve and navigate to Traces
- Filter by
operation_name=generateTextto see all agent calls - Filter by
agent_nameto compare different agent configurations - Filter by
enduser_idto trace calls for a specific user - Filter by
span_status=ERRORto find failed runs
Next Steps
With VoltAgent instrumented, every agent run is recorded in OpenObserve. From here you can track per-agent latency, monitor token usage by user ID, and alert on error rates.