

LiteLLM → OpenObserve
Automatically capture token usage, latency, and model metadata for every LiteLLM completion call in your Python application. LiteLLM's unified interface lets you switch between 100+ providers while keeping a single instrumentation setup.
Prerequisites
- Python 3.9+
- An OpenObserve account (cloud or self-hosted)
- Your OpenObserve organisation ID and Base64-encoded auth token
- API keys for whichever providers you call through LiteLLM
Installation
Configuration
Create a .env file in your project root:
# OpenObserve instance URL
# Default for self-hosted: http://localhost:5080
OPENOBSERVE_URL=https://api.openobserve.ai/

# Your OpenObserve organisation slug or ID
OPENOBSERVE_ORG=your_org_id

# Basic auth token — Base64-encoded "email:password"
OPENOBSERVE_AUTH_TOKEN=Basic <your_base64_token>

# Provider keys — add whichever backends you use
OPENAI_API_KEY=your-openai-key
ANTHROPIC_API_KEY=your-anthropic-key
Instrumentation
Call LiteLLMInstrumentor().instrument() before importing LiteLLM.
from dotenv import load_dotenv
load_dotenv()

from openinference.instrumentation.litellm import LiteLLMInstrumentor
from openobserve import openobserve_init

LiteLLMInstrumentor().instrument()
openobserve_init()

import litellm

response = litellm.completion(
    model="gpt-4o-mini",
    messages=[{"role": "user", "content": "Explain distributed tracing in one sentence."}],
)
print(response.choices[0].message.content)
Calling multiple providers
Because LiteLLM normalises the interface, switching models produces separate spans with different llm_model_name values — useful for comparing providers side by side.
for model in ["gpt-4o-mini", "gpt-4o"]:
    response = litellm.completion(
        model=model,
        messages=[{"role": "user", "content": "What is OpenTelemetry?"}],
    )
    print(f"{model}: {response.choices[0].message.content}")
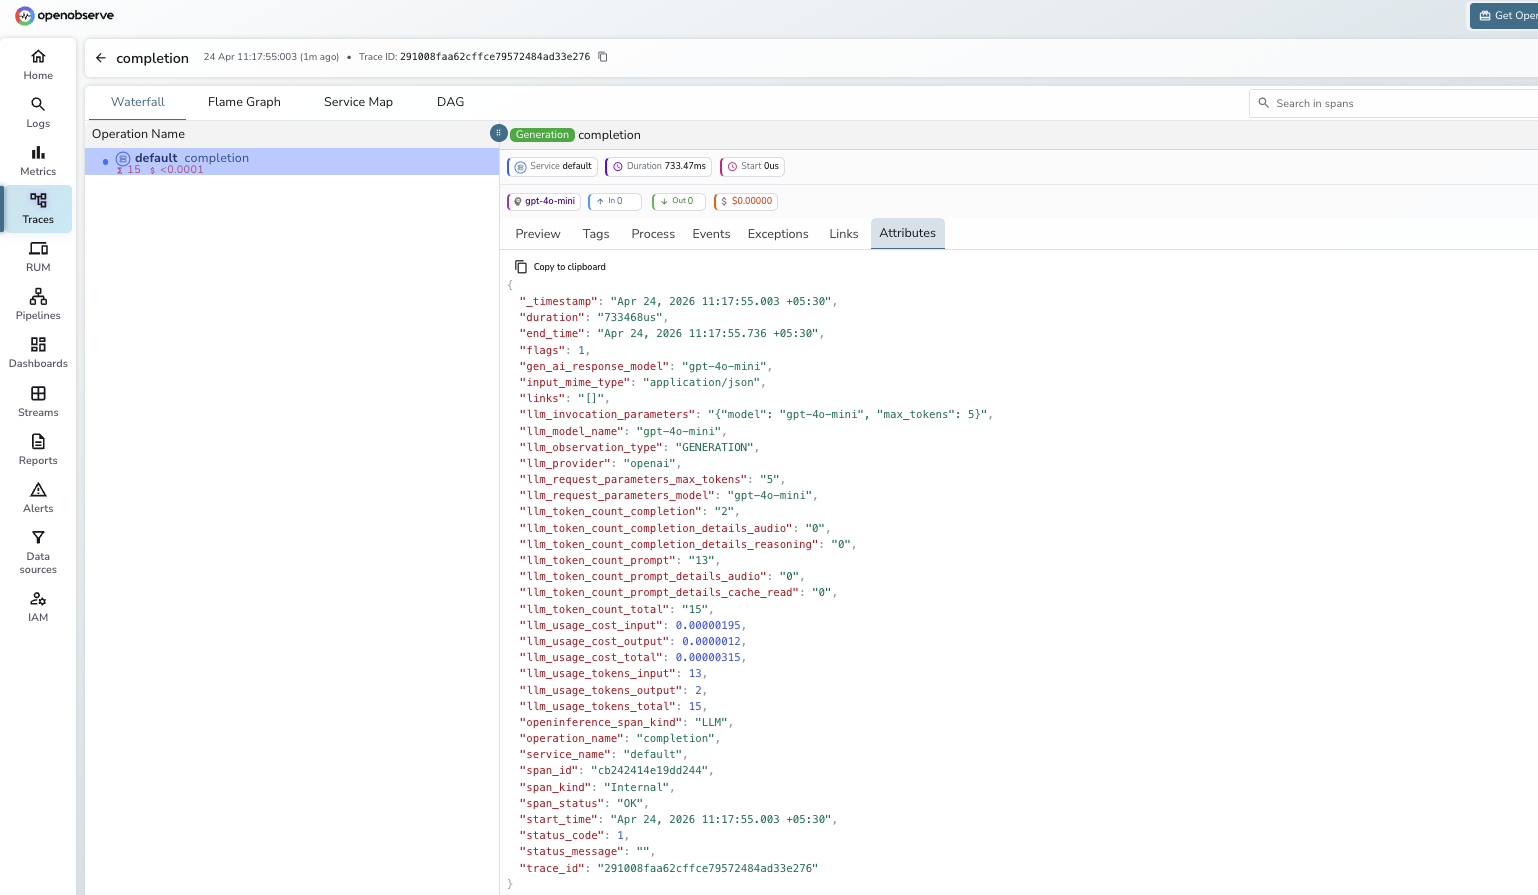
What Gets Captured
Each litellm.completion call produces one LLM span.
| Attribute | Description |
|---|---|
openinference_span_kind |
LLM |
operation_name |
completion |
llm_model_name |
Model used (e.g. gpt-4o-mini) |
llm_provider |
Provider routing the call (e.g. openai) |
llm_observation_type |
GENERATION |
llm_invocation_parameters |
JSON string with request parameters |
llm_token_count_prompt |
Prompt token count |
llm_token_count_completion |
Completion token count |
llm_token_count_total |
Total tokens consumed |
llm_token_count_prompt_details_cache_read |
Cached prompt tokens read |
llm_token_count_completion_details_reasoning |
Reasoning tokens (where supported) |
llm_usage_tokens_input |
Input tokens (numeric) |
llm_usage_tokens_output |
Output tokens (numeric) |
llm_usage_cost_input |
Estimated input cost in USD |
llm_usage_cost_output |
Estimated output cost in USD |
gen_ai_response_model |
Model that handled the request |
duration |
End-to-end request latency |
span_status |
OK on success, ERROR on failure |
Viewing Traces
- Log in to OpenObserve and navigate to Traces in the left sidebar
- Filter by
operation_name = completionto find LiteLLM spans - Filter by
llm_model_nameto compare latency and token cost across models or providers - Click any span to inspect
llm_invocation_parameters, token counts, and cost attributes
Next Steps
With LiteLLM instrumented, every completion call is recorded in OpenObserve regardless of which provider it routes to. From here you can compare token costs across providers, track latency by model, and build dashboards showing which backend your application uses most.