

Haystack → OpenObserve
Automatically capture pipeline runs, component executions, and LLM calls for every Haystack v2 pipeline in your Python application.
Prerequisites
- Python 3.10+
- An OpenObserve account (cloud or self-hosted)
- Your OpenObserve organisation ID and Base64-encoded auth token
- An OpenAI API key (or whichever generator component you use)
Installation
pip install openobserve-telemetry-sdk openinference-instrumentation-haystack haystack-ai python-dotenv
Configuration
Create a .env file in your project root:
# OpenObserve instance URL
# Default for self-hosted: http://localhost:5080
OPENOBSERVE_URL=https://api.openobserve.ai/

# Your OpenObserve organisation slug or ID
OPENOBSERVE_ORG=your_org_id

# Basic auth token — Base64-encoded "email:password"
OPENOBSERVE_AUTH_TOKEN=Basic <your_base64_token>

# LLM provider key
OPENAI_API_KEY=your-openai-key
Instrumentation
Call HaystackInstrumentor().instrument() before importing any Haystack modules.
from dotenv import load_dotenv
load_dotenv()

from openinference.instrumentation.haystack import HaystackInstrumentor
from openobserve import openobserve_init

HaystackInstrumentor().instrument()
openobserve_init()

from haystack import Pipeline
from haystack.components.builders import PromptBuilder
from haystack.components.generators import OpenAIGenerator

template = "Answer the following question in one sentence: {{ question }}"

pipeline = Pipeline()
pipeline.add_component("prompt", PromptBuilder(template=template))
pipeline.add_component("llm", OpenAIGenerator(model="gpt-4o-mini"))
pipeline.connect("prompt.prompt", "llm.prompt")

result = pipeline.run({"prompt": {"question": "What is OpenTelemetry?"}})
print(result["llm"]["replies"][0])
RAG pipeline
from haystack.components.retrievers.in_memory import InMemoryBM25Retriever
from haystack.document_stores.in_memory import InMemoryDocumentStore
from haystack import Document

store = InMemoryDocumentStore()
store.write_documents([
    Document(content="OpenObserve is an observability platform for logs, metrics, and traces."),
    Document(content="OpenTelemetry is a vendor-neutral standard for telemetry data."),
])

rag = Pipeline()
rag.add_component("retriever", InMemoryBM25Retriever(document_store=store))
rag.add_component("prompt", PromptBuilder(
    template="Given these documents: {% for doc in documents %}{{ doc.content }}{% endfor %}\nAnswer: {{ question }}"
))
rag.add_component("llm", OpenAIGenerator(model="gpt-4o-mini"))
rag.connect("retriever.documents", "prompt.documents")
rag.connect("prompt.prompt", "llm.prompt")

result = rag.run({"retriever": {"query": "What is OpenObserve?"}, "prompt": {"question": "What is OpenObserve?"}})
print(result["llm"]["replies"][0])
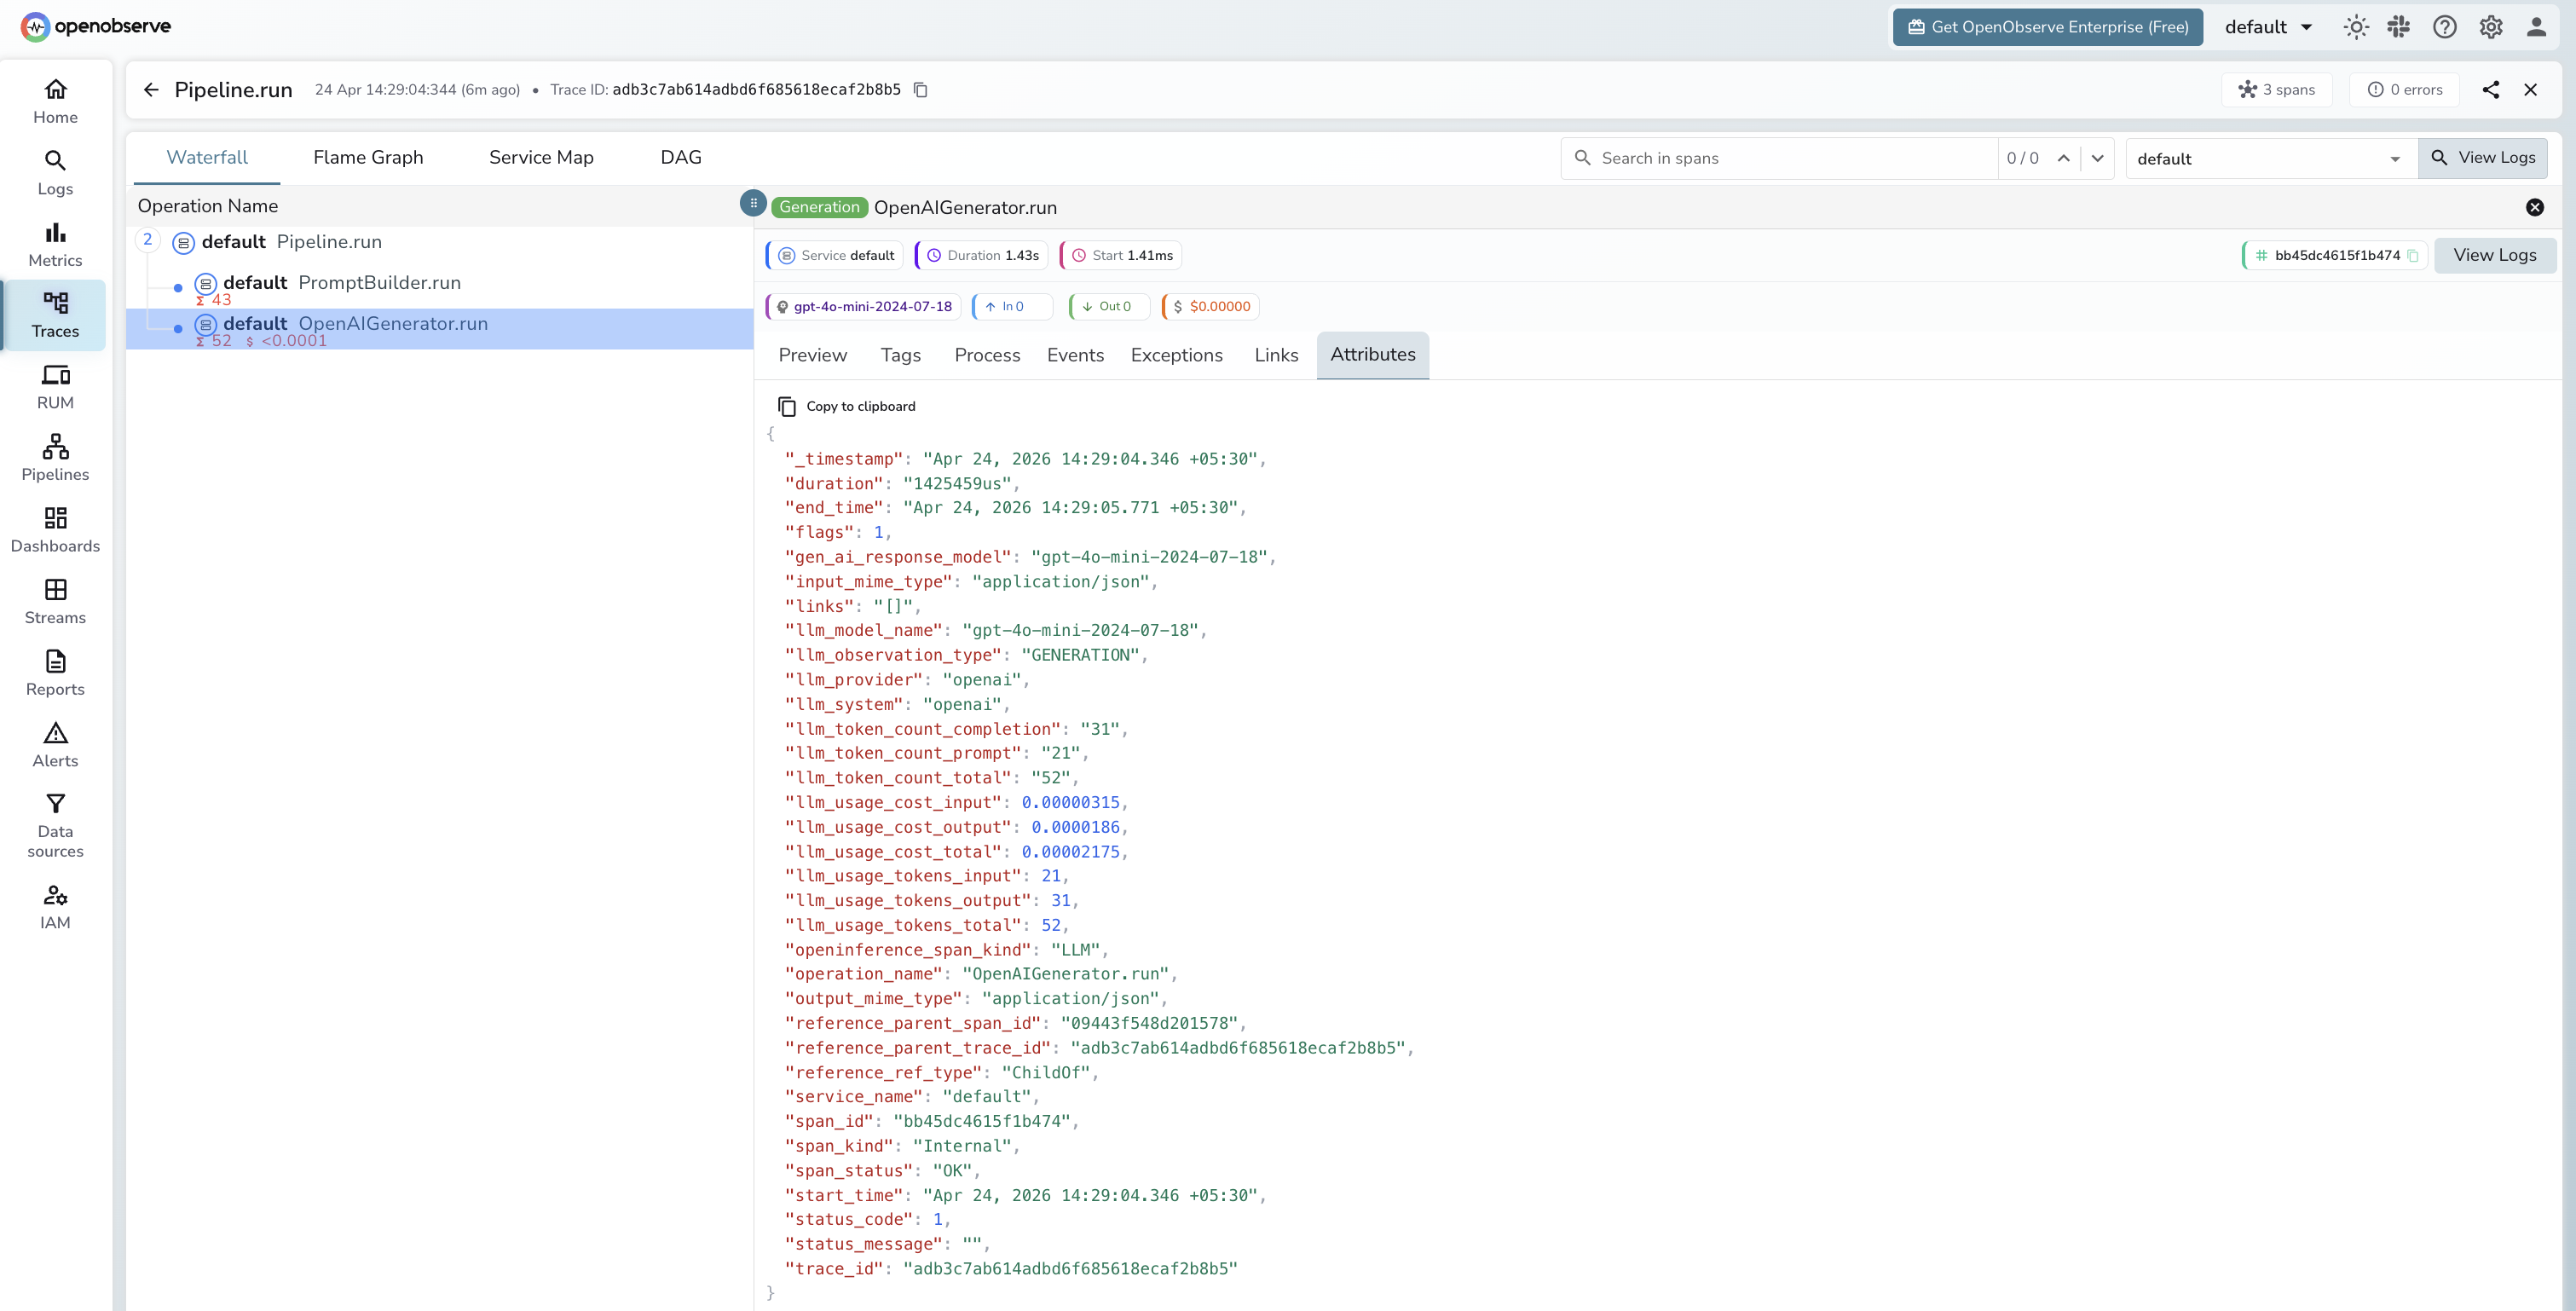
What Gets Captured
Each pipeline.run() produces a root CHAIN span with a child span per component. Generator components produce LLM child spans.
LLM span (OpenAIGenerator)
| Attribute | Description |
|---|---|
openinference_span_kind |
LLM |
operation_name |
OpenAIGenerator.run |
llm_model_name |
Resolved model version (e.g. gpt-4o-mini-2024-07-18) |
llm_provider |
openai |
llm_system |
openai |
llm_observation_type |
GENERATION |
llm_token_count_prompt |
Input token count |
llm_token_count_completion |
Output token count |
llm_token_count_total |
Total tokens consumed |
llm_usage_tokens_input |
Input tokens (numeric) |
llm_usage_tokens_output |
Output tokens (numeric) |
llm_usage_cost_input |
Estimated input cost in USD |
llm_usage_cost_output |
Estimated output cost in USD |
gen_ai_response_model |
Exact model version returned by the API |
duration |
Component execution latency |
span_status |
OK on success, ERROR on failure |
Viewing Traces
- Log in to OpenObserve and navigate to Traces in the left sidebar
- Click any root pipeline span to open the waterfall view
- Expand the tree to see each component span in execution order
- Filter by
operation_name = OpenAIGenerator.runto find LLM spans and inspect token counts
Next Steps
With Haystack instrumented, every pipeline execution is recorded in OpenObserve with a span for each component. From here you can identify which components add the most latency, track token usage per pipeline run, and compare retrieval quality across different configurations.