

Exa → OpenObserve
Capture latency, query text, and result counts for every Exa semantic search call in your AI pipeline. Exa does not have a dedicated OTel instrumentor, so instrumentation uses manual OpenTelemetry spans that wrap each search request.
Prerequisites
- Python 3.8+
- An OpenObserve account (cloud or self-hosted)
- Your OpenObserve organisation ID and Base64-encoded auth token
- An Exa API key
Installation
Configuration
Create a .env file in your project root:
OPENOBSERVE_URL=https://api.openobserve.ai/
OPENOBSERVE_ORG=your_org_id
OPENOBSERVE_AUTH_TOKEN=Basic <your_base64_token>
EXA_API_KEY=your-exa-api-key
Instrumentation
Call openobserve_init() before importing Exa. Wrap each search call in a tracer.start_as_current_span() block and record query attributes and result counts.
from dotenv import load_dotenv
load_dotenv()

from openobserve import openobserve_init
openobserve_init()

from opentelemetry import trace
import os
from exa_py import Exa

tracer = trace.get_tracer(__name__)
client = Exa(api_key=os.environ["EXA_API_KEY"])

def search(query: str, num_results: int = 5):
    with tracer.start_as_current_span("exa.search") as span:
        span.set_attribute("exa.query", query)
        span.set_attribute("exa.num_results", num_results)
        result = client.search(query, num_results=num_results)
        span.set_attribute("exa.result_count", len(result.results))
        return result

result = search("OpenTelemetry distributed tracing")
for r in result.results:
    print(r.title, r.url)
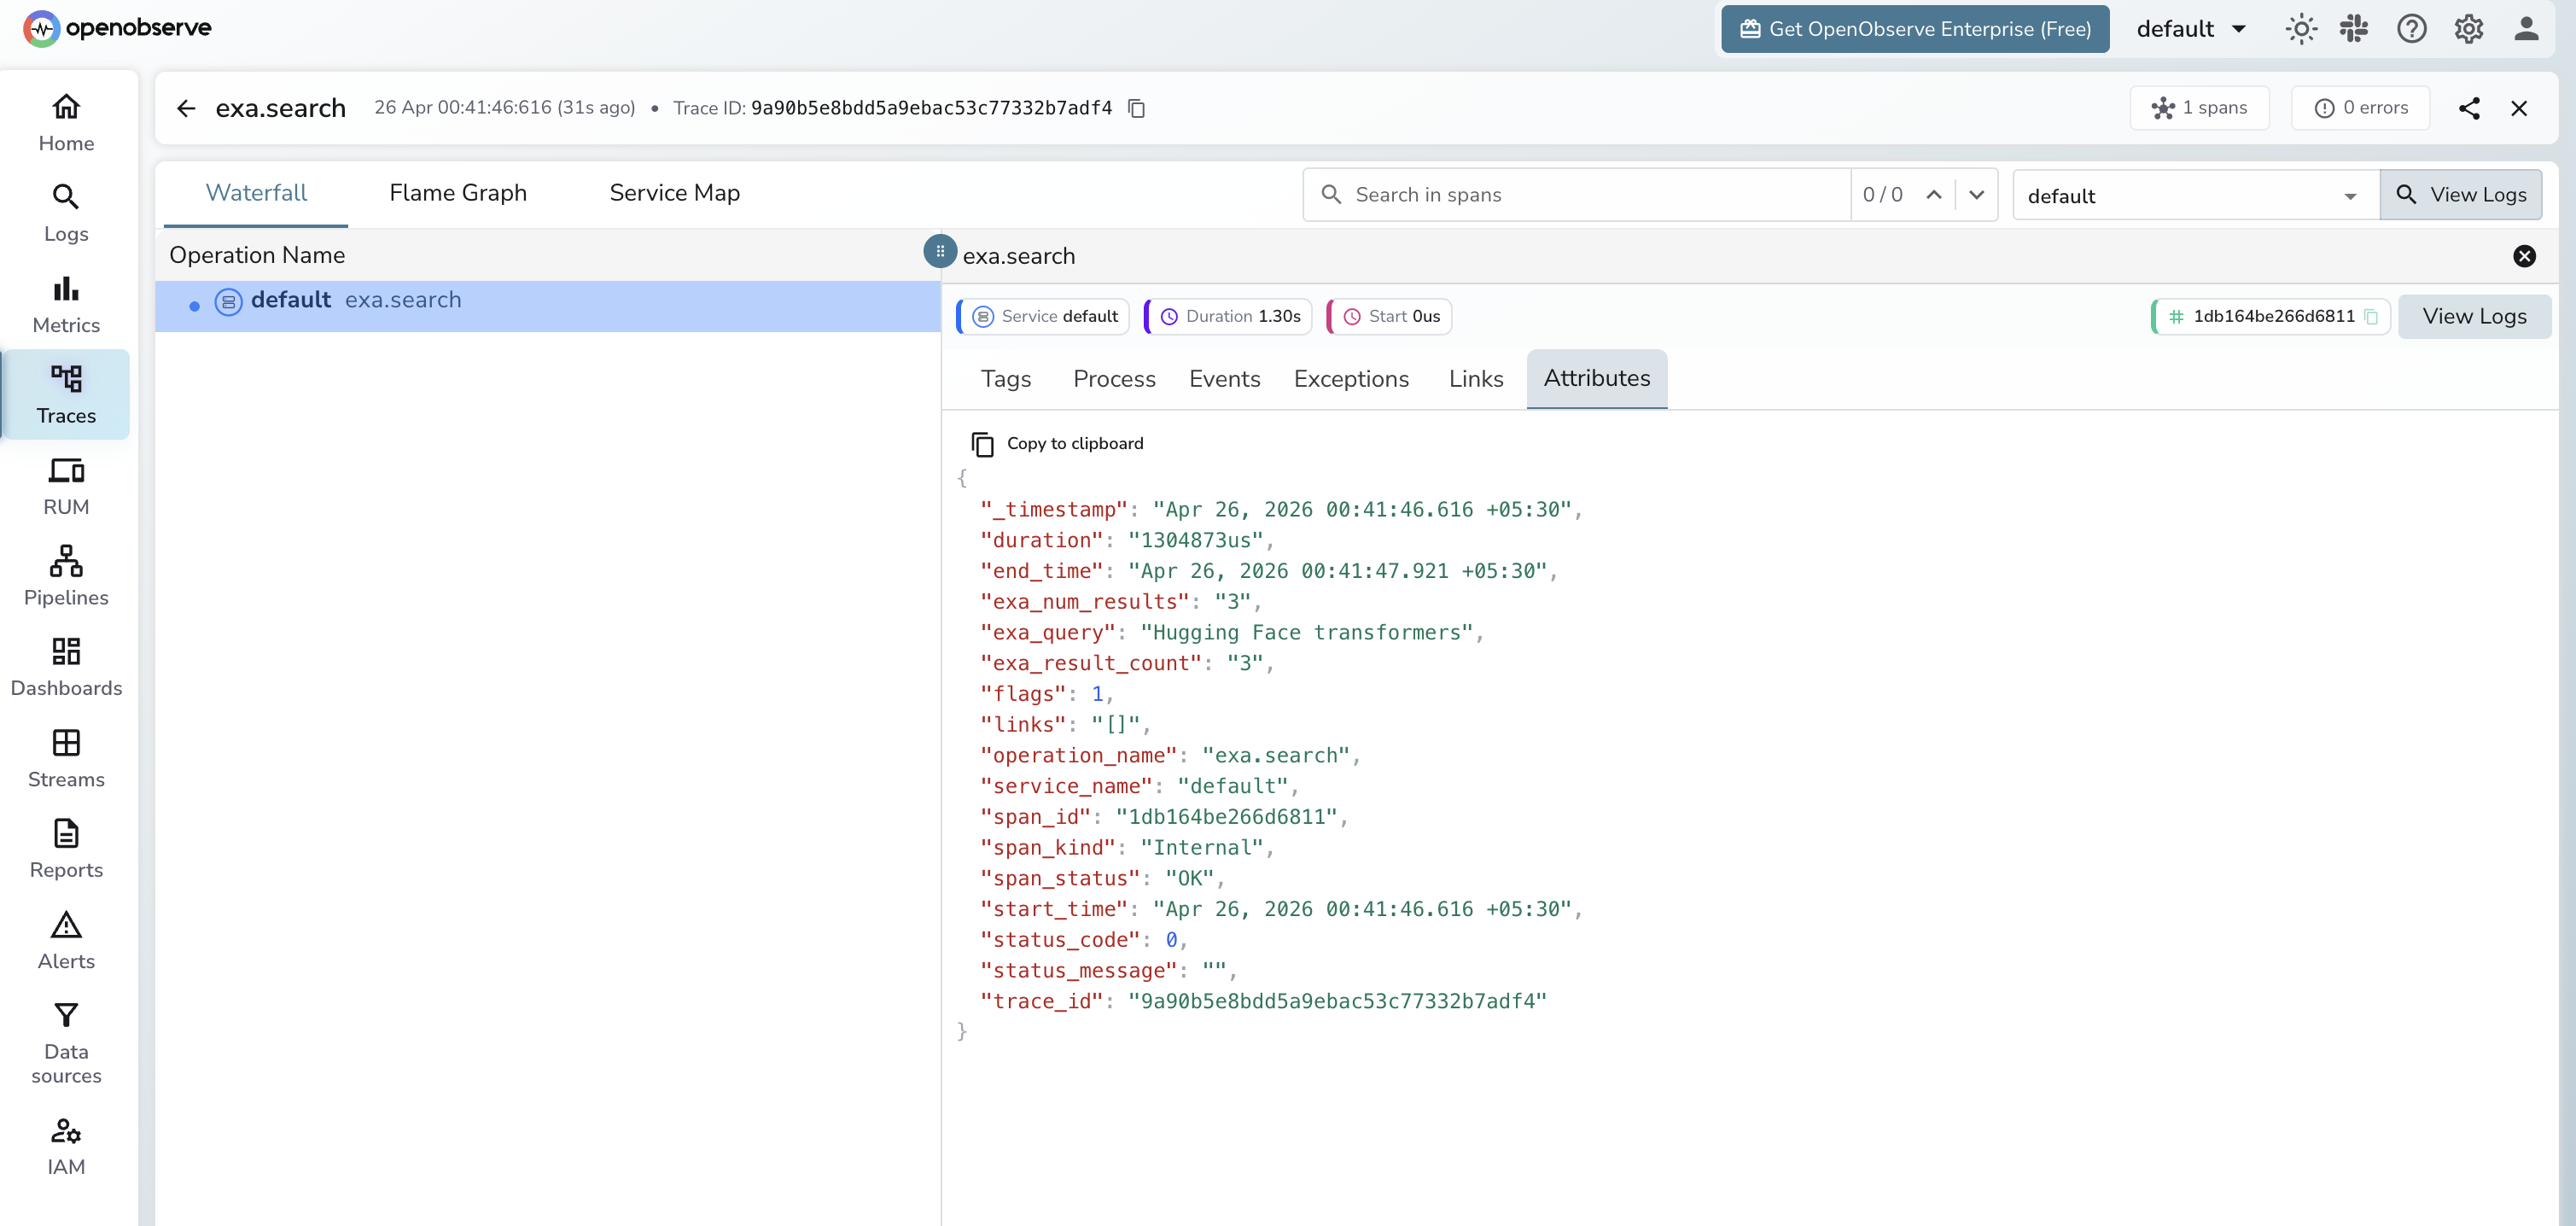
What Gets Captured
| Attribute | Description |
|---|---|
exa_query |
The semantic search query string |
exa_num_results |
Number of results requested |
exa_result_count |
Number of results returned |
span_status |
OK or error status |
duration |
End-to-end search latency |
Viewing Traces
- Log in to OpenObserve and navigate to Traces
- Filter by span name
exa.searchto see all search calls - Click a span to inspect the query and result count
- Sort by duration to find the slowest searches
Next Steps
With Exa instrumented, every search call in your RAG or agent pipeline is recorded in OpenObserve. From here you can track search latency, monitor result quality over time, and correlate search spans with downstream LLM spans.