

Amazon Bedrock Agents → OpenObserve
Automatically capture latency and invocation metadata for every Amazon Bedrock Agent call using the OpenInference Bedrock instrumentation.
Prerequisites
- Python 3.8+
- An OpenObserve account (cloud or self-hosted)
- Your OpenObserve organisation ID and Base64-encoded auth token
- AWS credentials with
AmazonBedrockFullAccesspermissions - A Bedrock Agent with an Agent ID and Alias ID. See Create a Bedrock agent.
Installation
Configuration
Create a .env file in your project root:
OPENOBSERVE_URL=https://api.openobserve.ai/
OPENOBSERVE_ORG=your_org_id
OPENOBSERVE_AUTH_TOKEN=Basic <your_base64_token>

AWS_ACCESS_KEY_ID=your-access-key-id
AWS_SECRET_ACCESS_KEY=your-secret-access-key
AWS_DEFAULT_REGION=your-aws-region
BEDROCK_AGENT_ID=your-agent-id
BEDROCK_AGENT_ALIAS_ID=TSTALIASID
Instrumentation
Call BedrockInstrumentor().instrument() before creating any boto3 client.
from dotenv import load_dotenv
load_dotenv()

from openinference.instrumentation.bedrock import BedrockInstrumentor
from openobserve import openobserve_init

BedrockInstrumentor().instrument()
openobserve_init(resource_attributes={"service.name": "amazon-bedrock-agents"})

import os, uuid, boto3

client = boto3.client(
    "bedrock-agent-runtime",
    region_name=os.environ.get("AWS_DEFAULT_REGION", "us-east-1"),
)

response = client.invoke_agent(
    agentId=os.environ["BEDROCK_AGENT_ID"],
    agentAliasId=os.environ.get("BEDROCK_AGENT_ALIAS_ID", "TSTALIASID"),
    sessionId=str(uuid.uuid4()),
    inputText="What can you help me with?",
)
completion = ""
for event in response.get("completion", []):
    if "chunk" in event:
        completion += event["chunk"]["bytes"].decode("utf-8")
print(completion)
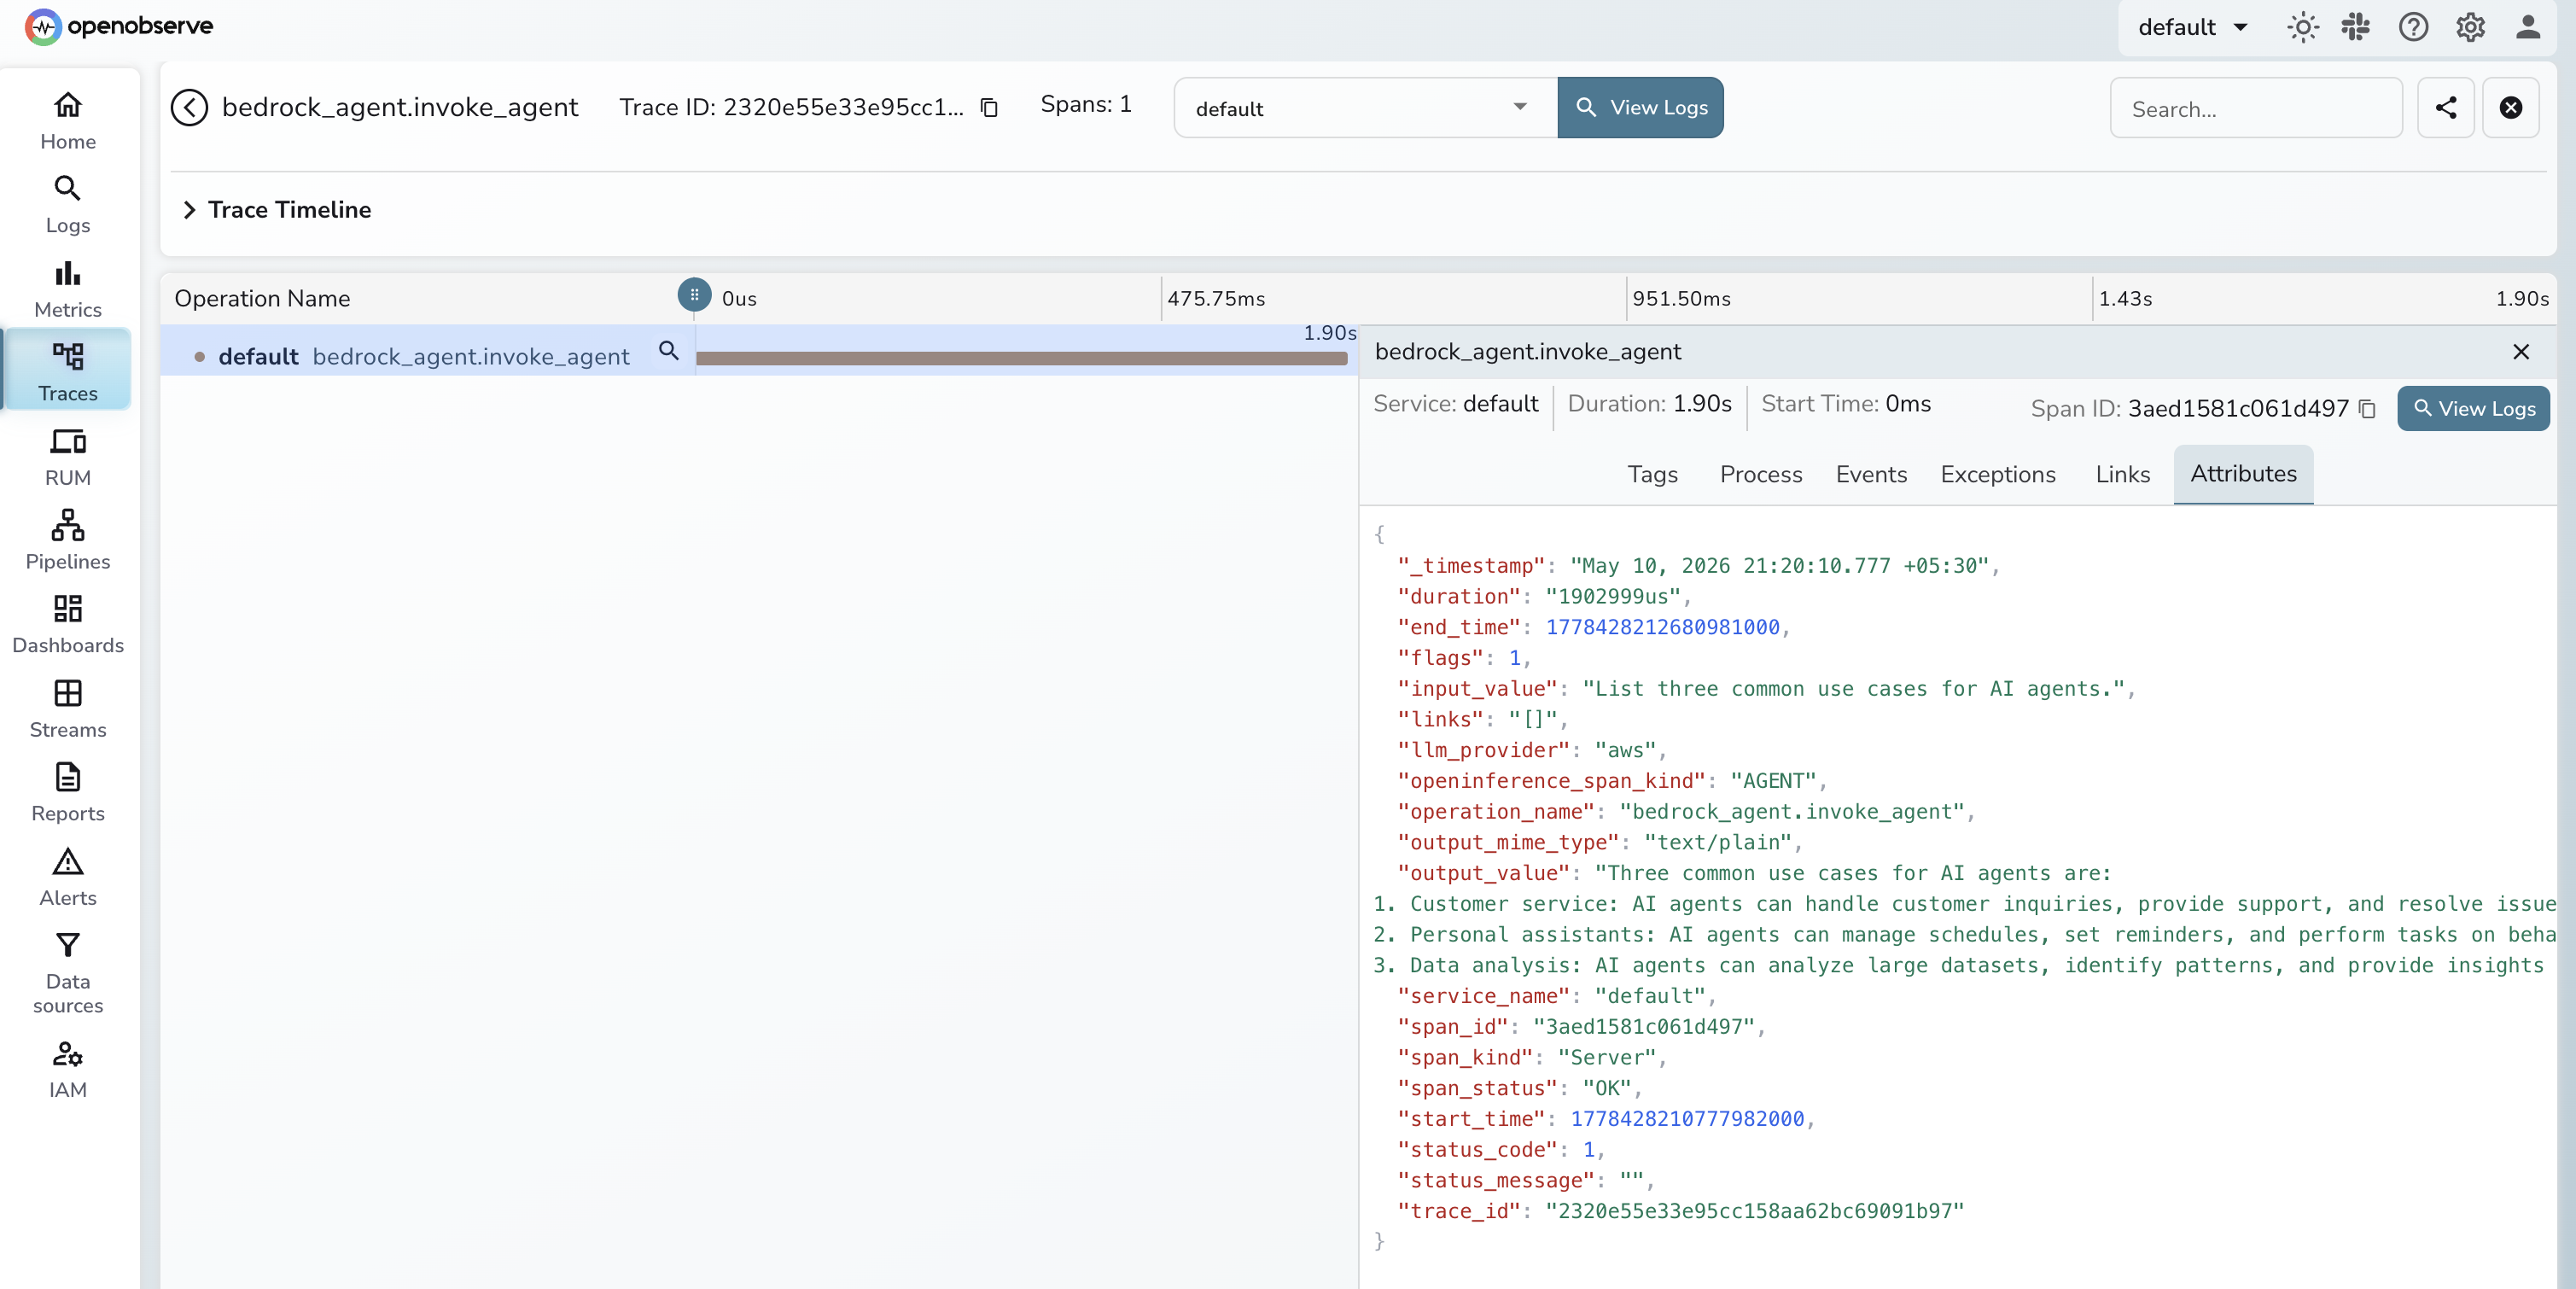
What Gets Captured
| Attribute | Description |
|---|---|
operation_name |
Always bedrock_agent.invoke_agent |
openinference_span_kind |
Always AGENT |
llm_provider |
Always aws |
input_value |
Text sent to the agent |
output_value |
Agent response text |
output_mime_type |
Always text/plain |
span_status |
OK on success, ERROR on failure |
duration |
End-to-end invocation latency |
Viewing Traces
- Log in to OpenObserve and navigate to Traces in the left sidebar
- Click any
bedrock_agent.invoke_agentspan to inspect latency and input/output content
Next Steps
Track agent response times, monitor failure rates, and correlate agent spans with the rest of your application traces.
Read More
Last update:
May 11, 2026