

PostHog → OpenObserve
Capture LLM generation events in PostHog for product analytics while simultaneously exporting structured OTel traces to OpenObserve for observability. The two platforms complement each other: PostHog tracks user behaviour and aggregates LLM usage; OpenObserve stores the full span tree with token counts and latency for debugging.
Prerequisites
- Python 3.8+
- An OpenObserve account (cloud or self-hosted)
- Your OpenObserve organisation ID and Base64-encoded auth token
- A PostHog project API key
- An OpenAI API key (or another LLM provider)
Installation
pip install openobserve-telemetry-sdk openinference-instrumentation-openai posthog openai python-dotenv
Configuration
Create a .env file in your project root:
OPENOBSERVE_URL=https://api.openobserve.ai/
OPENOBSERVE_ORG=your_org_id
OPENOBSERVE_AUTH_TOKEN=Basic <your_base64_token>
OPENAI_API_KEY=your-openai-api-key
POSTHOG_API_KEY=phc_your_project_api_key
POSTHOG_HOST=https://app.posthog.com
Instrumentation
Call OpenAIInstrumentor().instrument() and openobserve_init() before creating any clients. Track each LLM generation in both PostHog and OpenObserve.
from dotenv import load_dotenv
load_dotenv()

from openinference.instrumentation.openai import OpenAIInstrumentor
from openobserve import openobserve_init

OpenAIInstrumentor().instrument()
openobserve_init()

from opentelemetry import trace
import os
import uuid
import posthog
from openai import OpenAI

tracer = trace.get_tracer(__name__)

posthog.api_key = os.environ["POSTHOG_API_KEY"]
posthog.host = os.environ.get("POSTHOG_HOST", "https://app.posthog.com")

client = OpenAI(api_key=os.environ["OPENAI_API_KEY"])

def generate(prompt: str, user_id: str = None) -> str:
    with tracer.start_as_current_span("posthog.llm_generation") as span:
        span.set_attribute("posthog.model", "gpt-4o-mini")
        span.set_attribute("posthog.prompt", prompt[:200])
        response = client.chat.completions.create(
            model="gpt-4o-mini",
            messages=[{"role": "user", "content": prompt}],
            max_tokens=200,
        )
        reply = response.choices[0].message.content
        trace_id = hex(span.get_span_context().trace_id)

        posthog.capture(user_id or str(uuid.uuid4()), "$ai_generation", {
            "$ai_provider": "openai",
            "$ai_model": "gpt-4o-mini",
            "$ai_input_tokens": response.usage.prompt_tokens,
            "$ai_output_tokens": response.usage.completion_tokens,
            "$ai_trace_id": trace_id,
        })
        return reply

result = generate("Explain distributed tracing in one sentence.", user_id="user-123")
print(result)
posthog.shutdown()
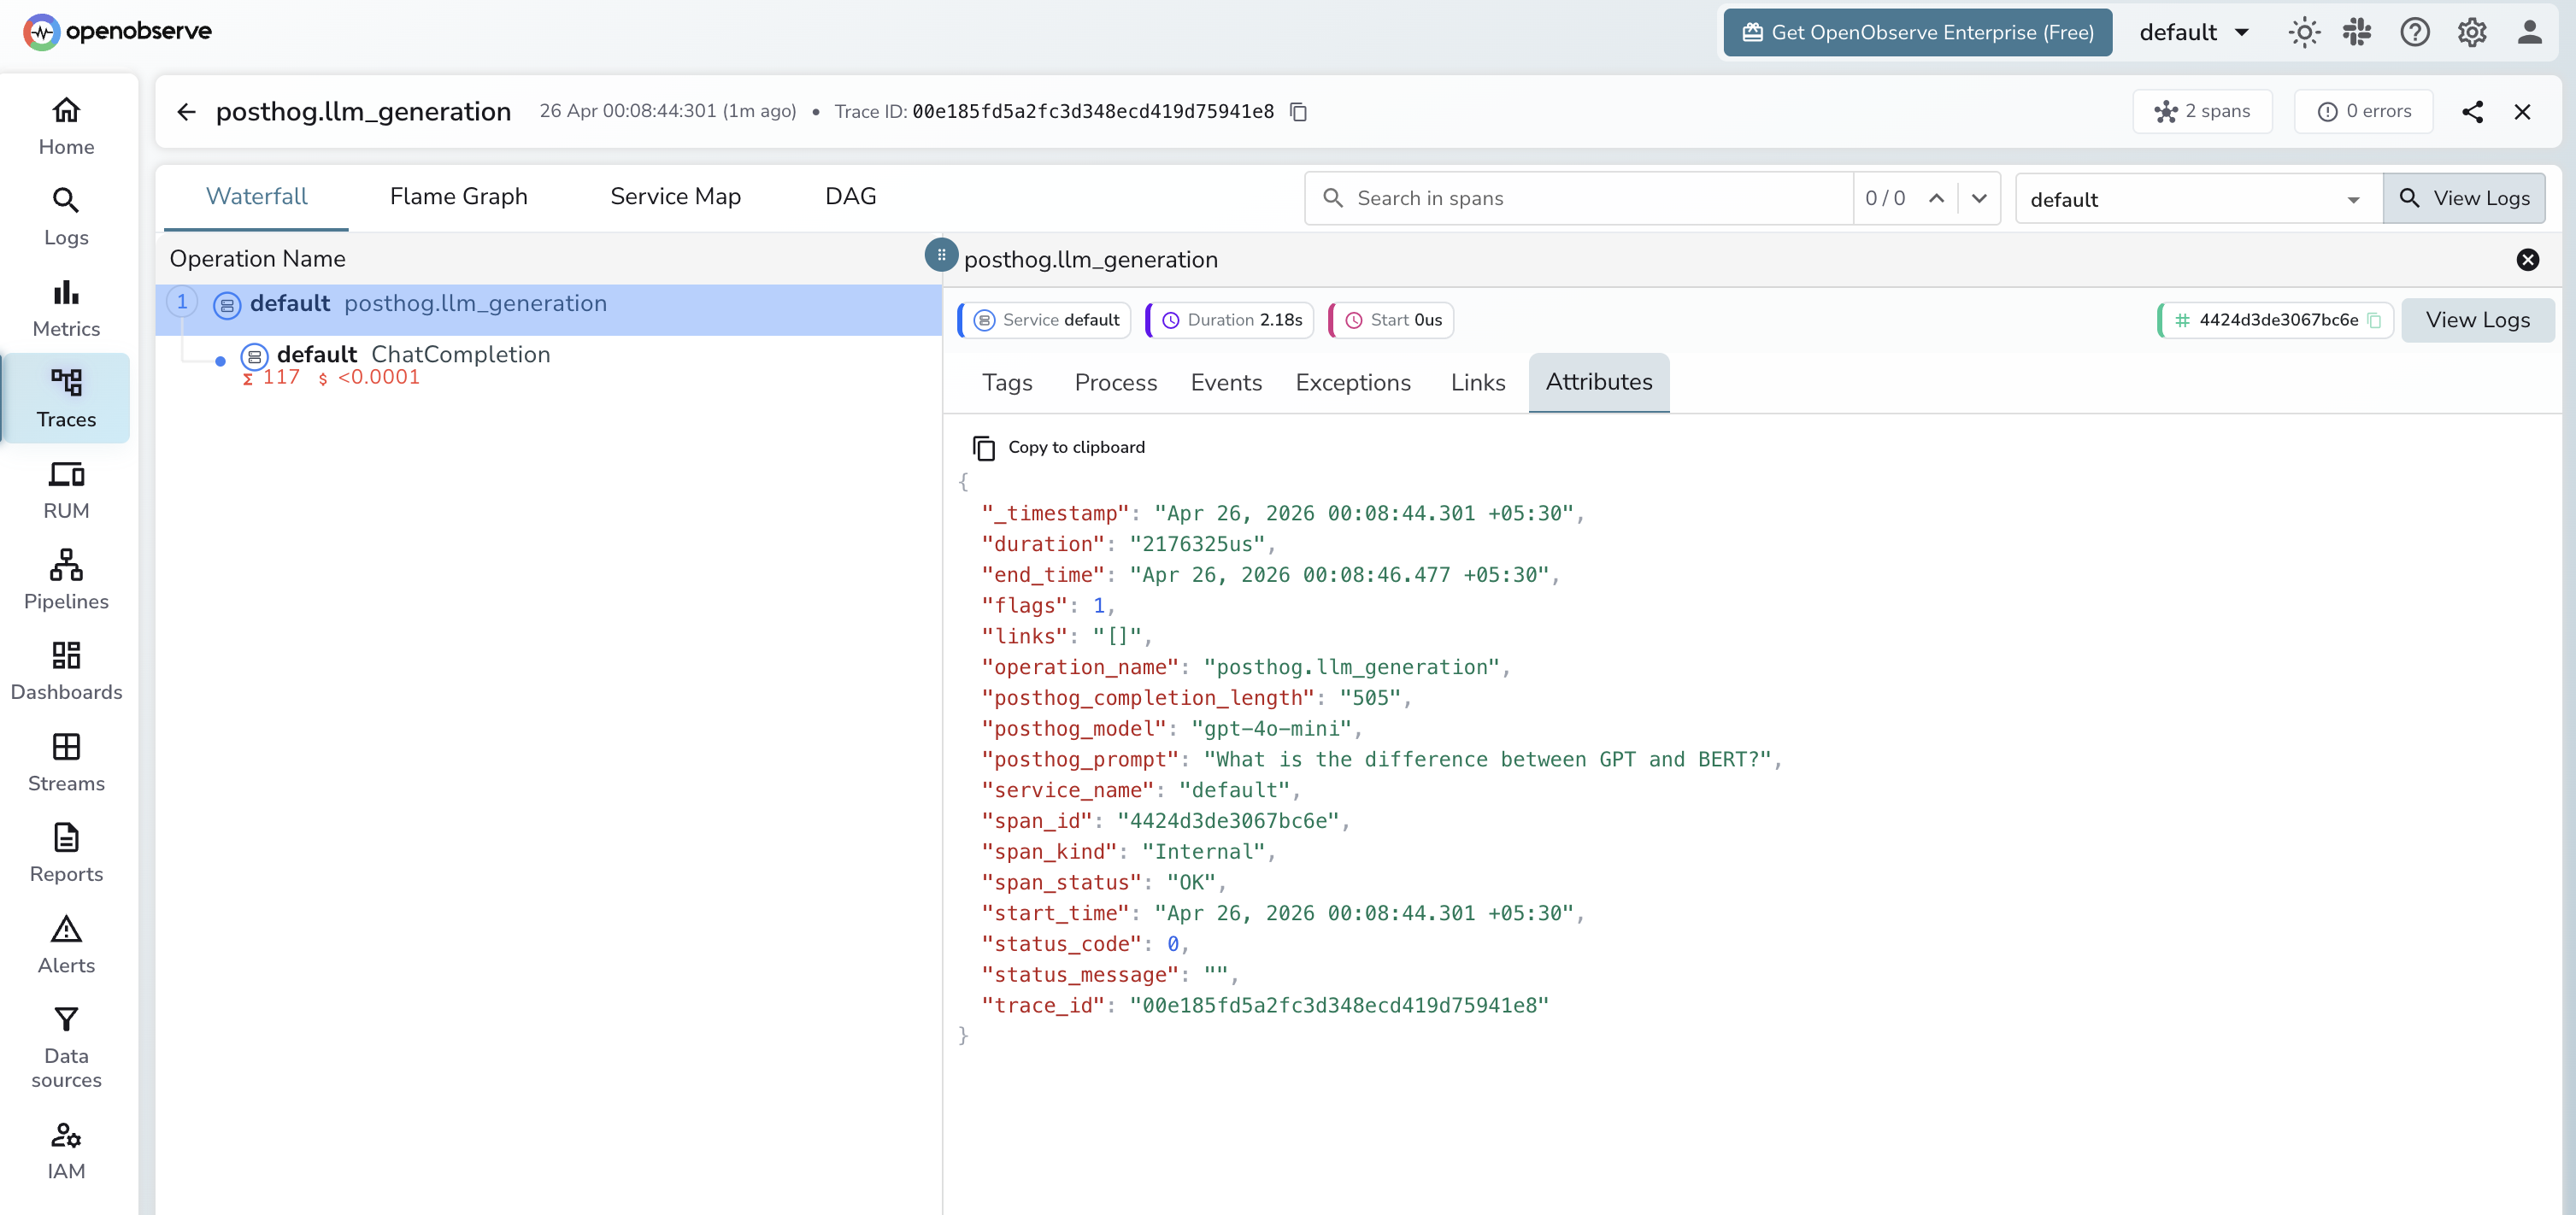
What Gets Captured
In OpenObserve (OTel traces):
| Attribute | Description |
|---|---|
posthog_model |
The model used |
posthog_prompt |
The input prompt |
posthog_completion_length |
Character length of the model response |
llm_token_count_prompt |
Prompt tokens (from OpenAI instrumentor child span) |
llm_token_count_completion |
Completion tokens (from OpenAI instrumentor child span) |
duration |
Request latency |
span_status |
OK or error status |
In PostHog ($ai_generation event):
| Property | Description |
|---|---|
$ai_provider |
LLM provider name |
$ai_model |
Model used |
$ai_input_tokens |
Prompt token count |
$ai_output_tokens |
Completion token count |
$ai_trace_id |
Trace ID for cross-referencing with OpenObserve |
Viewing Traces
- Log in to OpenObserve and navigate to Traces
- Filter by span name
posthog.llm_generationto see all generations - Use
$ai_trace_idin PostHog to cross-reference with the full OTel trace in OpenObserve
Next Steps
With PostHog and OpenObserve both instrumented, you get product-level analytics in PostHog and deep observability in OpenObserve. Set alerts in OpenObserve on latency spikes and use PostHog dashboards to track per-user token spend.