

Langflow → OpenObserve
Capture flow execution latency, inputs, and error rates from your Langflow applications by wrapping API calls in OpenTelemetry spans and sending them to OpenObserve.
Prerequisites
- Langflow running (self-hosted or Docker)
- An OpenObserve account (cloud or self-hosted)
- Your OpenObserve organisation ID and Base64-encoded auth token
- Your Langflow flow ID (visible in the Langflow UI URL when a flow is open)
Installation
Configuration
Create a .env file in your project root:
OPENOBSERVE_URL=http://localhost:5080/
OPENOBSERVE_ORG=default
OPENOBSERVE_AUTH_TOKEN=Basic <your_base64_token>

LANGFLOW_BASE_URL=http://localhost:7860
LANGFLOW_FLOW_ID=<your-flow-id>
LANGFLOW_API_KEY=<your-langflow-api-key>
To find your flow ID, open a flow in the Langflow UI and copy the UUID from the browser URL.
To create a Langflow API key, go to Settings > API Keys in the Langflow UI.
Instrumentation
Wrap each Langflow API call in a manual span to capture flow execution data:
from dotenv import load_dotenv
load_dotenv()

from openobserve import openobserve_init
openobserve_init()

from opentelemetry import trace
import os
import requests
import uuid

tracer = trace.get_tracer(__name__)

base_url = os.environ["LANGFLOW_BASE_URL"]
flow_id = os.environ["LANGFLOW_FLOW_ID"]
api_key = os.environ.get("LANGFLOW_API_KEY", "")

headers = {"Content-Type": "application/json"}
if api_key:
    headers["x-api-key"] = api_key

with tracer.start_as_current_span("langflow.run_flow") as span:
    span.set_attribute("langflow.flow_id", flow_id)
    span.set_attribute("langflow.input", "Explain distributed tracing in one sentence.")

    resp = requests.post(
        f"{base_url}/api/v1/run/{flow_id}",
        headers=headers,
        json={
            "input_value": "Explain distributed tracing in one sentence.",
            "output_type": "chat",
            "input_type": "chat",
            "session_id": str(uuid.uuid4()),
        },
        timeout=30,
    )
    resp.raise_for_status()
    output = str(resp.json().get("outputs", ""))
    span.set_attribute("langflow.output_length", len(output))
    span.set_attribute("span_status", "OK")
    print(output[:200])
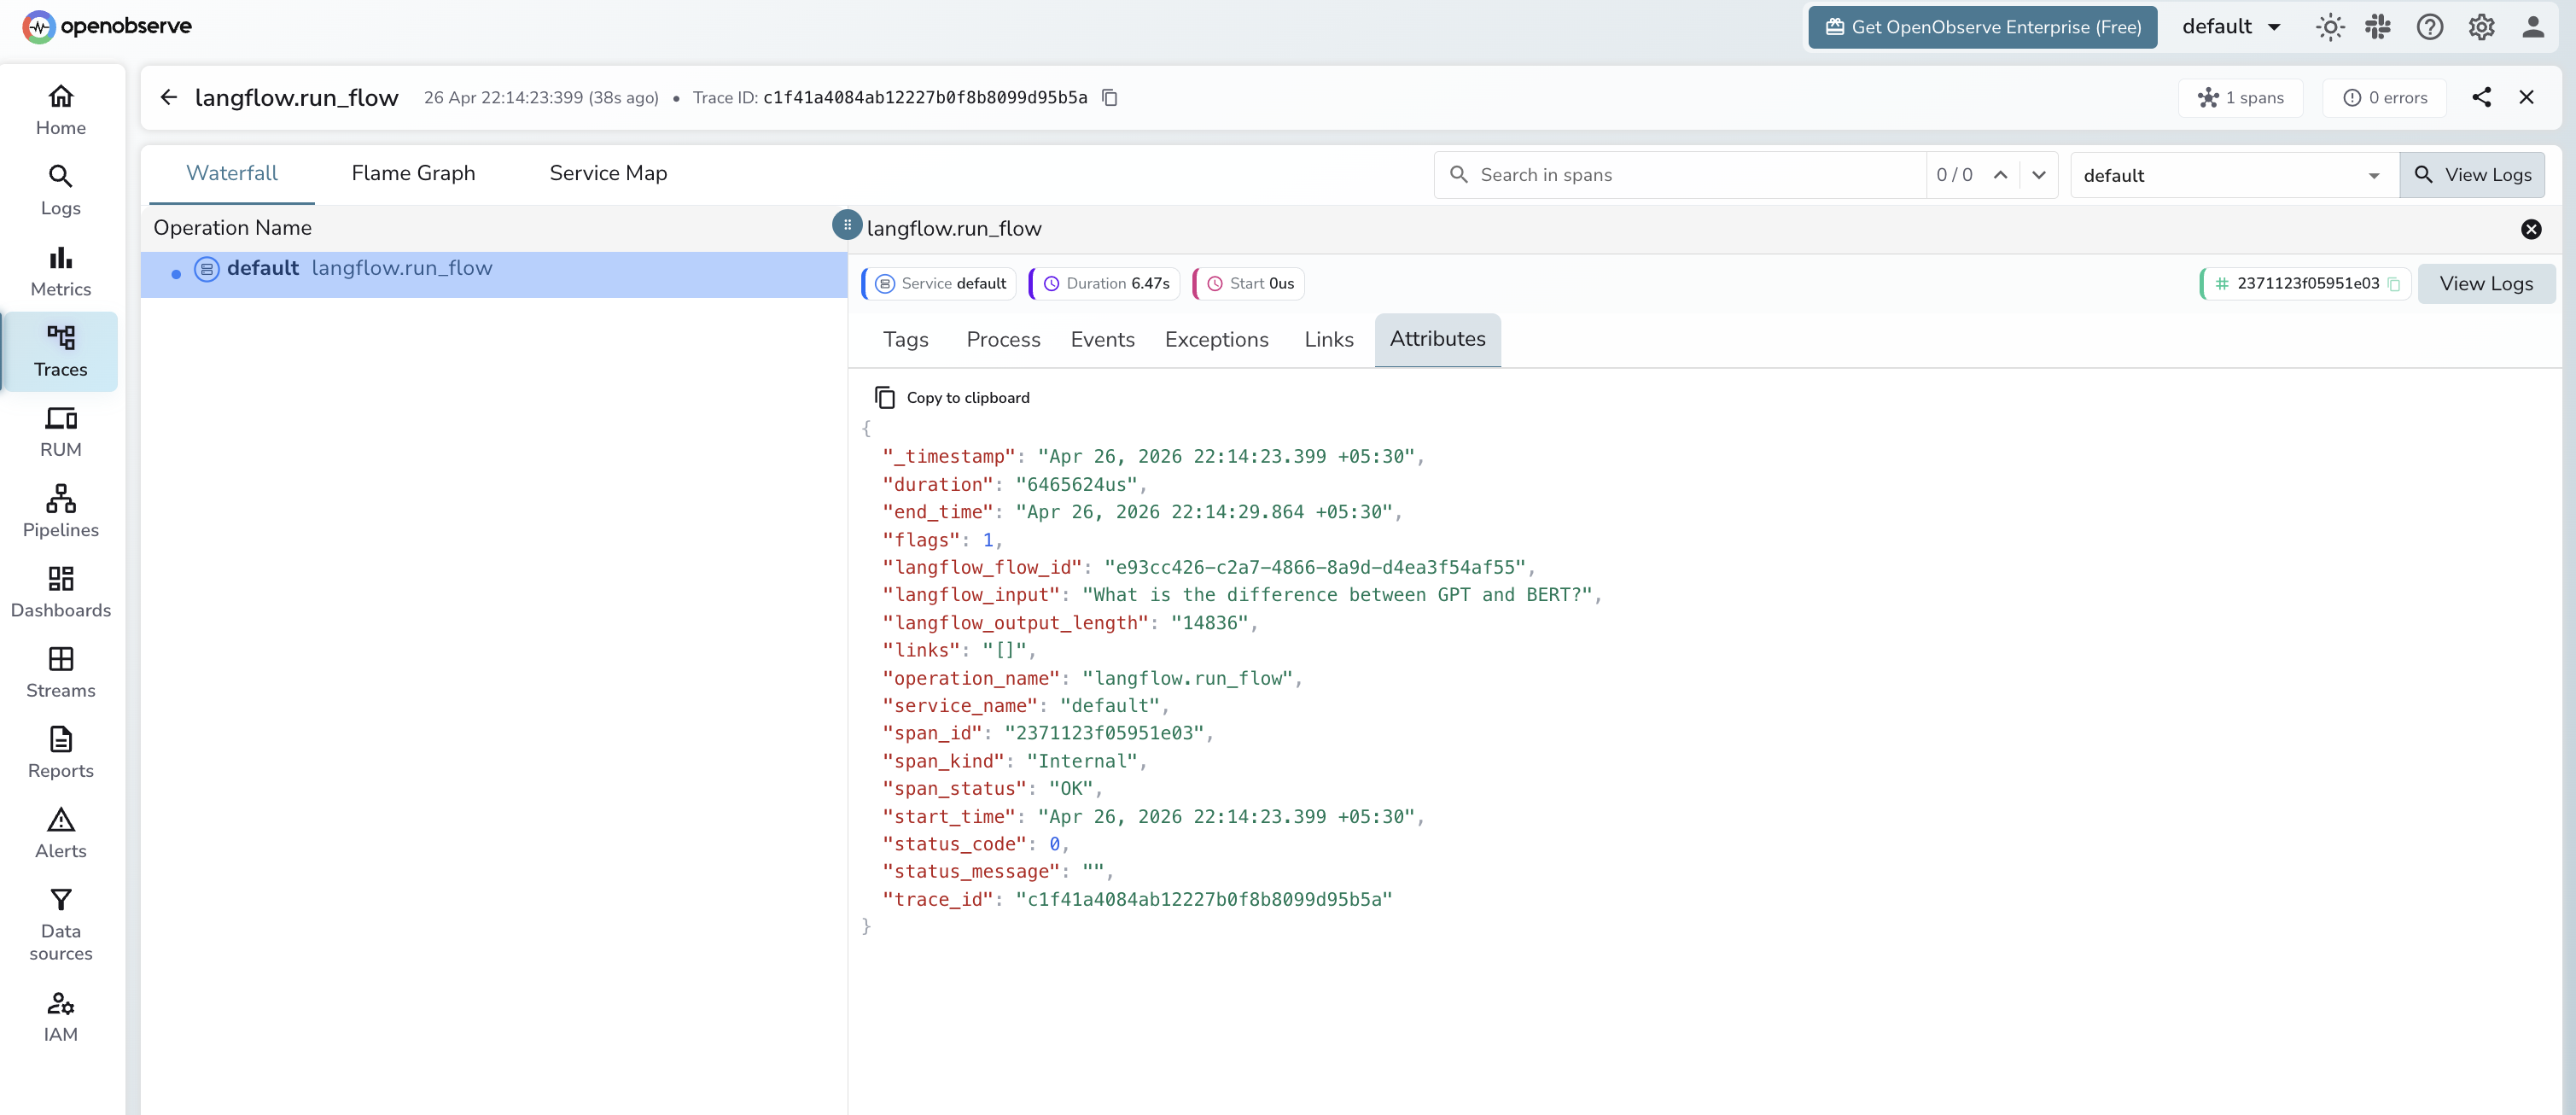
What Gets Captured
Each langflow.run_flow span records:
| Attribute | Description |
|---|---|
langflow_flow_id |
UUID of the flow being executed |
langflow_input |
Input text sent to the flow (first 100 characters) |
langflow_output_length |
Byte length of the full response payload |
span_status |
OK on success, ERROR on failure |
error_message |
Exception detail when span_status is ERROR |
duration |
End-to-end flow execution latency |
Viewing Traces
- Log in to OpenObserve and navigate to Traces
- Filter by
operation_name=langflow.run_flowto see all flow calls - Click a trace to inspect input, output length, and latency
- Filter by
span_status=ERRORto identify failed runs
Next Steps
With Langflow flow executions in OpenObserve, you can track end-to-end latency per flow, alert on error spikes, and correlate Langflow runs with the rest of your application traces.