

Claude Agent SDK → OpenObserve
Capture agent query timing, token usage, turn counts, and error status for every agent run built with Anthropic's Claude Agent SDK. The SDK does not include a built-in OTel instrumentor, so traces are created by wrapping query() calls in manual spans and extracting usage data from ResultMessage.
Prerequisites
- Python 3.10+
- Claude Code CLI installed (
npm install -g @anthropic-ai/claude-codeor existing Claude Code installation) - An OpenObserve account (cloud or self-hosted)
- Your OpenObserve organisation ID and Base64-encoded auth token
- An Anthropic API key
Installation
Configuration
Create a .env file in your project root:
# OpenObserve instance URL
# Default for self-hosted: http://localhost:5080
OPENOBSERVE_URL=https://api.openobserve.ai/

# Your OpenObserve organisation slug or ID
OPENOBSERVE_ORG=your_org_id

# Basic auth token — Base64-encoded "email:password"
OPENOBSERVE_AUTH_TOKEN=Basic <your_base64_token>

# Anthropic API key
ANTHROPIC_API_KEY=your-anthropic-key
Instrumentation
The Claude Agent SDK runs Claude Code CLI as a subprocess and has no built-in OTel instrumentation. Call openobserve_init() to set up the tracer provider, then wrap each query() call in a manual span and extract usage data from the ResultMessage.
import asyncio
from dotenv import load_dotenv
load_dotenv()

from openobserve import openobserve_init
openobserve_init()

from opentelemetry import trace
from claude_agent_sdk import query, ClaudeAgentOptions, ResultMessage

tracer = trace.get_tracer(__name__)


async def run_agent(prompt: str):
    options = ClaudeAgentOptions(
        allowed_tools=["Read", "Glob"],
        permission_mode="dontAsk",
        max_turns=3,
    )
    with tracer.start_as_current_span("claude_agent.query") as span:
        span.set_attribute("claude_agent.prompt", prompt[:100])
        async for message in query(prompt=prompt, options=options):
            if isinstance(message, ResultMessage):
                span.set_attribute("claude_agent.subtype", message.subtype)
                span.set_attribute("claude_agent.num_turns", message.num_turns)
                span.set_attribute("claude_agent.is_error", message.is_error)
                span.set_attribute("claude_agent.duration_api_ms", message.duration_api_ms)
                if message.usage:
                    span.set_attribute("claude_agent.input_tokens", message.usage.get("input_tokens", 0))
                    span.set_attribute("claude_agent.output_tokens", message.usage.get("output_tokens", 0))
                    span.set_attribute("claude_agent.cache_read_input_tokens", message.usage.get("cache_read_input_tokens", 0))


asyncio.run(run_agent("List the Python files in this directory."))
If Claude Code CLI is not on your PATH, pass its location explicitly:
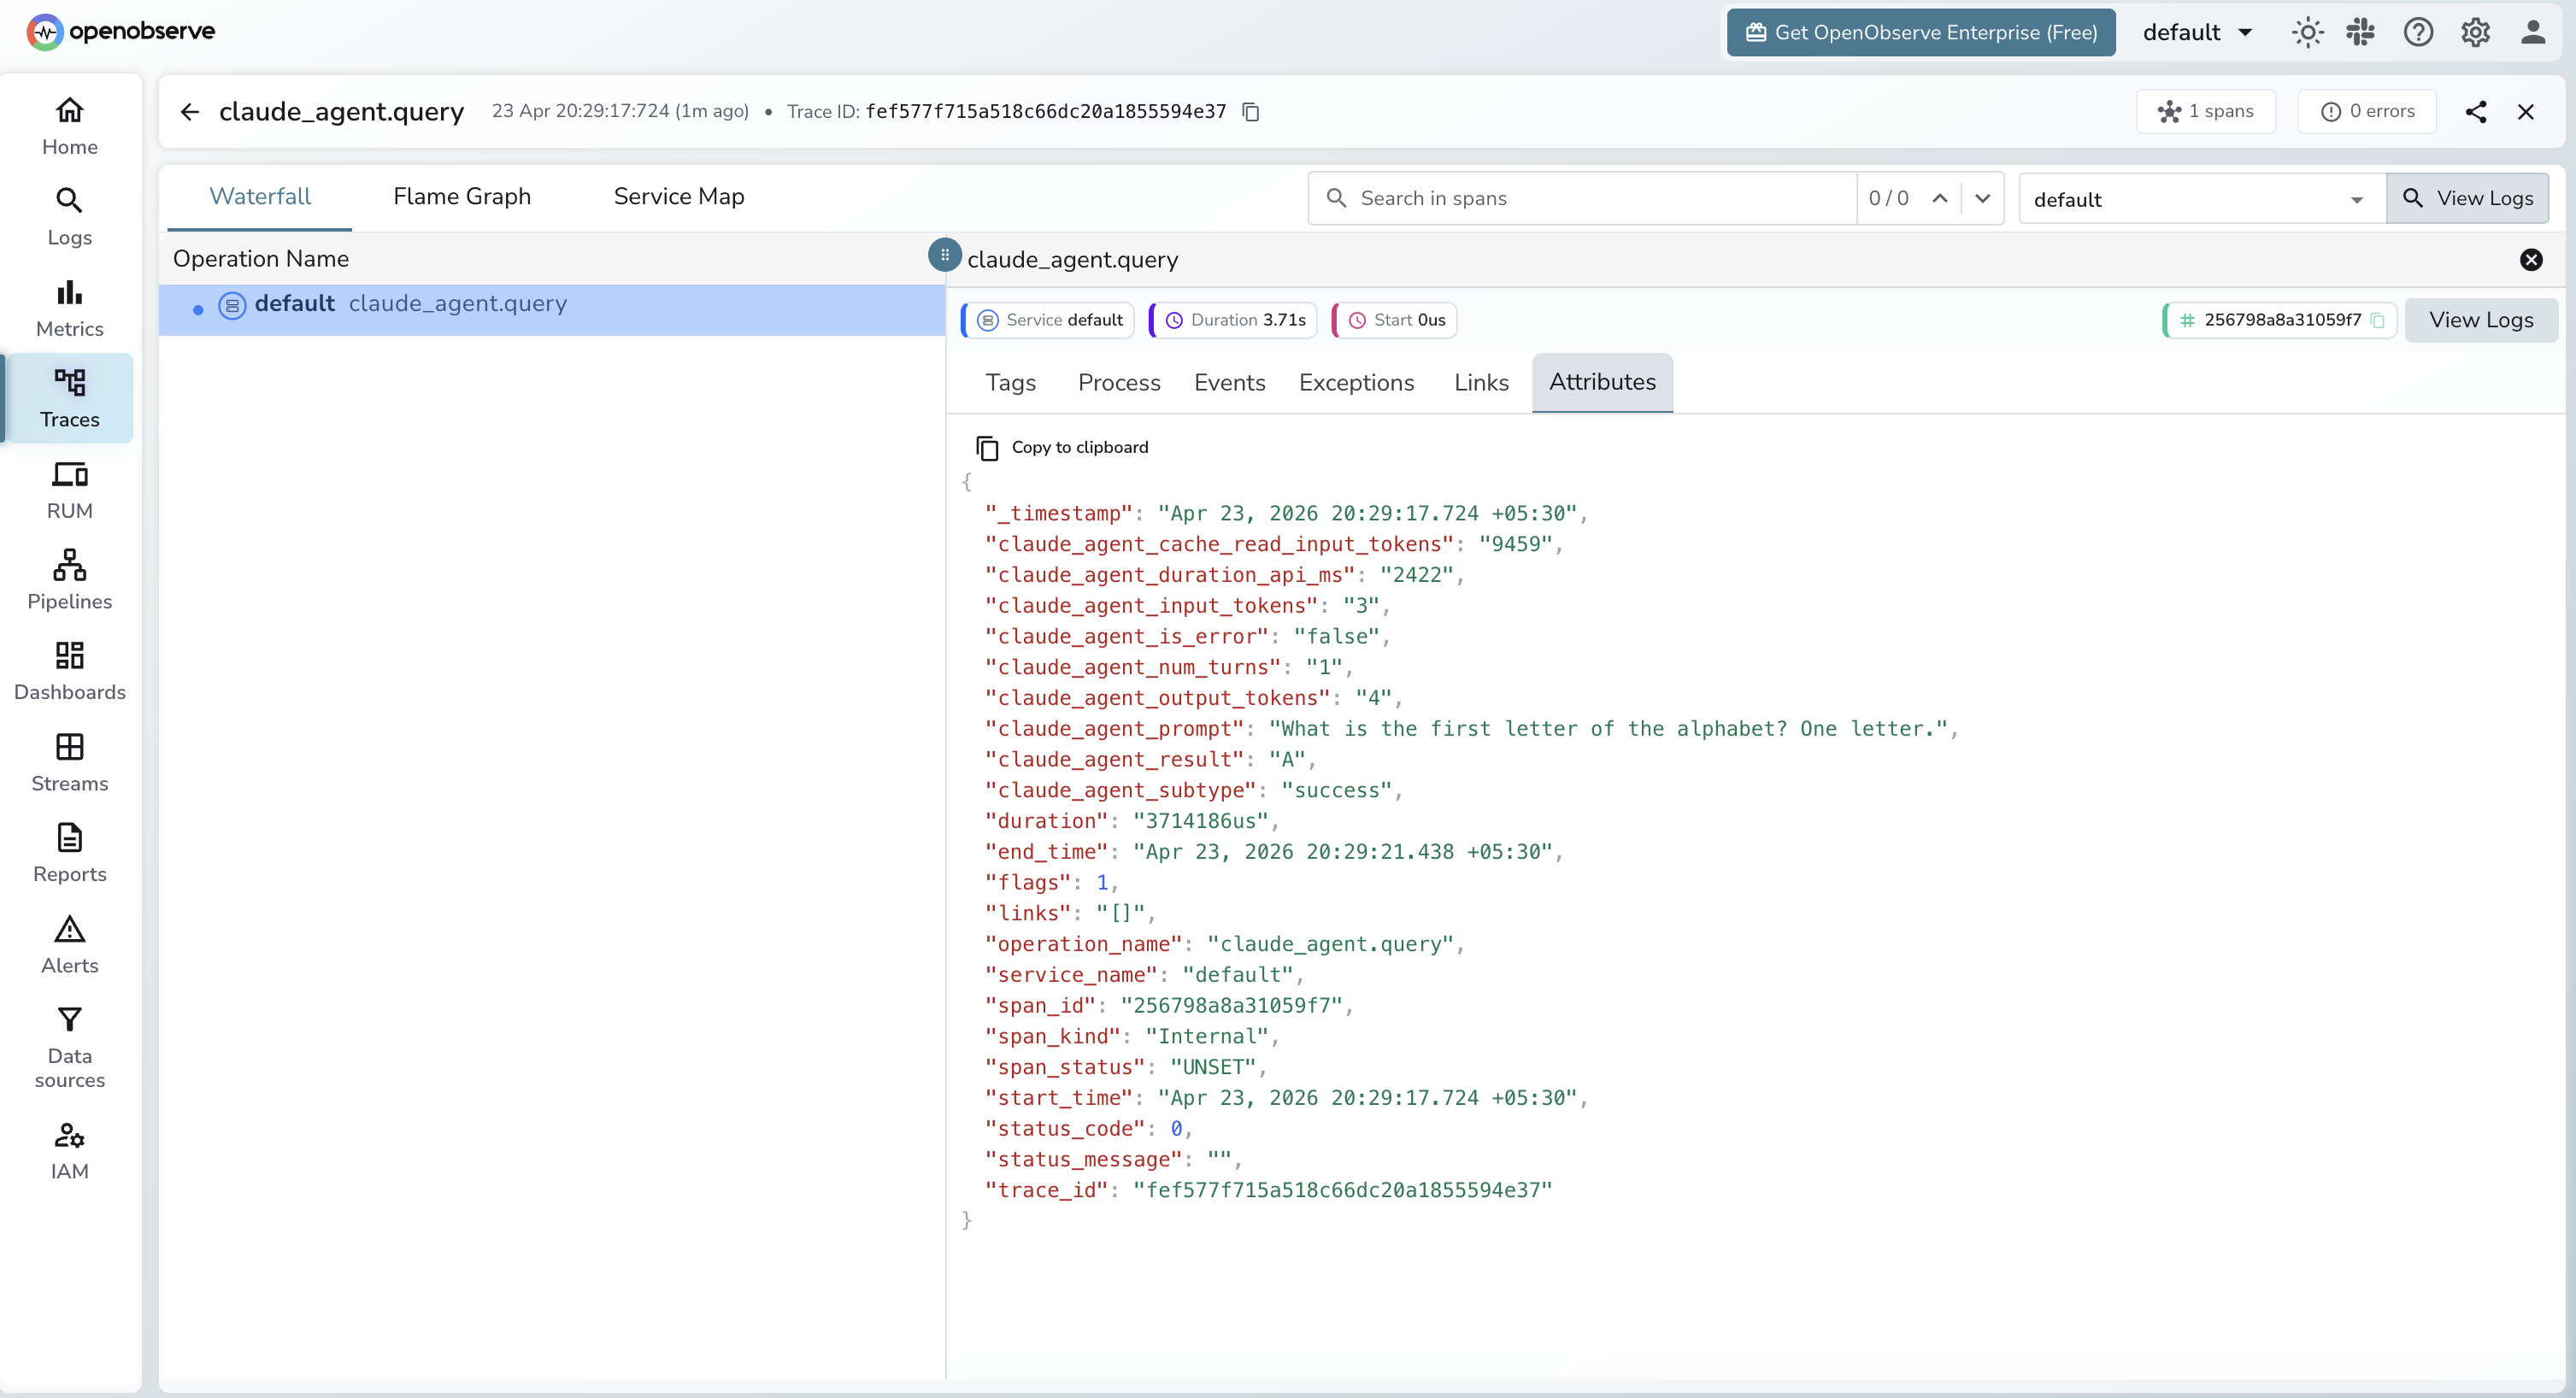
What Gets Captured
Each query() call produces one span containing the following attributes sourced from ResultMessage.
| Attribute | Description |
|---|---|
claude_agent_prompt |
First 100 characters of the prompt |
claude_agent_subtype |
success or error_during_execution |
claude_agent_num_turns |
Number of agentic turns executed |
claude_agent_is_error |
true if the agent encountered an error |
claude_agent_duration_api_ms |
Time spent in API calls (milliseconds) |
claude_agent_input_tokens |
Total input tokens consumed |
claude_agent_output_tokens |
Total output tokens generated |
claude_agent_cache_read_input_tokens |
Input tokens served from prompt cache |
duration |
End-to-end span latency |
Viewing Traces
- Log in to OpenObserve and navigate to Traces
- Filter by operation name
claude_agent.queryto find agent spans - Click any span to inspect token usage, turn count, and duration
- Use
claude_agent_is_error = trueto filter for failed runs
Next Steps
With Claude Agent SDK instrumented, every agent run is recorded in OpenObserve. From here you can track token usage per prompt type, measure multi-turn agent costs, and alert on error runs.