

Zapier → OpenObserve
Capture latency, payload metadata, and status codes for every Zapier webhook trigger fired from your AI application. Zapier's Catch Hook trigger accepts HTTP POST requests and routes them through any of Zapier's 5000+ app integrations. Instrumentation uses manual OpenTelemetry spans wrapping each webhook call.
Prerequisites
- Python 3.8+
- An OpenObserve account (cloud or self-hosted)
- Your OpenObserve organisation ID and Base64-encoded auth token
- A Zapier account with a Zap using Webhooks by Zapier (Catch Hook) as the trigger
Installation
Configuration
In Zapier, create a new Zap and select Webhooks by Zapier as the trigger with event Catch Hook. Copy the generated webhook URL from the setup screen.
Create a .env file in your project root:
OPENOBSERVE_URL=http://localhost:5080/
OPENOBSERVE_ORG=default
OPENOBSERVE_AUTH_TOKEN=Basic <your_base64_token>
ZAPIER_WEBHOOK_URL=https://hooks.zapier.com/hooks/catch/<your_hook_id>/
Instrumentation
Call openobserve_init() before making requests. Wrap each webhook POST in a manual span.
from dotenv import load_dotenv
load_dotenv()

from openobserve import openobserve_init
openobserve_init()

from opentelemetry import trace
import os
import requests

tracer = trace.get_tracer(__name__)
webhook_url = os.environ["ZAPIER_WEBHOOK_URL"]

def trigger_zap(topic: str, question: str):
    with tracer.start_as_current_span("zapier.webhook_trigger") as span:
        span.set_attribute("zapier.topic", topic)
        span.set_attribute("zapier.question", question[:100])
        resp = requests.post(
            webhook_url,
            json={"topic": topic, "question": question},
            timeout=15,
        )
        span.set_attribute("zapier.status_code", resp.status_code)
        span.set_attribute("span_status", "OK" if resp.ok else "ERROR")
        return resp.json()

result = trigger_zap("observability", "What is distributed tracing?")
print(result)

trace.get_tracer_provider().force_flush()
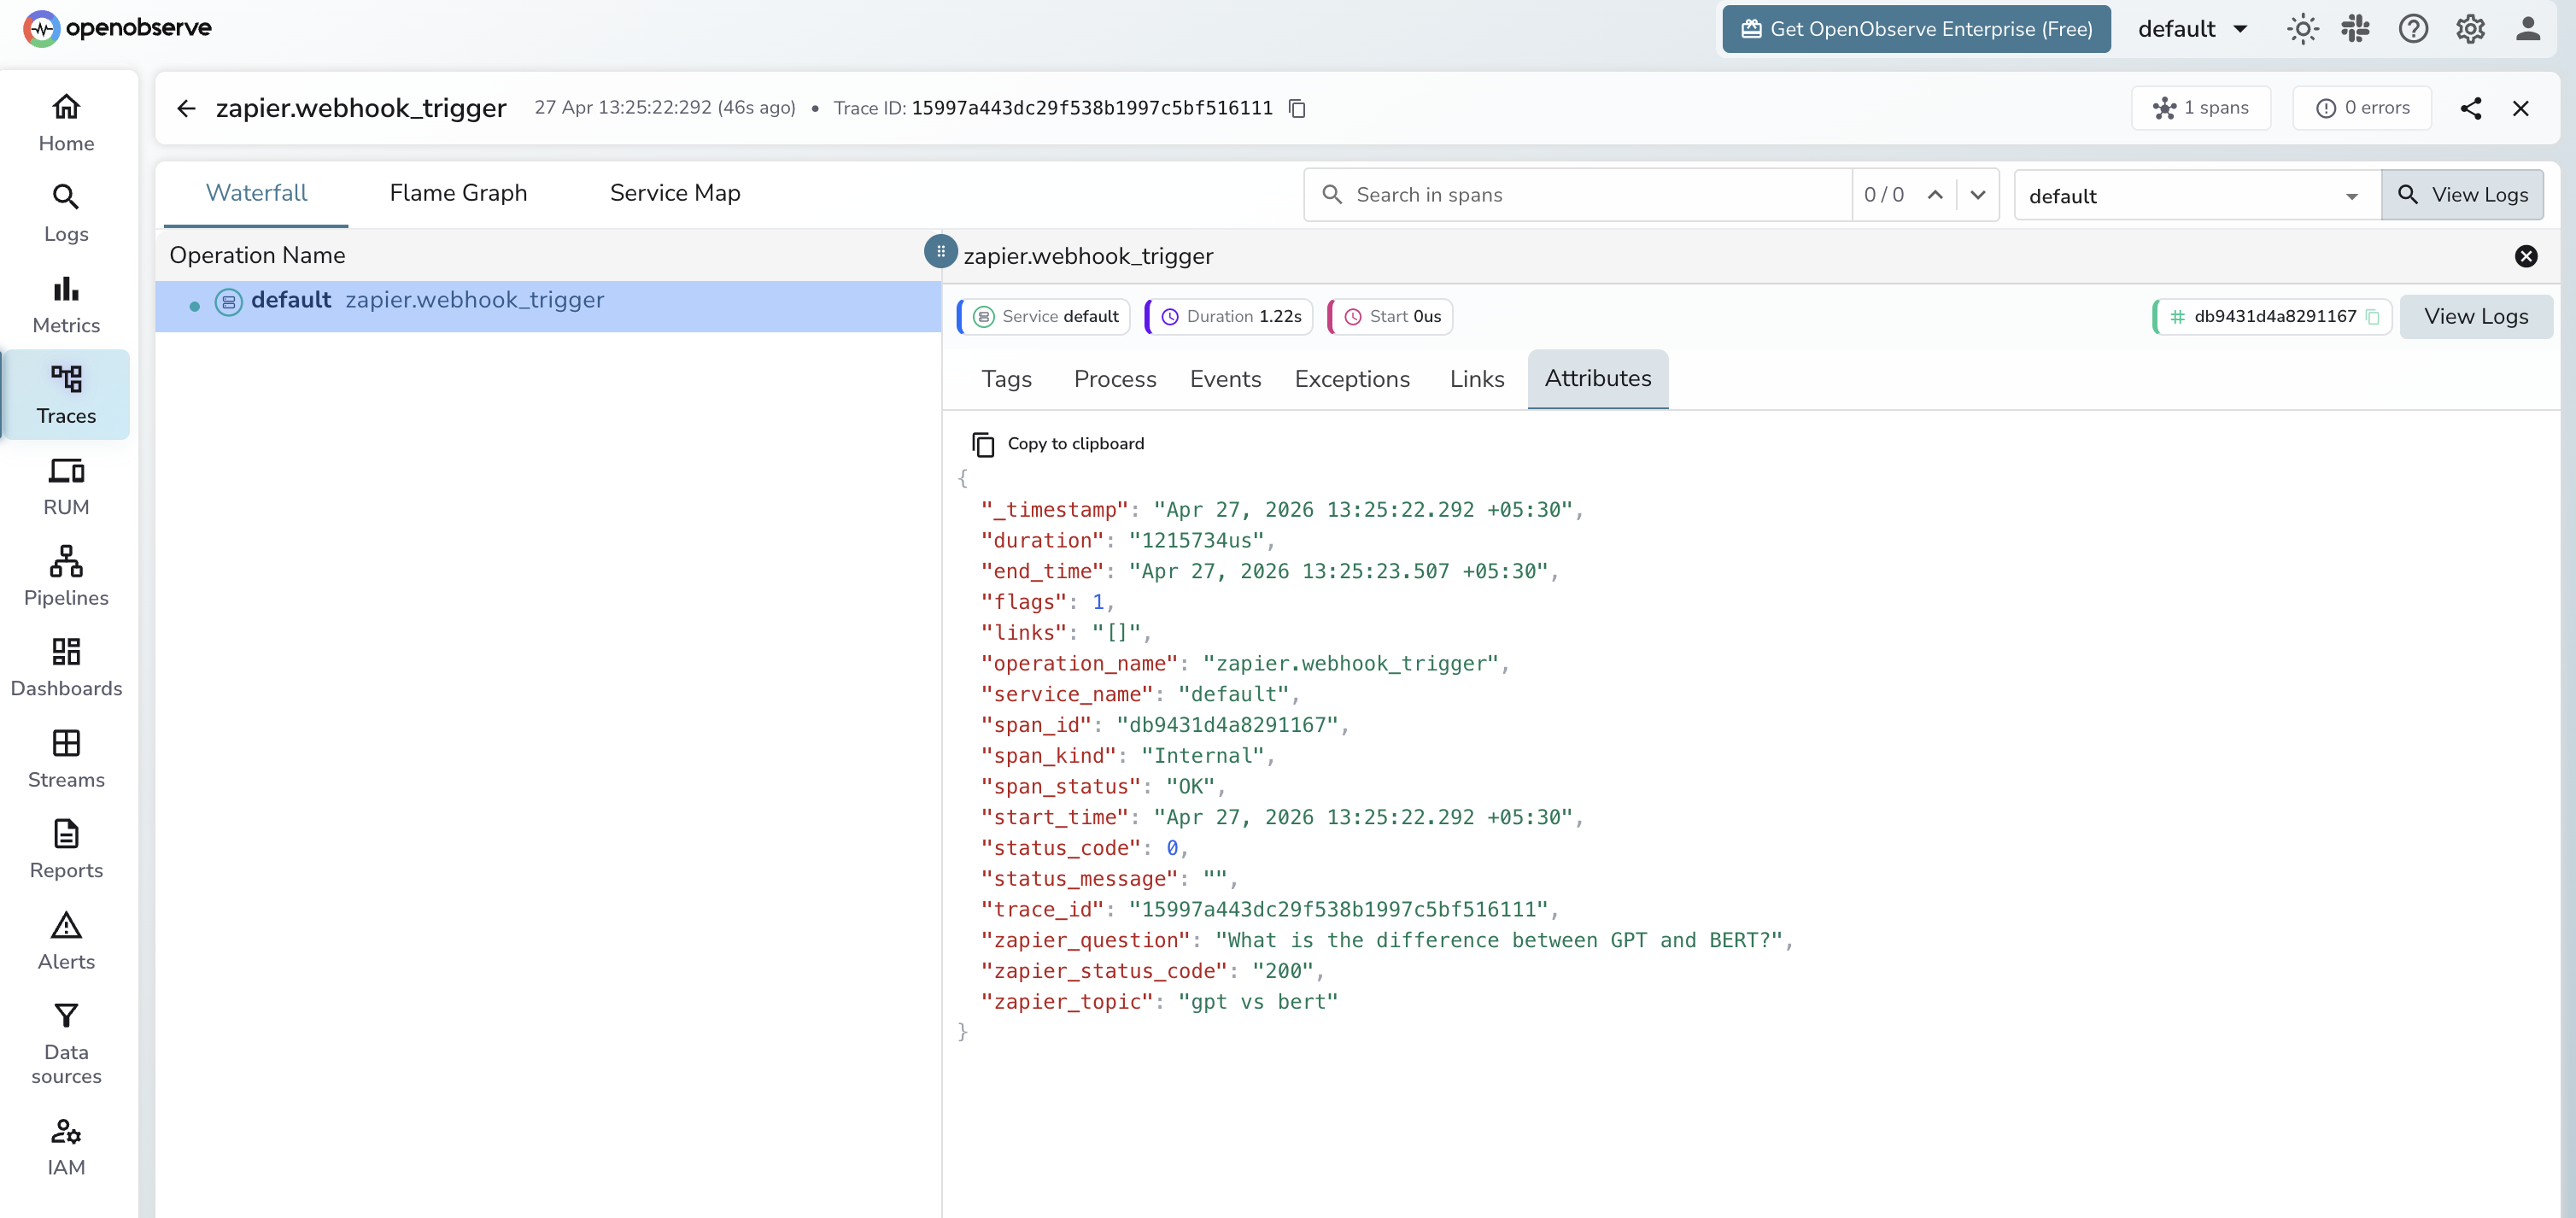
What Gets Captured
| Attribute | Description |
|---|---|
operation_name |
zapier.webhook_trigger |
zapier_topic |
Topic label set on the span |
zapier_question |
Payload text passed to the webhook (truncated to 100 chars) |
zapier_status_code |
HTTP response status code from Zapier (e.g. 200) |
span_status |
OK on success, ERROR on failure |
duration |
End-to-end webhook call latency |
Viewing Traces
- Log in to OpenObserve and navigate to Traces
- Filter by
operation_name=zapier.webhook_triggerto see all webhook calls - Expand a span to inspect
zapier_topicandzapier_questionalongside latency - Filter by
span_status=ERRORto find failed webhook calls
Next Steps
With Zapier instrumented, every webhook trigger is recorded in OpenObserve. From here you can monitor trigger latency, track payload metadata per event type, and alert on error rates across automations.