

LobeChat → OpenObserve
Capture per-request latency and status codes for every chat completion processed by LobeChat. LobeChat is a self-hosted ChatGPT-like application with built-in OpenTelemetry support. Pass OTLP environment variables at startup and traces flow directly into OpenObserve.
Prerequisites
- Docker
- An OpenObserve account (cloud or self-hosted)
- Your OpenObserve organisation ID and Base64-encoded auth token
- An API key for at least one LLM provider (e.g. OpenAI)
Installation
Pull the LobeChat image:
Configuration
Start LobeChat with ENABLE_TELEMETRY=1 and the standard OTLP environment variables. The exporter appends /v1/traces to OTEL_EXPORTER_OTLP_ENDPOINT automatically, so set the endpoint without the path suffix.
docker run -d --name lobechat \
  -p 3210:3210 \
  -e OPENAI_API_KEY=your_openai_api_key \
  -e OPENAI_MODEL_LIST=gpt-4o-mini \
  -e ENABLE_TELEMETRY=1 \
  -e OTEL_EXPORTER_OTLP_ENDPOINT=http://host.docker.internal:5080/api/default \
  -e "OTEL_EXPORTER_OTLP_HEADERS=Authorization=Basic <your_base64_token>" \
  -e OTEL_SERVICE_NAME=lobechat \
  lobehub/lobe-chat:latest
For OpenObserve Cloud replace the endpoint and token:
OTEL_EXPORTER_OTLP_ENDPOINT=https://api.openobserve.ai/api/your_org_id
OTEL_EXPORTER_OTLP_HEADERS=Authorization=Basic <your_base64_token>
OPENAI_MODEL_LIST restricts the available models. Without it LobeChat may default to a model your account cannot access, causing all requests to fail with no spans emitted.
Viewing Traces
Open LobeChat at http://localhost:3210, select a model, and send a chat message. Each request appears in OpenObserve as a server span on the /webapi/chat/openai route.
- Log in to OpenObserve and navigate to Traces
- Filter by
service_name = lobechat - Each span covers the full round-trip from the browser request to the LLM provider response
- Use
http_status_codeto identify failed requests - Sort by
durationto find slow completions
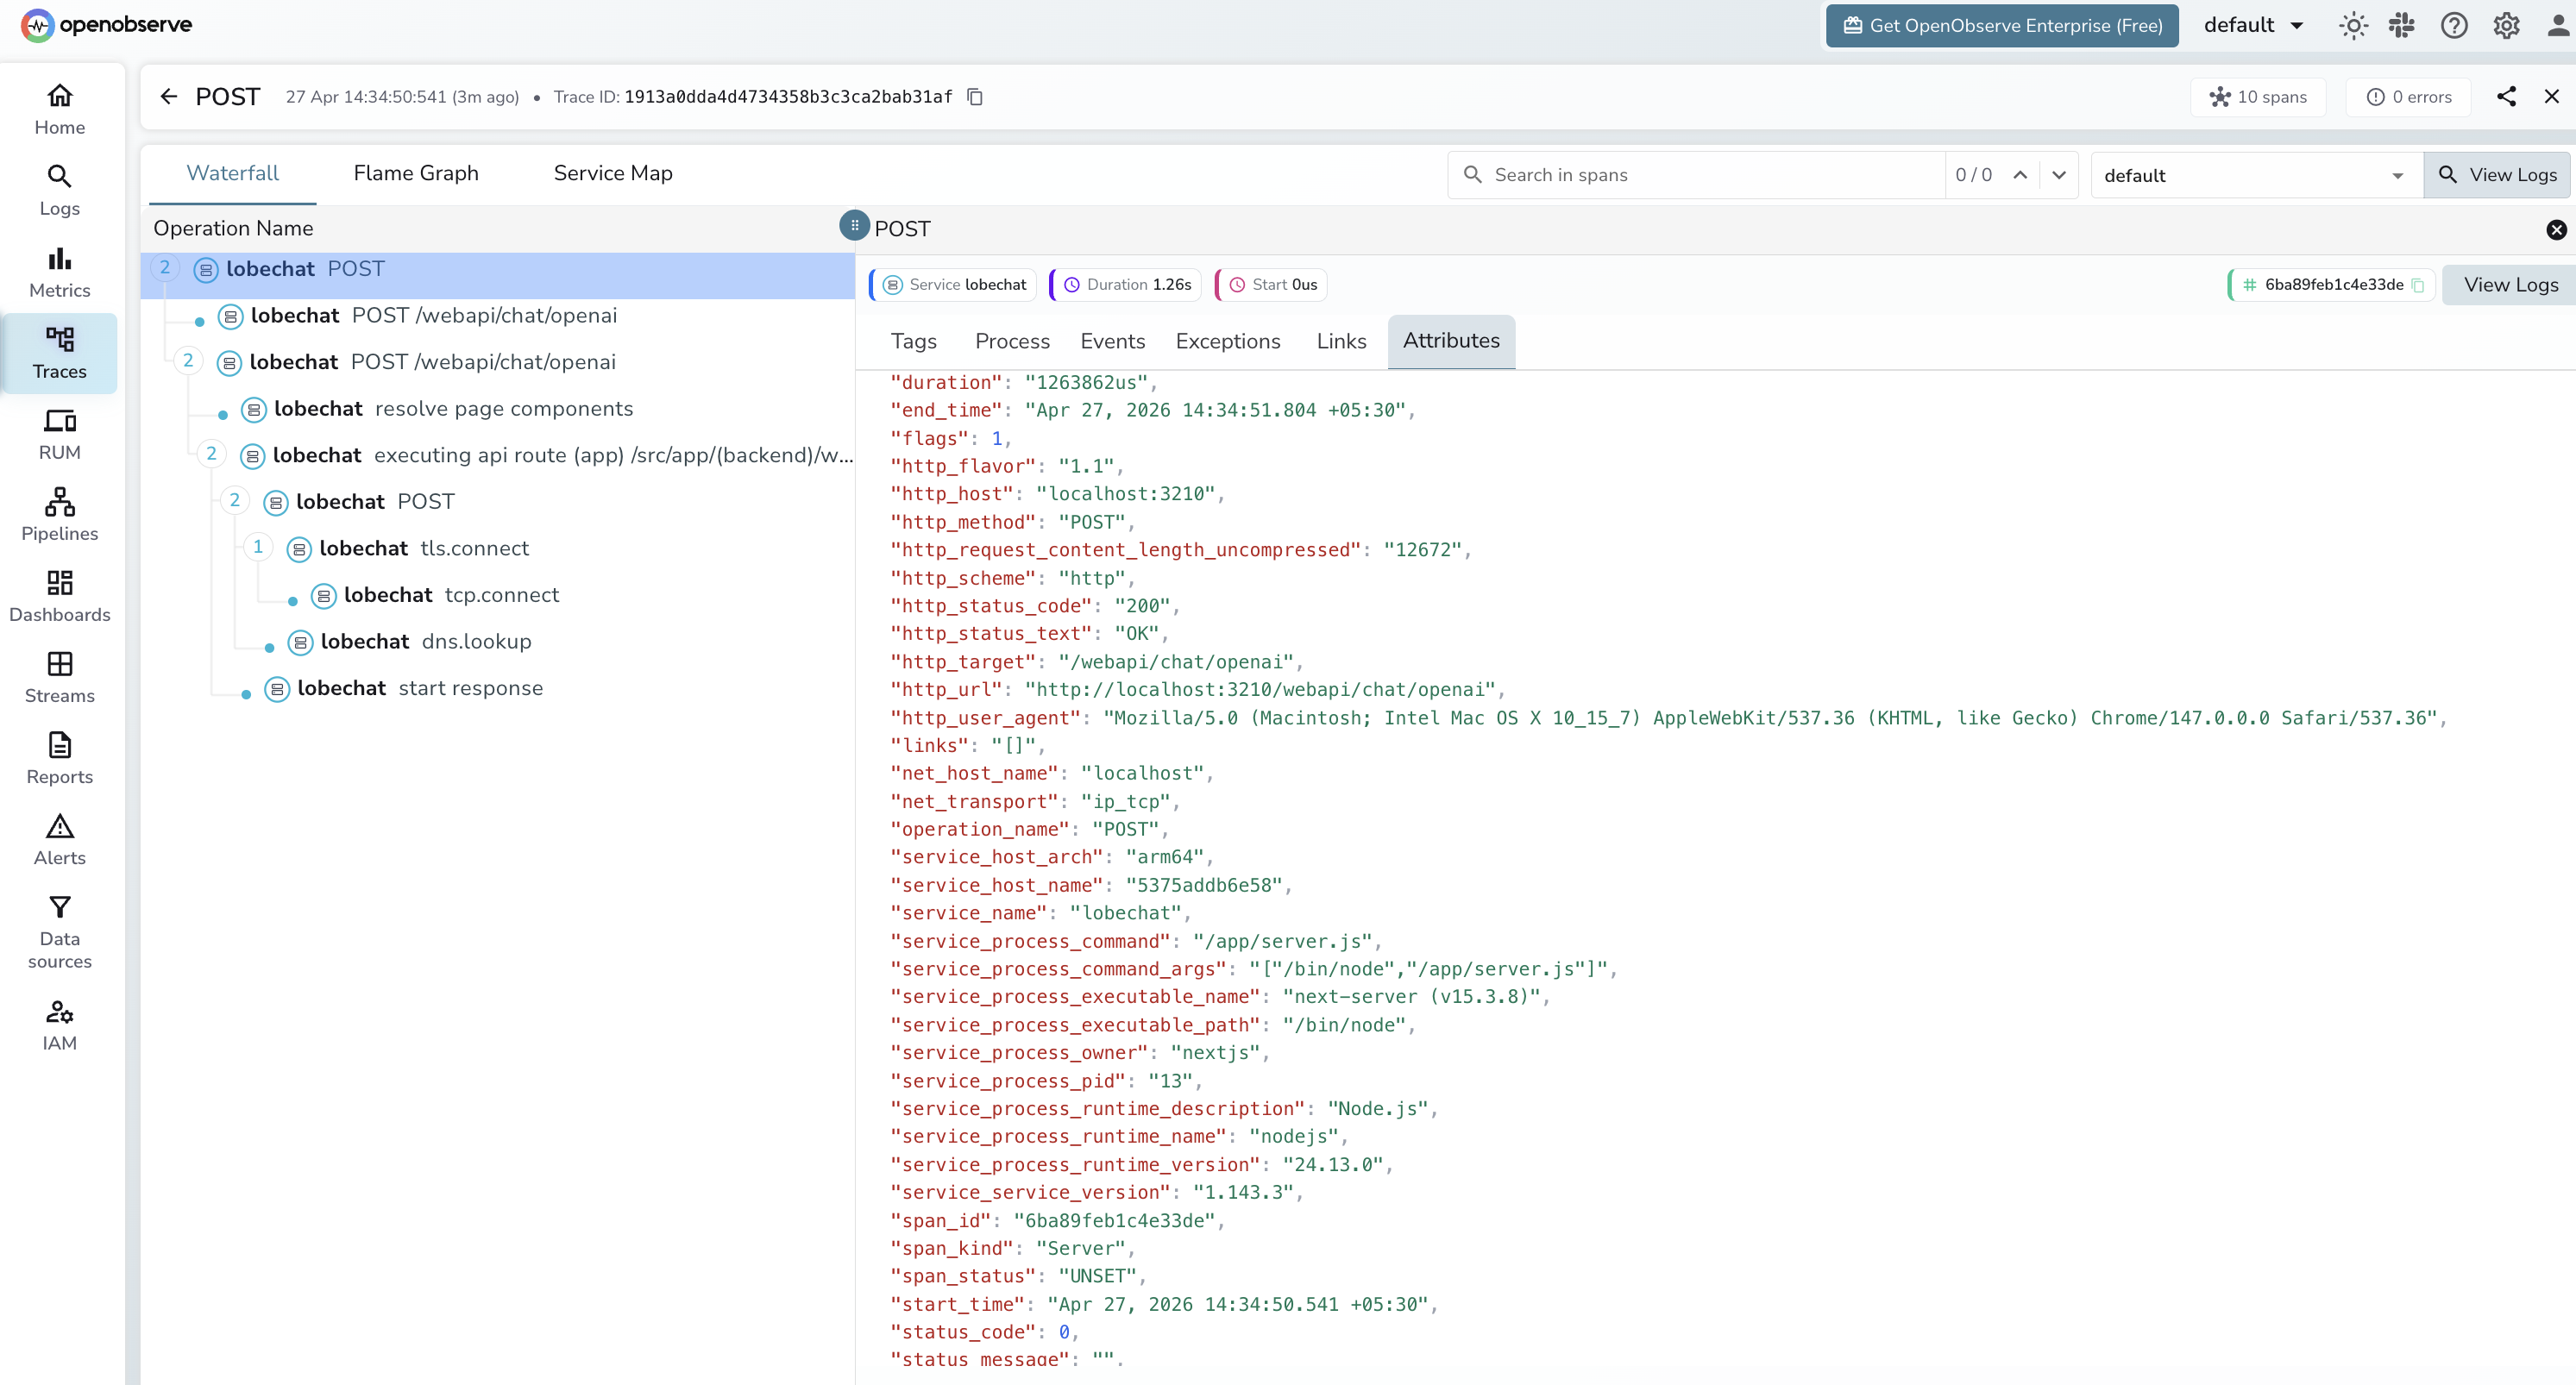
What Gets Captured
LobeChat exports HTTP server spans — one span per chat request. These are infrastructure-level spans: they capture route, latency, and status but not LLM-specific fields like token counts or model name.
| Attribute | Description |
|---|---|
operation_name |
POST |
http_target |
/webapi/chat/openai |
http_method |
POST |
http_status_code |
HTTP response code (e.g. 200) |
http_status_text |
OK on success |
http_url |
Full request URL |
http_host |
Host and port |
http_request_content_length_uncompressed |
Request body size in bytes |
http_user_agent |
Browser or client user agent |
net_transport |
ip_tcp |
span_kind |
Server |
span_status |
UNSET on success, ERROR on failure |
duration |
End-to-end request latency |
service_service_version |
LobeChat version (e.g. 1.143.3) |
service_process_runtime_name |
nodejs |
Next Steps
With LobeChat instrumented, every chat request is recorded in OpenObserve. From here you can monitor response latency, track error rates by route, and set up alerts when the chat API degrades.