

Temporal → OpenObserve
Capture workflow execution spans for every Temporal workflow run. Temporal propagates OpenTelemetry trace context through the built-in TracingInterceptor, which emits spans for workflow starts, workflow runs, and activity executions.
Prerequisites
- Python 3.9+
- An OpenObserve account (cloud or self-hosted)
- Your OpenObserve organisation ID and Base64-encoded auth token
- Temporal server running locally (Temporal CLI dev server) or Temporal Cloud
Start a local dev server using the Temporal CLI:
Installation
Configuration
Create a .env file in your project root:
OPENOBSERVE_URL=https://api.openobserve.ai/
OPENOBSERVE_ORG=your_org_id
OPENOBSERVE_AUTH_TOKEN=Basic <your_base64_token>
TEMPORAL_HOST=localhost:7233
Instrumentation
Configure an OTLP tracer provider and pass TracingInterceptor to both the client and the worker. Keep the OTel setup and asyncio.run() inside main() or under if __name__ == "__main__":. Temporal's workflow sandbox re-executes the module file during worker initialisation, and top-level side effects will cause errors.
from dotenv import load_dotenv
load_dotenv()

import os
import asyncio
from datetime import timedelta

from temporalio import activity, workflow
from temporalio.client import Client
from temporalio.worker import Worker
from temporalio.worker.workflow_sandbox import SandboxedWorkflowRunner, SandboxRestrictions
from temporalio.contrib.opentelemetry import TracingInterceptor

@activity.defn
async def process(text: str) -> str:
    return f"Processed: {text[:30]}"

@workflow.defn
class TextWorkflow:
    @workflow.run
    async def run(self, text: str) -> str:
        return await workflow.execute_activity(
            process, text, start_to_close_timeout=timedelta(seconds=10)
        )

async def main():
    from opentelemetry import trace
    from opentelemetry.sdk.trace import TracerProvider
    from opentelemetry.sdk.trace.export import BatchSpanProcessor
    from opentelemetry.exporter.otlp.proto.http.trace_exporter import OTLPSpanExporter

    endpoint = os.environ["OPENOBSERVE_URL"].rstrip("/") + "/api/" + os.environ["OPENOBSERVE_ORG"] + "/v1/traces"
    provider = TracerProvider()
    provider.add_span_processor(BatchSpanProcessor(OTLPSpanExporter(
        endpoint=endpoint,
        headers={"Authorization": os.environ["OPENOBSERVE_AUTH_TOKEN"]},
    )))
    trace.set_tracer_provider(provider)

    client = await Client.connect(
        os.environ.get("TEMPORAL_HOST", "localhost:7233"),
        interceptors=[TracingInterceptor()],
    )

    sandbox = SandboxedWorkflowRunner(
        restrictions=SandboxRestrictions.default.with_passthrough_modules(
            "opentelemetry", "requests", "urllib3"
        )
    )

    async with Worker(
        client,
        task_queue="oo-queue",
        workflows=[TextWorkflow],
        activities=[process],
        interceptors=[TracingInterceptor()],
        workflow_runner=sandbox,
    ):
        result = await client.execute_workflow(
            TextWorkflow.run,
            "Explain distributed tracing.",
            id="oo-test-1",
            task_queue="oo-queue",
        )
        print(result)

    provider.shutdown()

if __name__ == "__main__":
    asyncio.run(main())
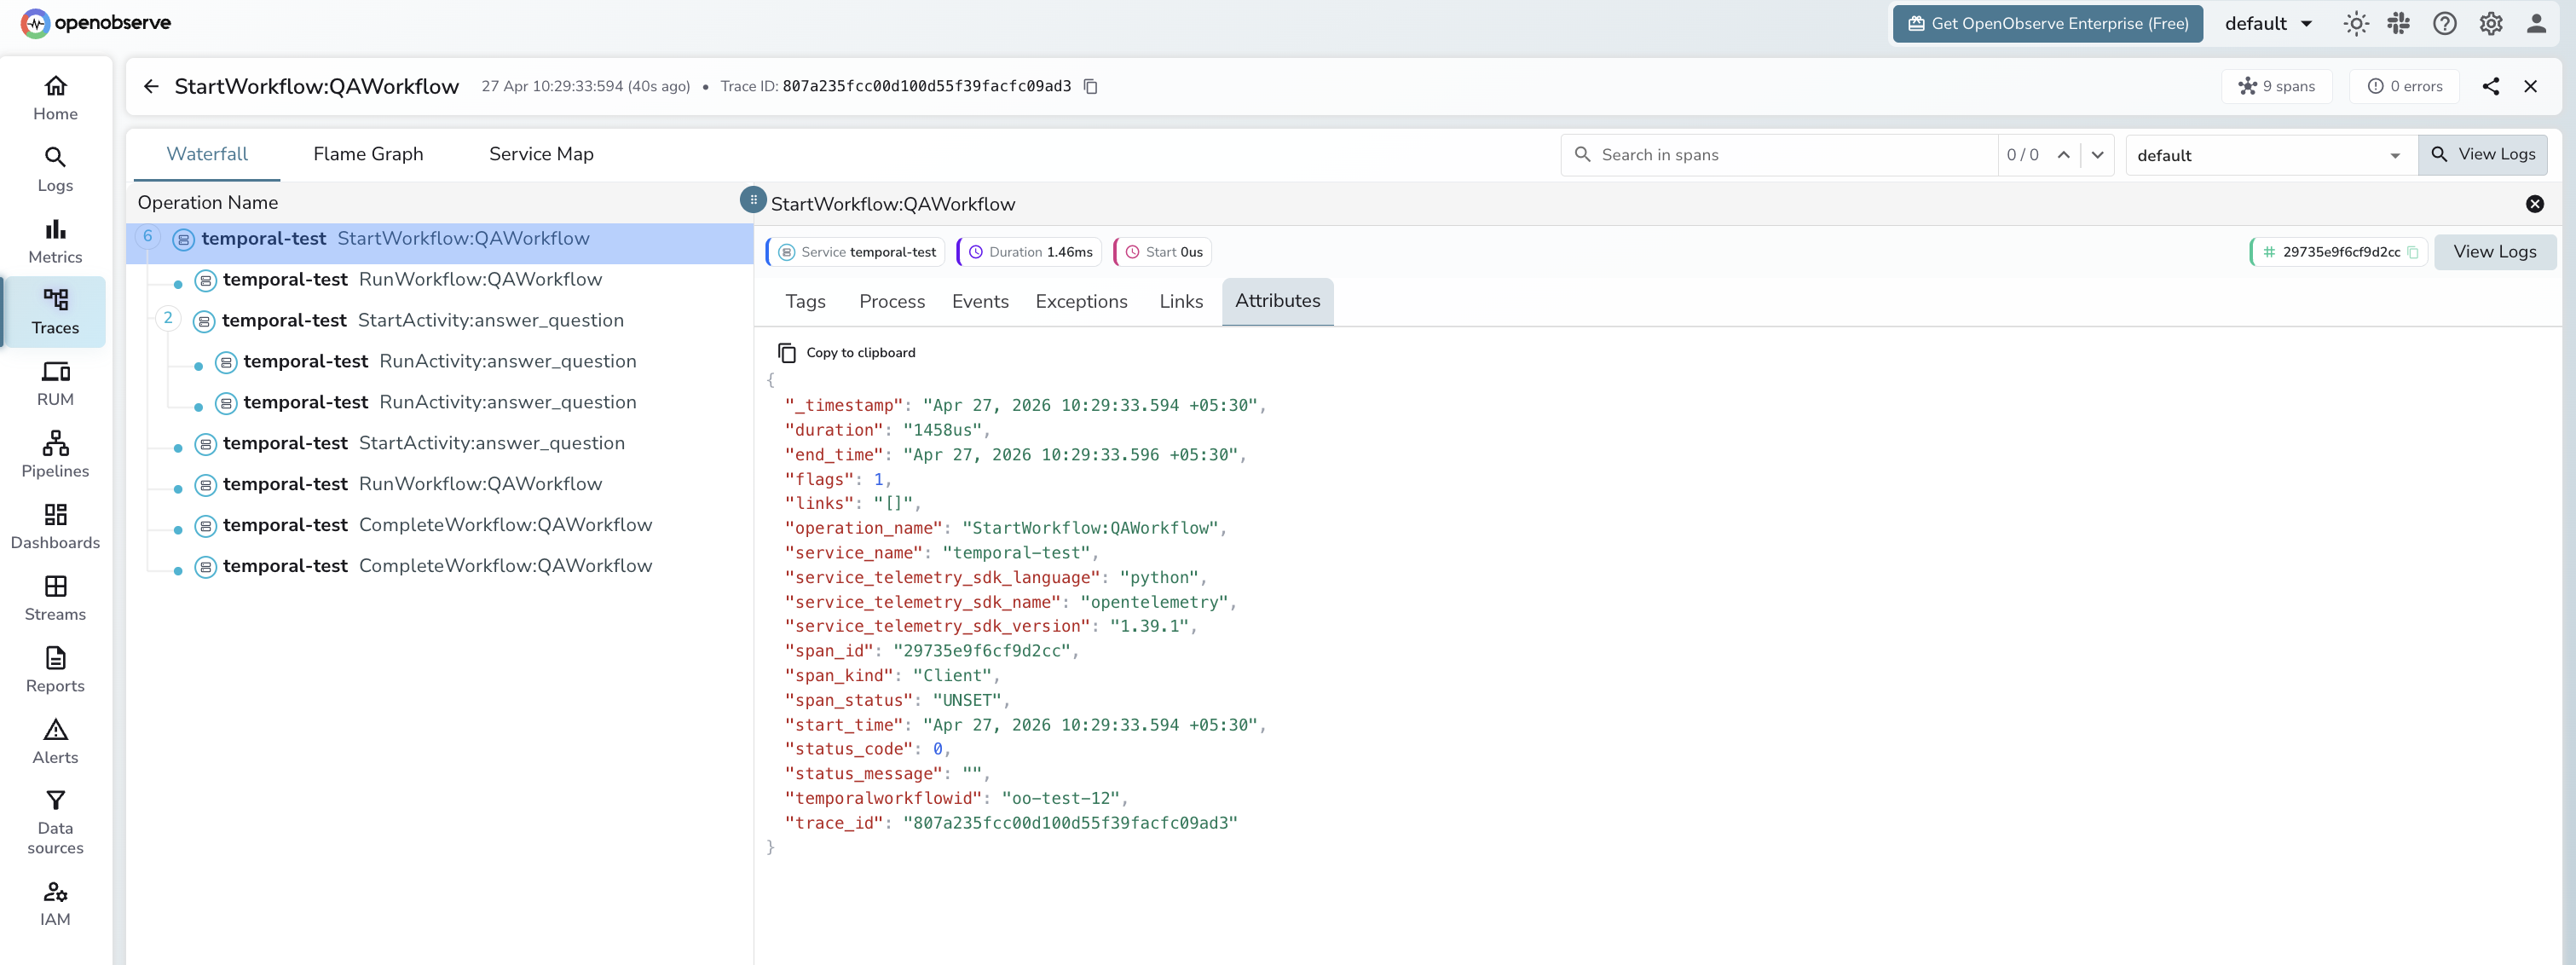
What Gets Captured
| Attribute | Description |
|---|---|
operation_name |
Span name: StartWorkflow:WorkflowType, RunWorkflow:WorkflowType, or ExecuteActivity:ActivityName |
temporalworkflowid |
Unique workflow execution ID (e.g. oo-test-1) |
span_kind |
Client for workflow-start spans; Server for worker-side spans |
span_status |
UNSET on success, ERROR on failure |
service_telemetry_sdk_language |
python |
service_telemetry_sdk_name |
opentelemetry |
service_telemetry_sdk_version |
OTel SDK version in use |
duration |
Workflow or activity execution latency |
Viewing Traces
- Log in to OpenObserve and navigate to Traces
- Workflow start spans appear with
operation_name: StartWorkflow:WorkflowType - Worker-side spans appear as
RunWorkflow:WorkflowTypeandExecuteActivity:ActivityName - Filter by
temporalworkflowidto follow a specific workflow execution end-to-end - Filter by
span_status: ERRORto track workflow timeouts and failures
Next Steps
With Temporal instrumented, every durable workflow execution is recorded in OpenObserve. From here you can monitor activity latency, track workflow IDs, and set alerts on error spans.