
CrewAI → OpenObserve
Automatically capture crew executions, agent runs, task completions, and all nested LLM calls for every CrewAI workflow in your Python application.
Prerequisites
- Python 3.10+
- An OpenObserve account (cloud or self-hosted)
- Your OpenObserve organisation ID and Base64-encoded auth token
- An OpenAI API key (or whichever LLM provider your agents use)
Installation
pip install openobserve-telemetry-sdk opentelemetry-instrumentation-crewai crewai python-dotenvConfiguration
Create a .env file in your project root:
# OpenObserve instance URL
# Default for self-hosted: http://localhost:5080
OPENOBSERVE_URL=https://api.openobserve.ai/

# Your OpenObserve organisation slug or ID
OPENOBSERVE_ORG=your_org_id

# Basic auth token — Base64-encoded "email:password"
OPENOBSERVE_AUTH_TOKEN=Basic <your_base64_token>

# LLM provider key (whichever backend CrewAI is calling)
OPENAI_API_KEY=your-openai-key
Instrumentation
Set up openobserve_init() first, then call CrewAIInstrumentor().instrument(). Also set CREWAI_TELEMETRY_OPT_OUT=true to disable CrewAI's own internal telemetry, which would otherwise conflict with the OTel provider.
from dotenv import load_dotenv
load_dotenv()

import os
os.environ["CREWAI_TELEMETRY_OPT_OUT"] = "true"

from openobserve import openobserve_init
from opentelemetry.instrumentation.crewai import CrewAIInstrumentor

CrewAIInstrumentor().instrument()
openobserve_init()

from crewai import Agent, Task, Crew, Process

researcher = Agent(
    role="Researcher",
    goal="Find concise, factual answers.",
    backstory="You are a precise researcher who answers questions directly.",
    verbose=False,
)

task = Task(
    description="Explain what OpenTelemetry is in two sentences.",
    expected_output="A two-sentence explanation of OpenTelemetry.",
    agent=researcher,
)

crew = Crew(
    agents=[researcher],
    tasks=[task],
    process=Process.sequential,
    verbose=False,
)

result = crew.kickoff()
print("Result:", result)
What Gets Captured
Each crew.kickoff() call produces a root crewai.workflow span with child spans for each agent run and task execution.
| Attribute | Description |
|---|---|
gen_ai_system | crewai |
gen_ai_operation_name | invoke_agent |
llm_observation_type | AGENT for agent spans |
traceloop_span_kind | task for task spans, agent for agent spans |
operation_name | Task description with .task suffix |
crewai_task_description | Full task description |
crewai_task_expected_output | Configured expected output |
crewai_task_agent | Agent assigned to the task |
crewai_task_id | Unique task ID |
crewai_task_processed_by_agents | Agent(s) that executed the task |
crewai_task_retry_count | Number of retry attempts |
crewai_task_tools | Tools available to the task |
crewai_task_used_tools | Number of tools actually used |
duration | Span latency |
span_status | OK on success, ERROR on failure |
Viewing Traces
- Log in to OpenObserve and navigate to Traces in the left sidebar
- Filter by
gen_ai_system = crewaito find CrewAI traces - Click any root
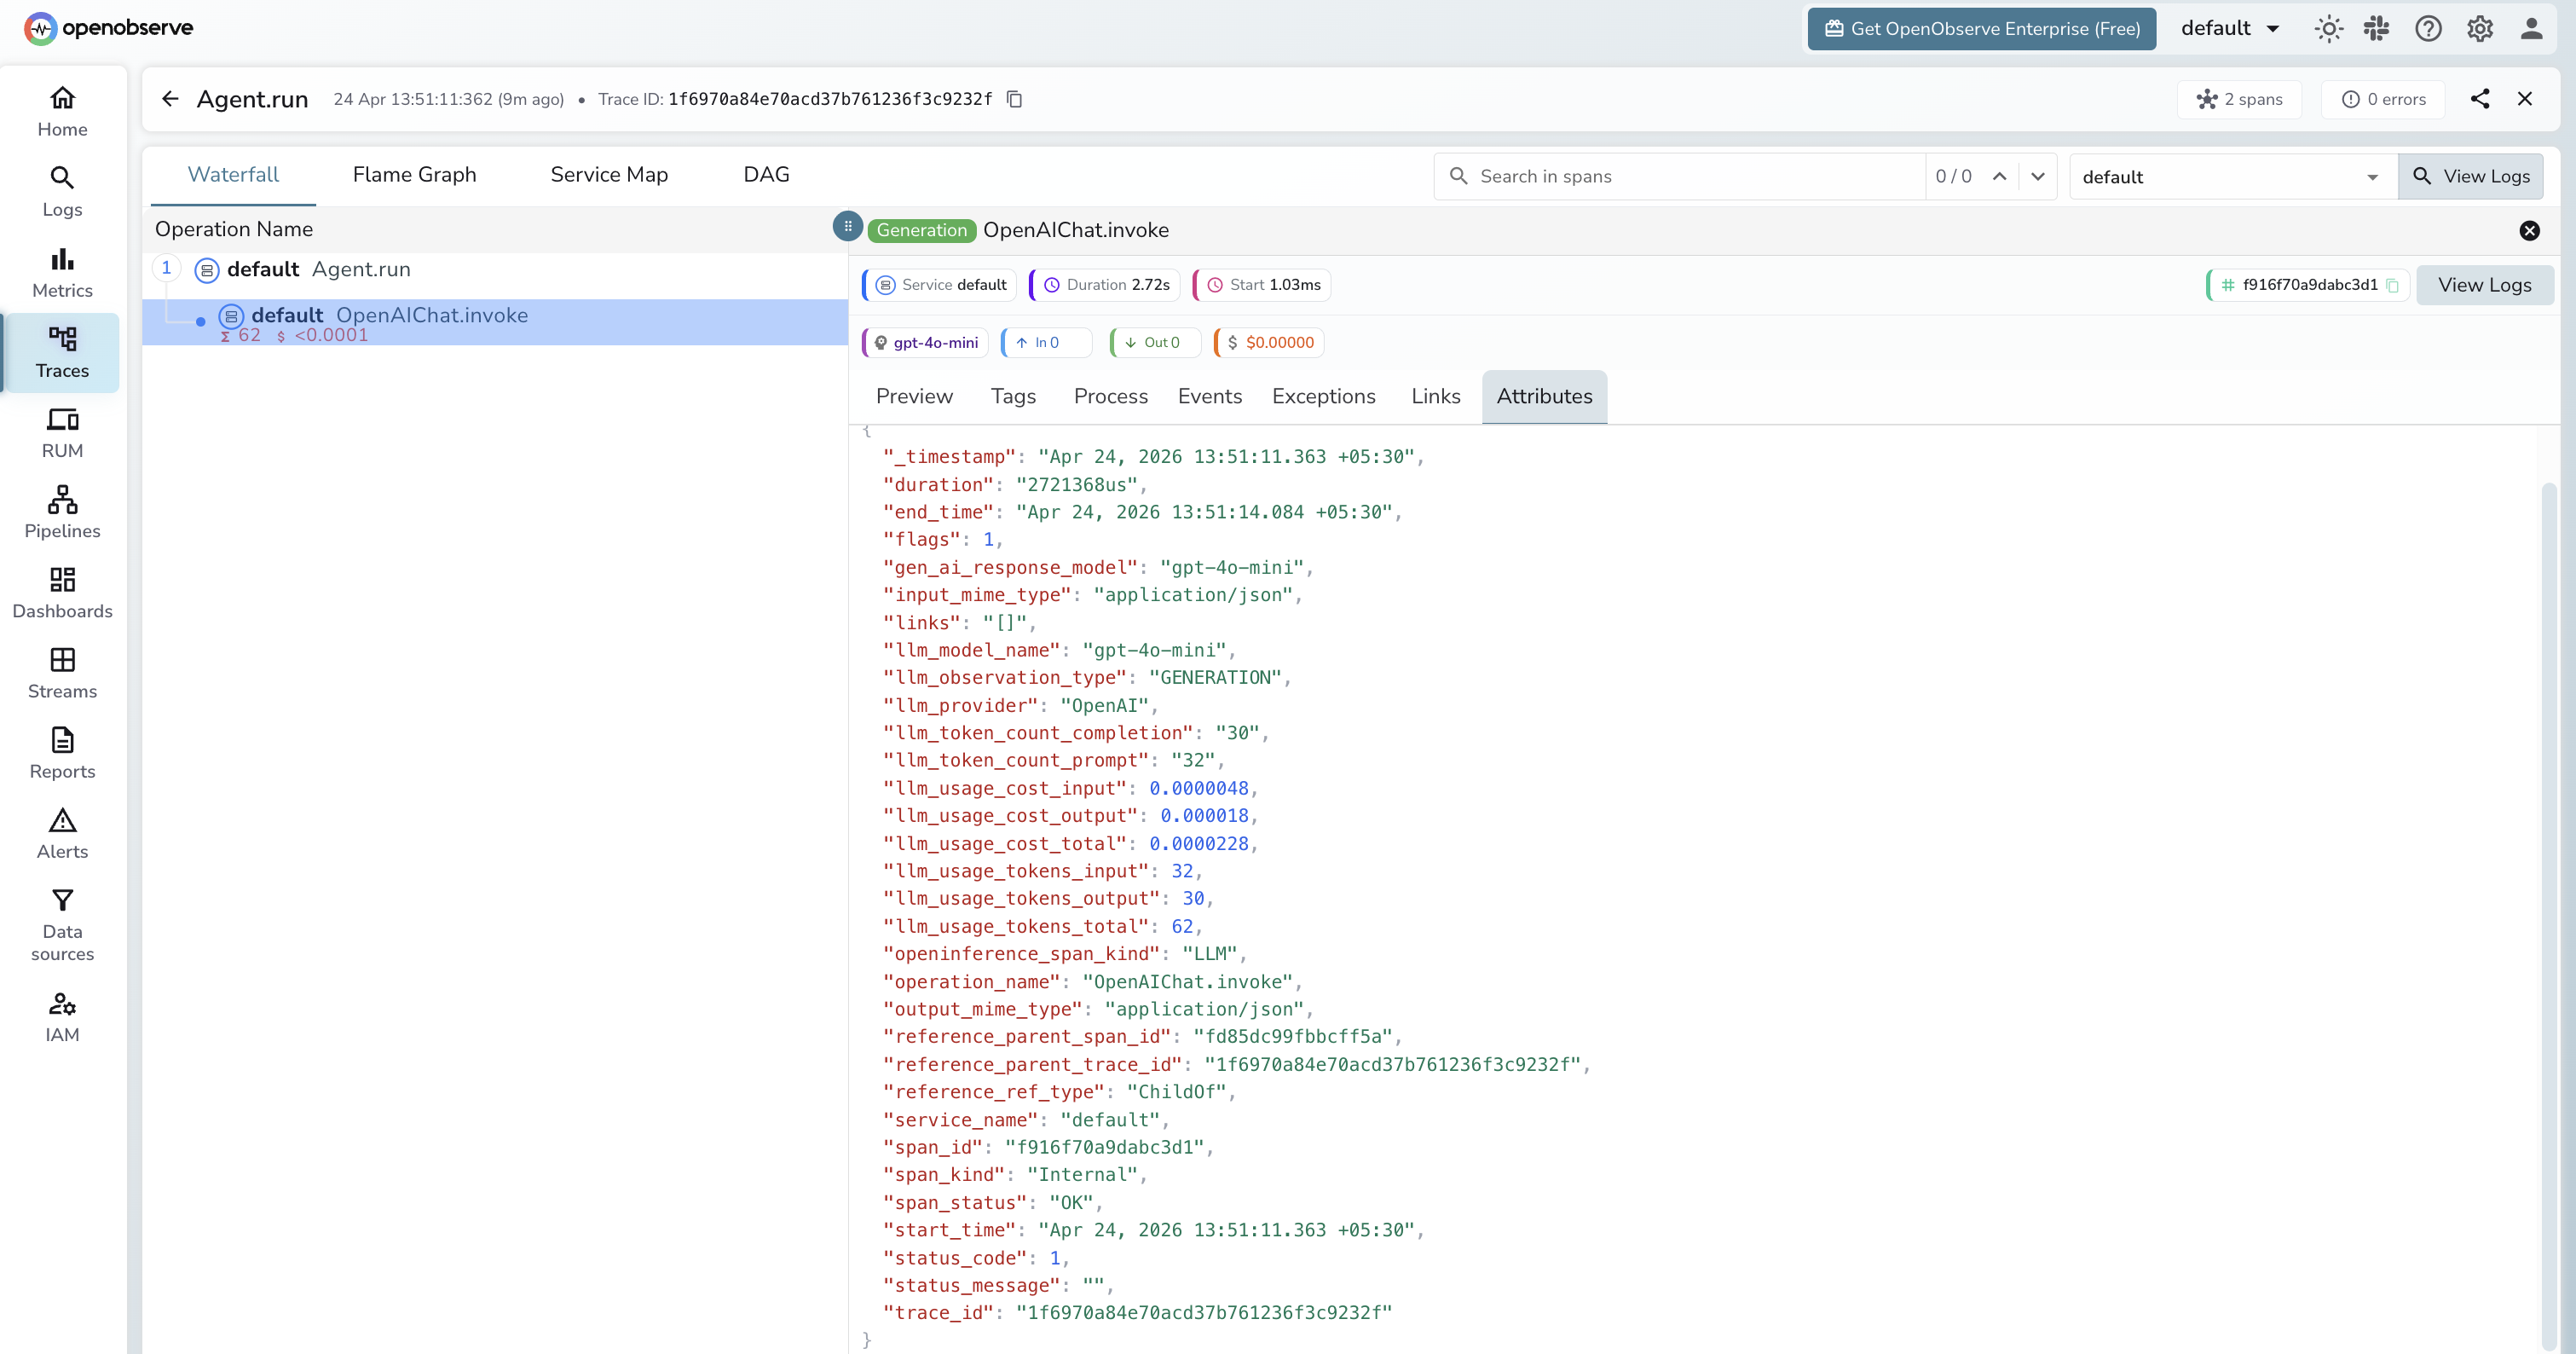
crewai.workflowspan to open the full hierarchy - Expand the tree to see agent spans, task spans, and nested LLM calls
Next Steps
With CrewAI instrumented, every crew execution is recorded in OpenObserve with a full span hierarchy. From here you can track which agents consume the most tokens, compare task latency across runs, and set alerts on error spans from failed agent executions.
Read More
Last updated on