

Restate → OpenObserve
Capture latency, service names, handler names, and status codes for every Restate invocation. Restate is a durable execution platform that guarantees exactly-once execution of handlers across retries and failures. Instrumentation wraps each HTTP invocation call to the Restate ingress in a manual OpenTelemetry span.
Prerequisites
- Python 3.10+ (required by
restate-sdk) - An OpenObserve account (cloud or self-hosted)
- Your OpenObserve organisation ID and Base64-encoded auth token
- Docker (to run the Restate server)
Installation
Start the Restate server with OTLP tracing pointed at OpenObserve:
docker run -d --name restate \
  -p 8080:8080 \
  -p 9070:9070 \
  --add-host host.docker.internal:host-gateway \
  -e RESTATE_OBSERVABILITY__TRACING__ENDPOINT=http://host.docker.internal:5080/api/default/v1/traces \
  restatedev/restate
Configuration
Create a .env file in your project root:
OPENOBSERVE_URL=http://localhost:5080/
OPENOBSERVE_ORG=default
OPENOBSERVE_AUTH_TOKEN=Basic <your_base64_token>
RESTATE_INGRESS_URL=http://localhost:8080
Instrumentation
Define your Restate service and run it with hypercorn. Wrap each invocation call in a manual span to record service name, handler, and response status.
Service definition (service.py):
import restate
from restate import Context, Service

svc = Service("AIService")

@svc.handler()
async def answer(ctx: Context, question: str) -> str:
    return f"Answer to: {question[:50]}"

app = restate.app(services=[svc])
Start the service:
Register with Restate:
curl -X POST http://localhost:9070/deployments \
  -H 'Content-Type: application/json' \
  -d '{"uri": "http://host.docker.internal:9080"}'
Invocation client with tracing:
from dotenv import load_dotenv
load_dotenv()

from openobserve import openobserve_init
openobserve_init()

from opentelemetry import trace
import os
import requests

tracer = trace.get_tracer(__name__)
ingress = os.environ.get("RESTATE_INGRESS_URL", "http://localhost:8080")

def invoke(service: str, handler: str, payload: str):
    with tracer.start_as_current_span("restate.invoke") as span:
        span.set_attribute("restate.service", service)
        span.set_attribute("restate.handler", handler)
        span.set_attribute("restate.input", payload[:100])
        resp = requests.post(
            f"{ingress}/{service}/{handler}",
            json=payload,
            headers={"Content-Type": "application/json"},
            timeout=10,
        )
        span.set_attribute("restate.status_code", resp.status_code)
        span.set_attribute("span_status", "OK" if resp.ok else "ERROR")
        return resp.json()

result = invoke("AIService", "answer", "What is distributed tracing?")
print(result)

trace.get_tracer_provider().force_flush()
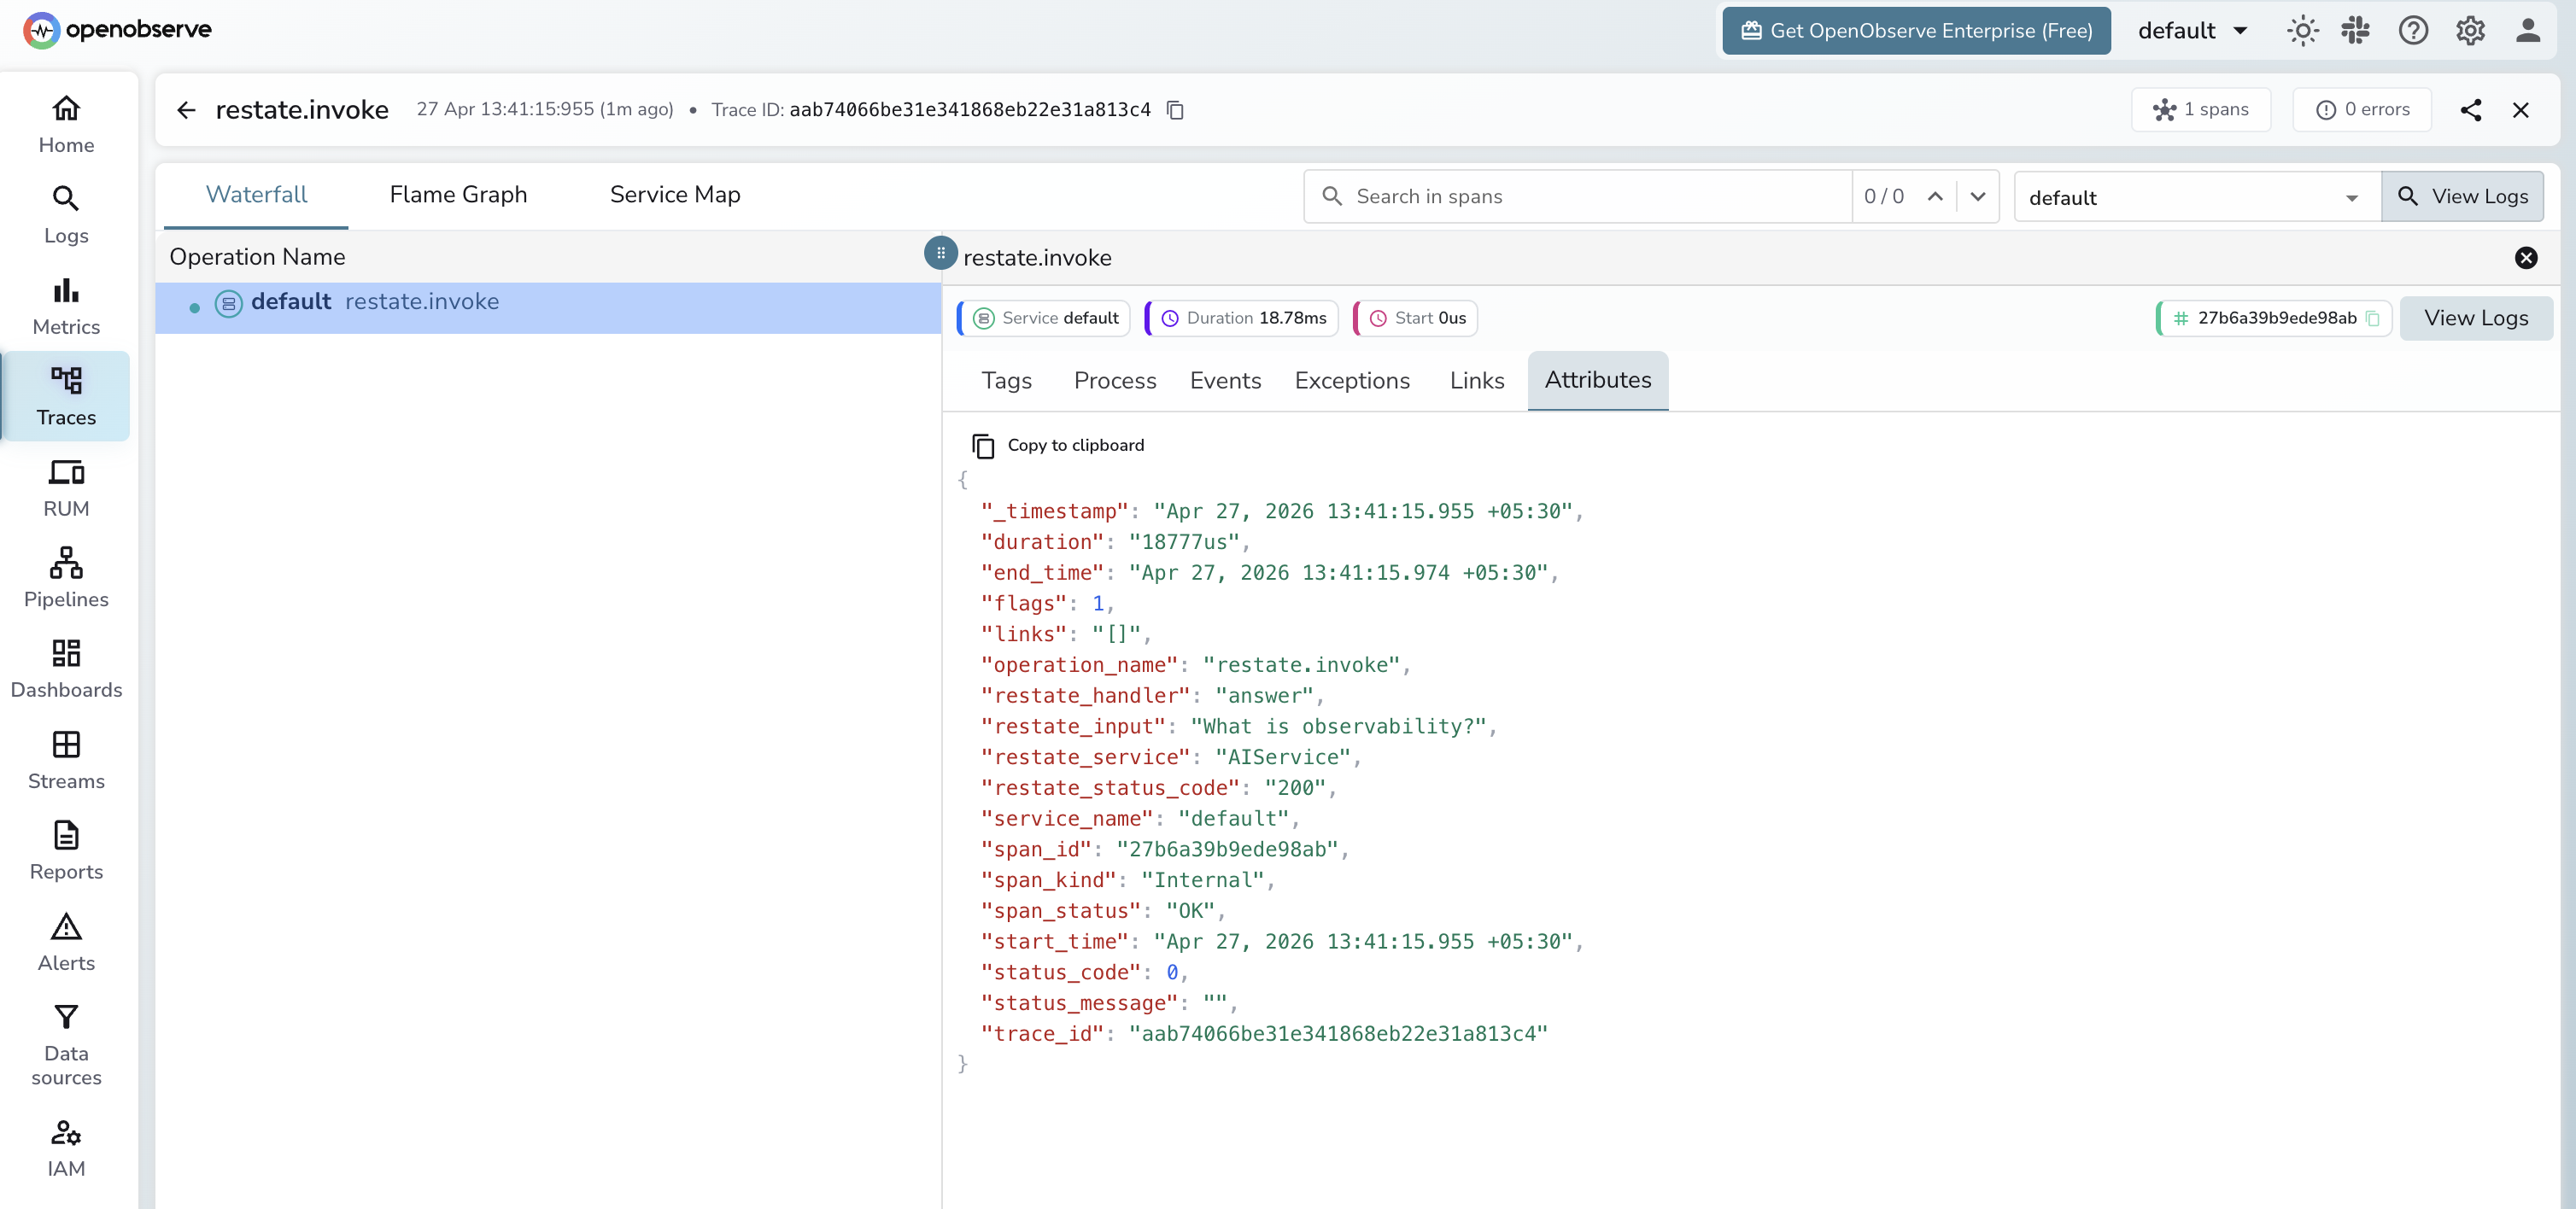
What Gets Captured
| Attribute | Description |
|---|---|
operation_name |
restate.invoke |
restate_service |
The Restate service name (e.g. AIService) |
restate_handler |
The handler name (e.g. answer) |
restate_input |
Input payload sent to the handler (truncated to 100 chars) |
restate_status_code |
HTTP response status code from the ingress (e.g. 200) |
span_status |
OK on success, ERROR on failure |
duration |
End-to-end invocation latency |
Viewing Traces
- Log in to OpenObserve and navigate to Traces
- Filter by
operation_name=restate.invoketo see all service calls - Use
restate_serviceandrestate_handlerto drill into a specific handler - Filter by
span_status=ERRORto find failed invocations
Next Steps
With Restate instrumented, every handler invocation is recorded in OpenObserve. From here you can monitor handler latency, track error rates per service, and alert on failures.