

Swiftide → OpenObserve
Capture per-agent-run latency, model name, input question, and error details for every Swiftide agent call. Swiftide is a Rust framework for building AI pipelines and agents. Instrument it by wrapping agent.query() calls in OpenTelemetry spans and exporting them to OpenObserve via OTLP HTTP.
Prerequisites
- Rust 1.75+ with Cargo
- An OpenObserve account (cloud or self-hosted)
- Your OpenObserve organisation ID and Base64-encoded auth token
- An API key for a Swiftide-supported LLM provider (Anthropic, Ollama, or others)
Installation
Add the following to your Cargo.toml:
[dependencies]
swiftide = { version = "0.32", features = ["anthropic"] }
swiftide-agents = "0.32"
opentelemetry = "0.27"
opentelemetry_sdk = { version = "0.27", features = ["trace", "rt-tokio"] }
opentelemetry-otlp = { version = "0.27", features = ["http-proto", "reqwest-client"] }
reqwest = { version = "0.12", features = ["rustls-tls", "json"] }
tokio = { version = "1", features = ["full"] }
dotenvy = "0.15"
anyhow = "1"
Replace anthropic with the feature name for your preferred LLM provider (e.g. ollama, open-router).
Configuration
Set the following environment variables before running your application:
OpenObserve connection details are set directly in code (see Instrumentation below).
Instrumentation
Initialize the OpenTelemetry provider, then wrap each agent.query() call in a manual span. Swiftide does not automatically emit OpenTelemetry spans, so the outer span is what flows to OpenObserve.
use anyhow::Result;
use opentelemetry::{
    global,
    trace::{Span, SpanKind, Status, Tracer, TracerProvider as _},
    KeyValue,
};
use opentelemetry_otlp::{WithExportConfig, WithHttpConfig};
use opentelemetry_sdk::{runtime::Tokio, trace::TracerProvider, Resource};
use swiftide::chat_completion::ChatMessage;
use swiftide::integrations::anthropic::Anthropic;
use swiftide_agents::Agent;

fn init_tracing() -> Result<TracerProvider> {
    let mut headers = std::collections::HashMap::new();
    headers.insert(
        "Authorization".to_string(),
        "Basic <your_base64_token>".to_string(),
    );

    let exporter = opentelemetry_otlp::SpanExporter::builder()
        .with_http()
        .with_endpoint("https://api.openobserve.ai/api/<your_org_id>/v1/traces")
        .with_headers(headers)
        .build()?;

    let provider = TracerProvider::builder()
        .with_batch_exporter(exporter, Tokio)
        .with_resource(Resource::new(vec![KeyValue::new(
            "service.name",
            "swiftide",
        )]))
        .build();

    global::set_tracer_provider(provider.clone());
    Ok(provider)
}

async fn run_agent(anthropic: &Anthropic, model: &str, question: &str) -> Result<String> {
    let tracer = global::tracer("swiftide");
    let mut span = tracer
        .span_builder("swiftide.agent_run")
        .with_kind(SpanKind::Internal)
        .with_attributes(vec![
            KeyValue::new("model", model.to_string()),
            KeyValue::new("question", question[..question.len().min(200)].to_string()),
        ])
        .start(&tracer);

    let mut agent = Agent::builder().llm(anthropic).build()?;
    let result = agent.query(question.to_string()).await;

    match &result {
        Ok(_) => {
            let history = agent.history().await.unwrap_or_default();
            let response = history
                .iter()
                .rev()
                .find_map(|m| {
                    if let ChatMessage::Assistant(Some(text), _) = m {
                        Some(text.clone())
                    } else {
                        None
                    }
                })
                .unwrap_or_default();
            span.set_status(Status::Ok);
            span.end();
            Ok(response)
        }
        Err(e) => {
            span.set_status(Status::error(e.to_string()));
            span.set_attribute(KeyValue::new("error.message", e.to_string()));
            span.end();
            Err(anyhow::anyhow!("{}", e))
        }
    }
}

#[tokio::main]
async fn main() -> Result<()> {
    dotenvy::dotenv().ok();
    let provider = init_tracing()?;

    let anthropic = Anthropic::builder()
        .default_prompt_model("claude-haiku-4-5-20251001")
        .build()?;

    let result = run_agent(&anthropic, "claude-haiku-4-5-20251001", "What is RAG?").await?;
    println!("{}", result);

    provider.shutdown()?;
    Ok(())
}
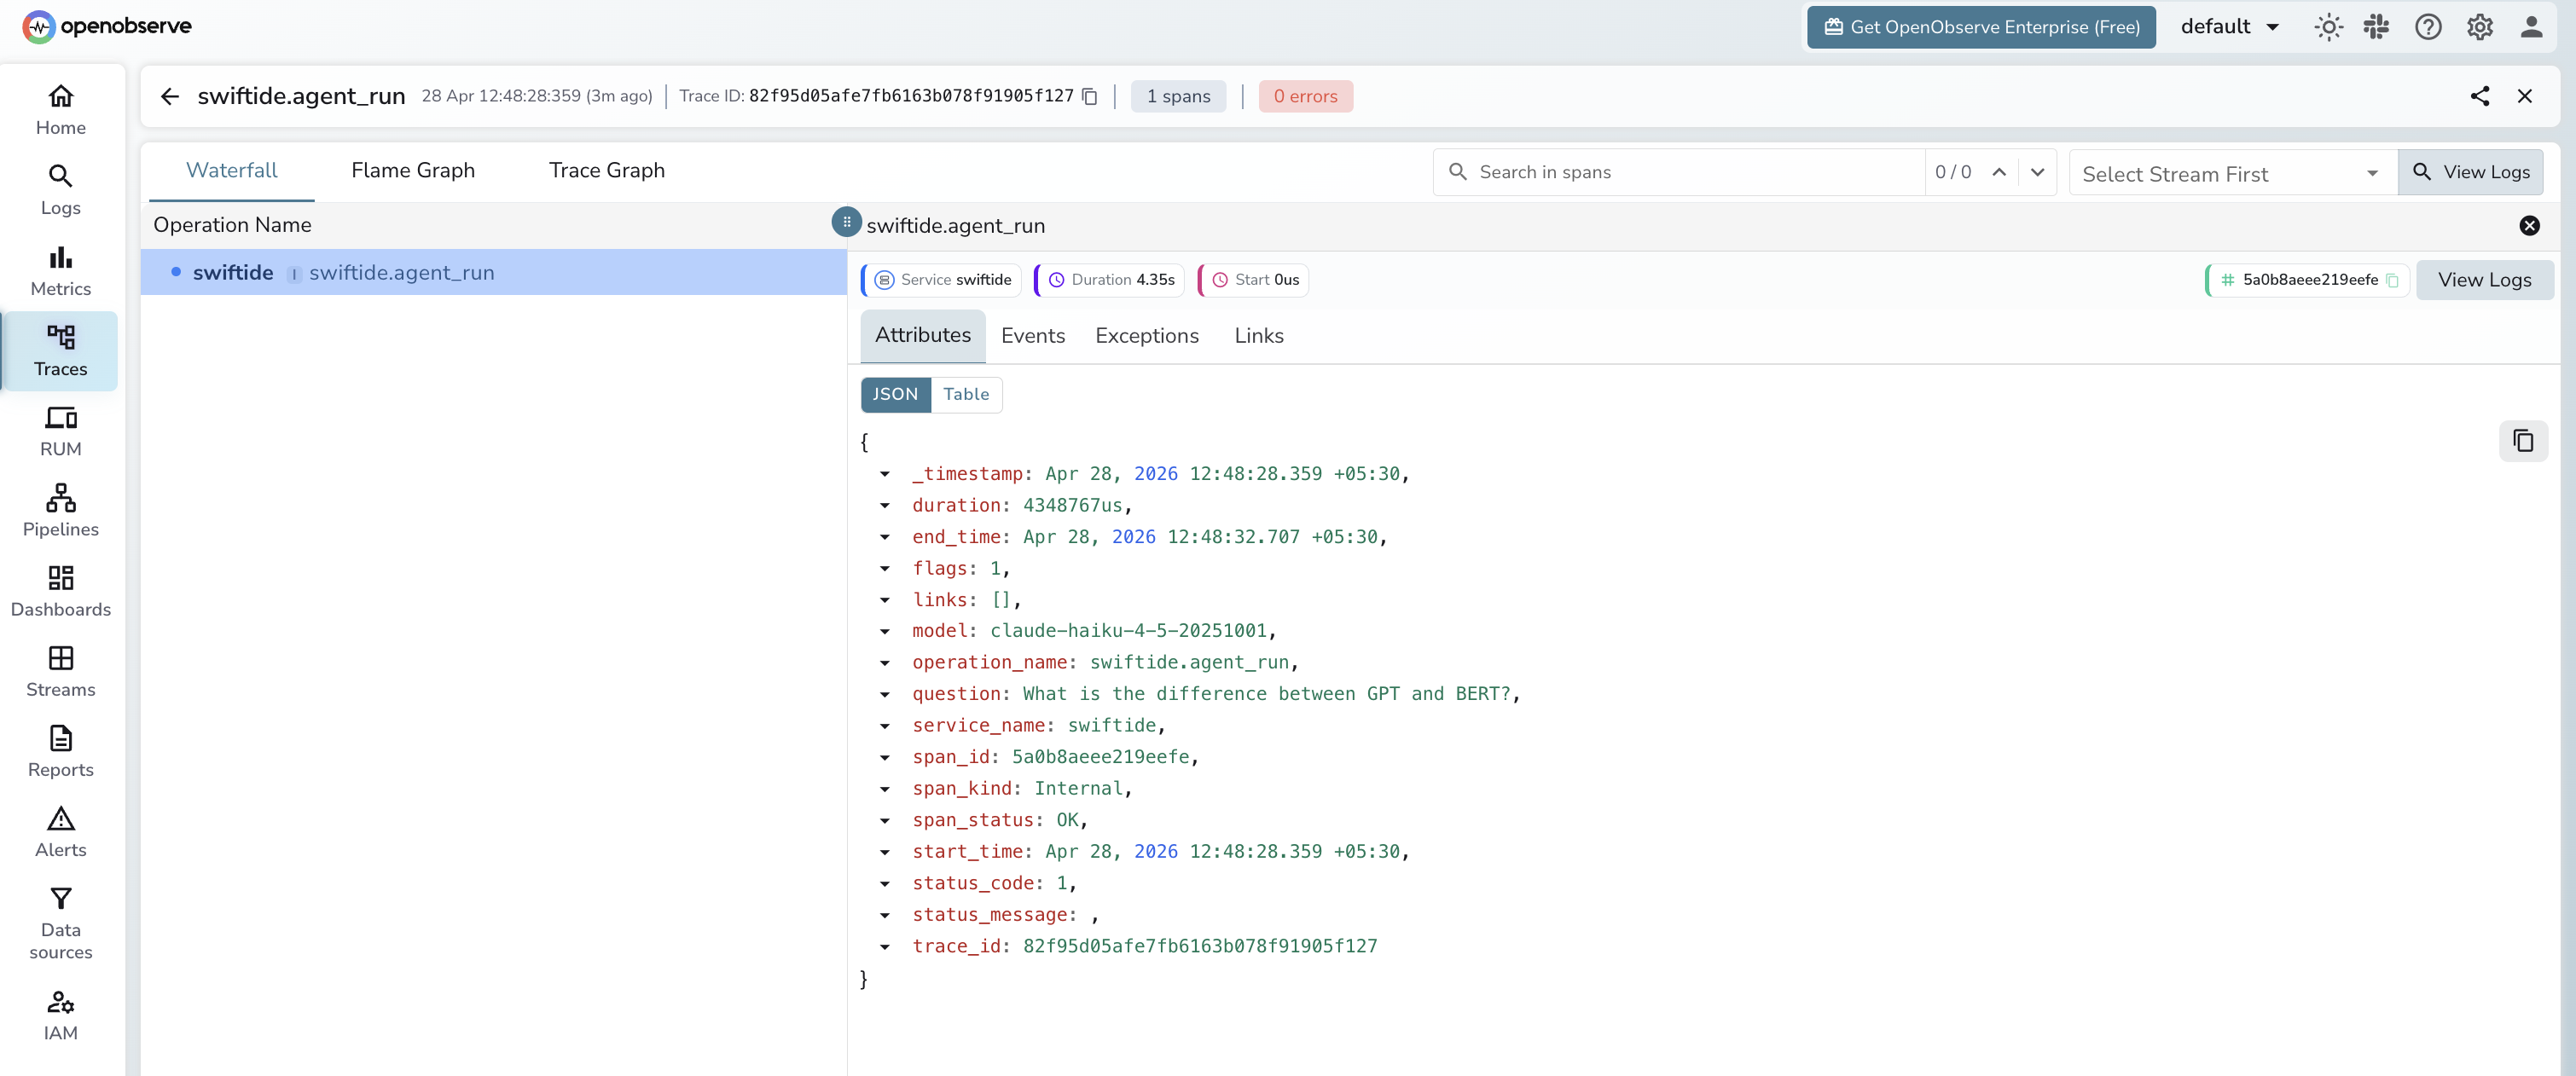
What Gets Captured
Each swiftide.agent_run span contains the following attributes:
| Attribute | Example Value |
|---|---|
operation_name |
swiftide.agent_run |
model |
claude-haiku-4-5-20251001 |
question |
What is distributed tracing? |
span_kind |
Internal |
span_status |
OK on success, ERROR on failure |
error_message |
Full error string from LLM or network (error spans only) |
service_name |
swiftide |
duration |
End-to-end latency for the agent run in microseconds |
Viewing Traces
- Log in to OpenObserve and navigate to Traces
- Filter by
service_name=swiftideto see all agent runs - Click any span to expand its attributes and inspect
model,question, andduration - Filter by
span_status=ERRORto find failed agent calls and read theerror_message - Sort by
durationdescending to identify the slowest agent invocations
Next Steps
- Add more attributes to the span such as response length or token estimates using
span.set_attribute() - Add child spans inside tool implementations to trace individual tool calls
- Create alerts in OpenObserve when
span_status=ERRORexceeds a threshold - Build a dashboard to track agent latency trends over time