

Parallel → OpenObserve
Capture run IDs, processor tier, status, and latency for every Parallel AI task submission. Parallel does not ship a dedicated OTel instrumentor, so instrumentation uses manual OpenTelemetry spans wrapping the Parallel REST API.
Prerequisites
- Python 3.8+
- An OpenObserve account (cloud or self-hosted)
- Your OpenObserve organisation ID and Base64-encoded auth token
- A Parallel API key
Installation
Configuration
Create a .env file in your project root:
OPENOBSERVE_URL=https://api.openobserve.ai/
OPENOBSERVE_ORG=your_org_id
OPENOBSERVE_AUTH_TOKEN=Basic <your_base64_token>
PARALLEL_API_KEY=your-parallel-api-key
Instrumentation
Call openobserve_init() before making API calls. Pass resource_attributes to set the service name, then wrap each task submission in a manual span.
from dotenv import load_dotenv
load_dotenv()

from openobserve import openobserve_init
openobserve_init(resource_attributes={"service.name": "my-app"})

from opentelemetry import trace
import os
import requests

tracer = trace.get_tracer(__name__)

api_key = os.environ["PARALLEL_API_KEY"]
BASE_URL = "https://api.parallel.ai/v1"

headers = {
    "x-api-key": api_key,
    "Content-Type": "application/json",
}

def run_task(task: str, processor: str = "core"):
    with tracer.start_as_current_span("parallel.run_task") as span:
        span.set_attribute("parallel.task", task[:100])
        span.set_attribute("parallel.processor", processor)
        resp = requests.post(
            f"{BASE_URL}/tasks/runs",
            headers=headers,
            json={"input": task, "processor": processor},
            timeout=30,
        )
        resp.raise_for_status()
        data = resp.json()
        span.set_attribute("parallel.run_id", data.get("run_id", ""))
        span.set_attribute("parallel.status", data.get("status", ""))
        return data

result = run_task("Explain distributed tracing in one sentence.")
print(result)
Parallel returns immediately with a queued status and a run_id. Poll GET /tasks/runs/{run_id} to retrieve the completed result. The processor field controls the capability tier: core, base, or ultra.
What Gets Captured
| Attribute | Description |
|---|---|
parallel_task |
The task input text (truncated to 100 chars) |
parallel_run_id |
Unique run identifier returned by the API |
parallel_status |
Initial task status, typically queued |
parallel_processor |
Processor tier used (core, base, or ultra) |
parallel_status_code |
HTTP status code on error responses |
span_status |
OK or ERROR |
error_message |
Error detail on failed requests |
duration |
API call latency |
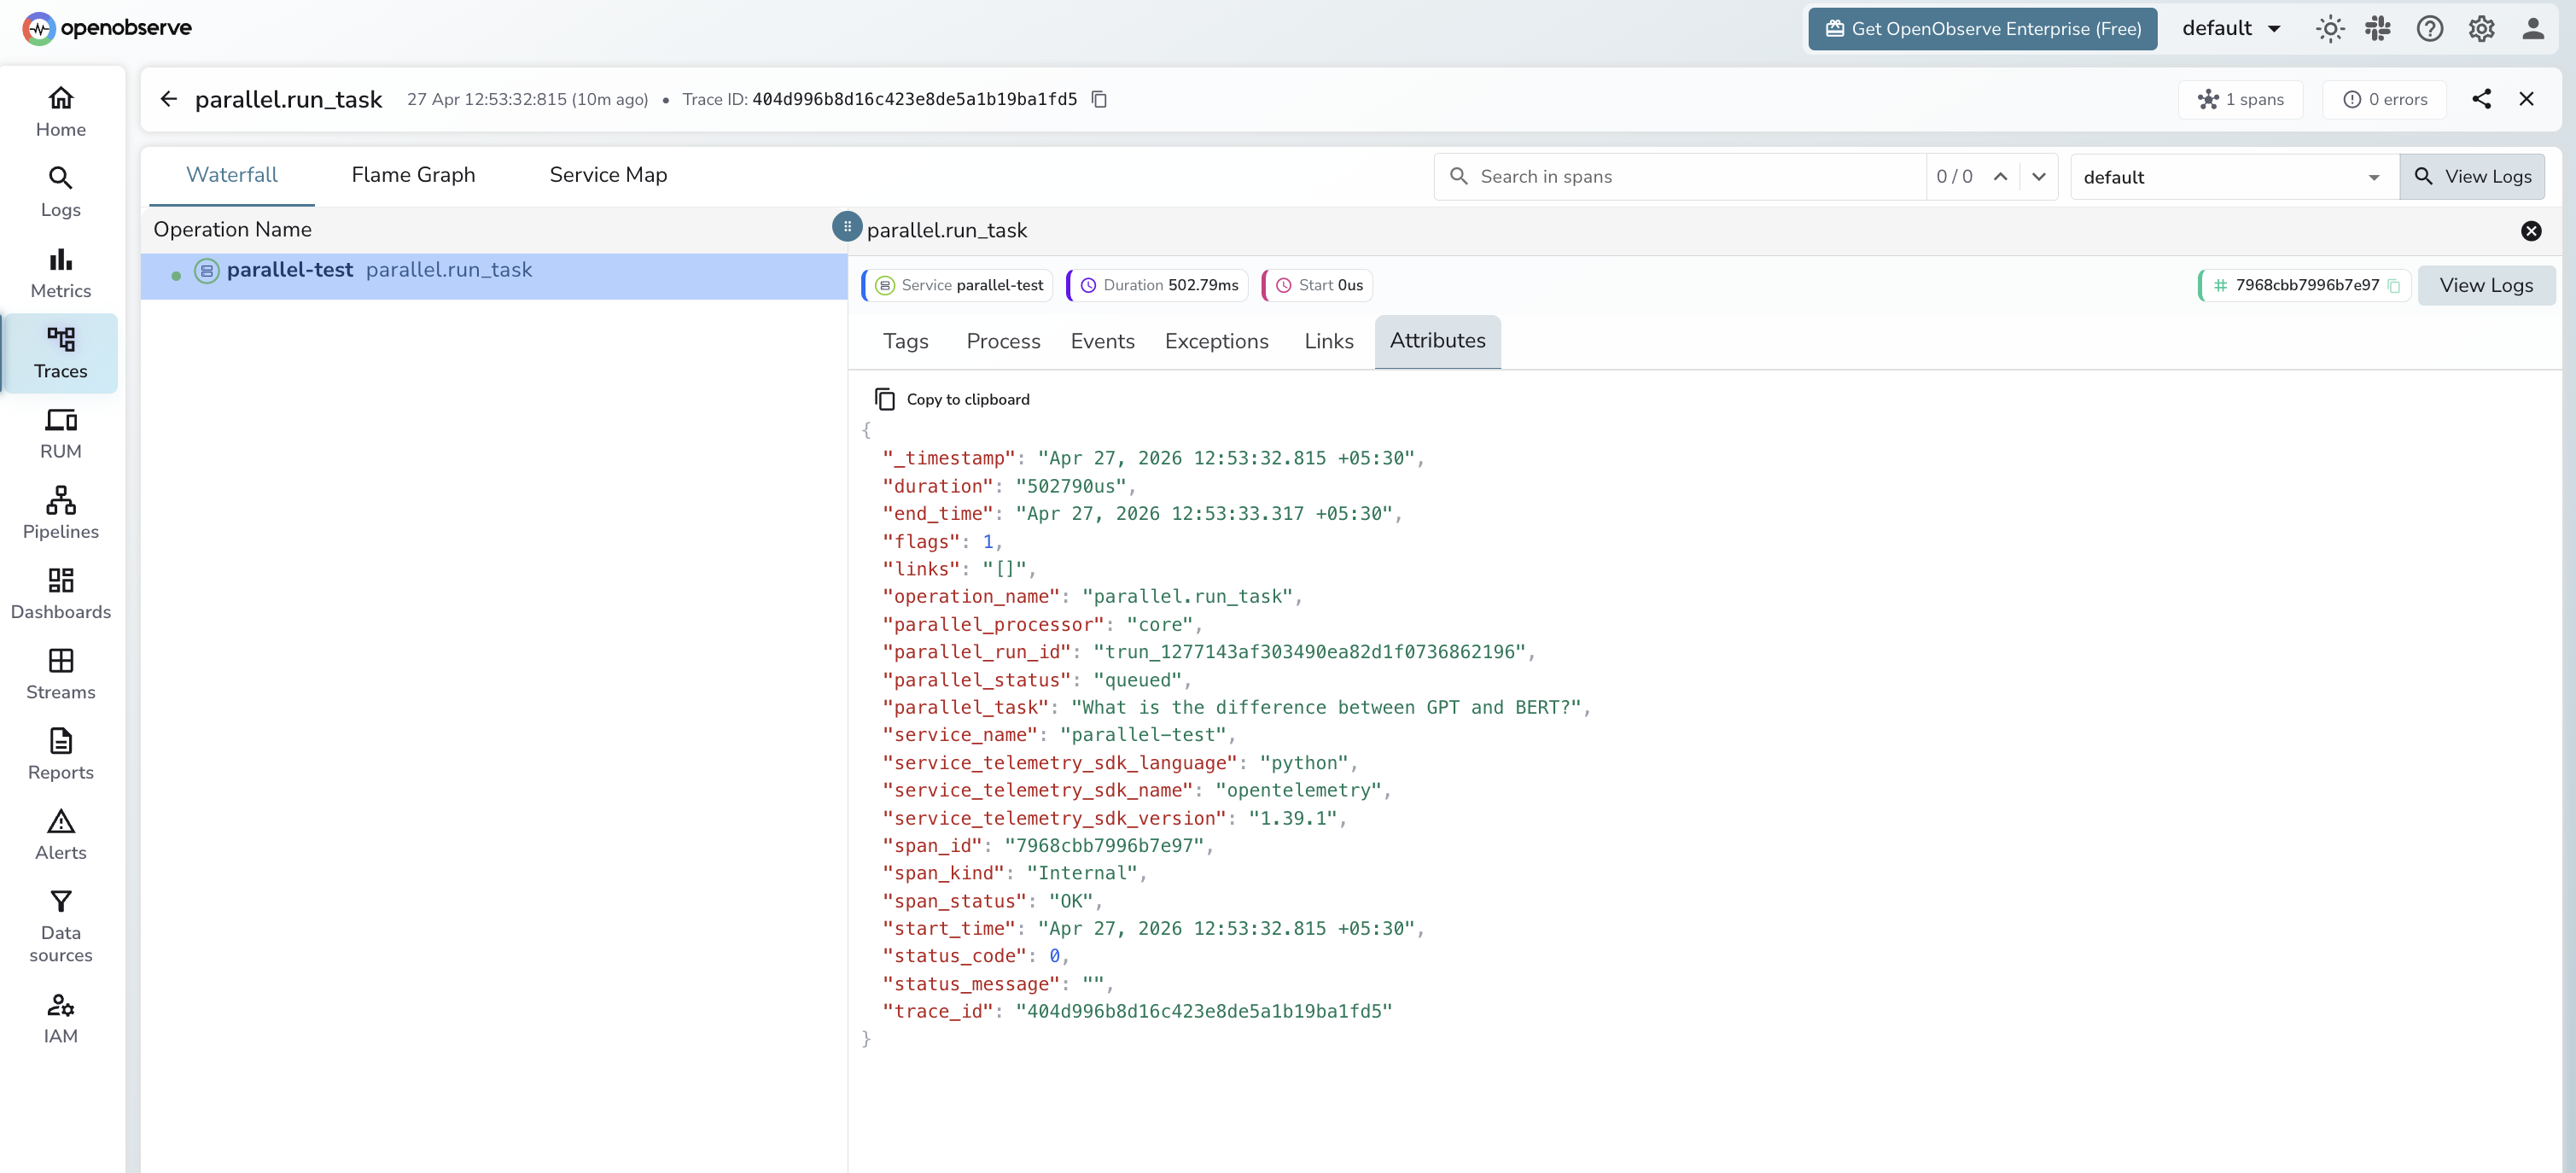
Viewing Traces
- Log in to OpenObserve and navigate to Traces
- Filter by service name to find your Parallel spans
- Click a
parallel.run_taskspan to inspect the run ID, processor tier, and status - Filter by
span_status=ERRORto identify failed submissions
Next Steps
With Parallel instrumented, every task submission is recorded in OpenObserve. From here you can monitor submission latency, track error rates by processor tier, and correlate Parallel runs with other spans in your pipeline.