

Semantic Kernel → OpenObserve
Automatically capture LLM calls, function invocations, and planner steps for every Semantic Kernel application. Semantic Kernel emits OpenTelemetry spans natively. Configuring the tracer provider is all that is needed.
Prerequisites
- Python 3.10+
- An OpenObserve account (cloud or self-hosted)
- Your OpenObserve organisation ID and Base64-encoded auth token
- An OpenAI API key
Installation
Configuration
Create a .env file in your project root:
OPENOBSERVE_URL=https://api.openobserve.ai/
OPENOBSERVE_ORG=your_org_id
OPENOBSERVE_AUTH_TOKEN=Basic <your_base64_token>
OPENAI_API_KEY=your-openai-api-key
Instrumentation
Set the OTel diagnostics env vars before calling openobserve_init(). Semantic Kernel detects the active tracer provider and emits spans automatically once diagnostics are enabled.
import asyncio
import os
from dotenv import load_dotenv
load_dotenv()

os.environ["SEMANTICKERNEL_EXPERIMENTAL_GENAI_ENABLE_OTEL_DIAGNOSTICS"] = "true"
os.environ["SEMANTICKERNEL_EXPERIMENTAL_GENAI_ENABLE_OTEL_DIAGNOSTICS_SENSITIVE"] = "true"

from openobserve import openobserve_init
openobserve_init()

from semantic_kernel import Kernel
from semantic_kernel.connectors.ai.open_ai import OpenAIChatCompletion
from semantic_kernel.connectors.ai.open_ai import OpenAIChatPromptExecutionSettings
from semantic_kernel.contents import ChatHistory

kernel = Kernel()
kernel.add_service(
    OpenAIChatCompletion(
        service_id="chat",
        ai_model_id="gpt-4o-mini",
        api_key=os.environ["OPENAI_API_KEY"],
    )
)

settings = OpenAIChatPromptExecutionSettings(max_tokens=100)


async def main():
    chat = ChatHistory()
    chat.add_user_message("What is OpenTelemetry?")
    service = kernel.get_service("chat")
    result = await service.get_chat_message_contents(chat, settings=settings)
    print(str(result[0]))


asyncio.run(main())
Using kernel functions
from semantic_kernel.functions import kernel_function

class ObservabilityPlugin:
    @kernel_function(name="explain", description="Explain an observability concept")
    def explain(self, concept: str) -> str:
        return f"Explaining: {concept}"

kernel.add_plugin(ObservabilityPlugin(), plugin_name="Observability")
What Gets Captured
| Attribute | Description |
|---|---|
gen_ai_system |
openai |
gen_ai_operation_name |
chat for chat completions |
gen_ai_request_model |
Requested model (e.g. gpt-4o-mini) |
gen_ai_response_model |
Resolved model returned by the API |
gen_ai_usage_input_tokens |
Prompt tokens consumed |
gen_ai_usage_output_tokens |
Completion tokens returned |
gen_ai_response_finish_reason |
Why the response stopped (e.g. FinishReason.LENGTH) |
gen_ai_response_id |
The chat completion response ID |
server_address |
OpenAI API endpoint |
operation_name |
Span name: chat {model} (e.g. chat gpt-4o-mini) |
duration |
Span latency |
span_status |
UNSET on success, ERROR on failure |
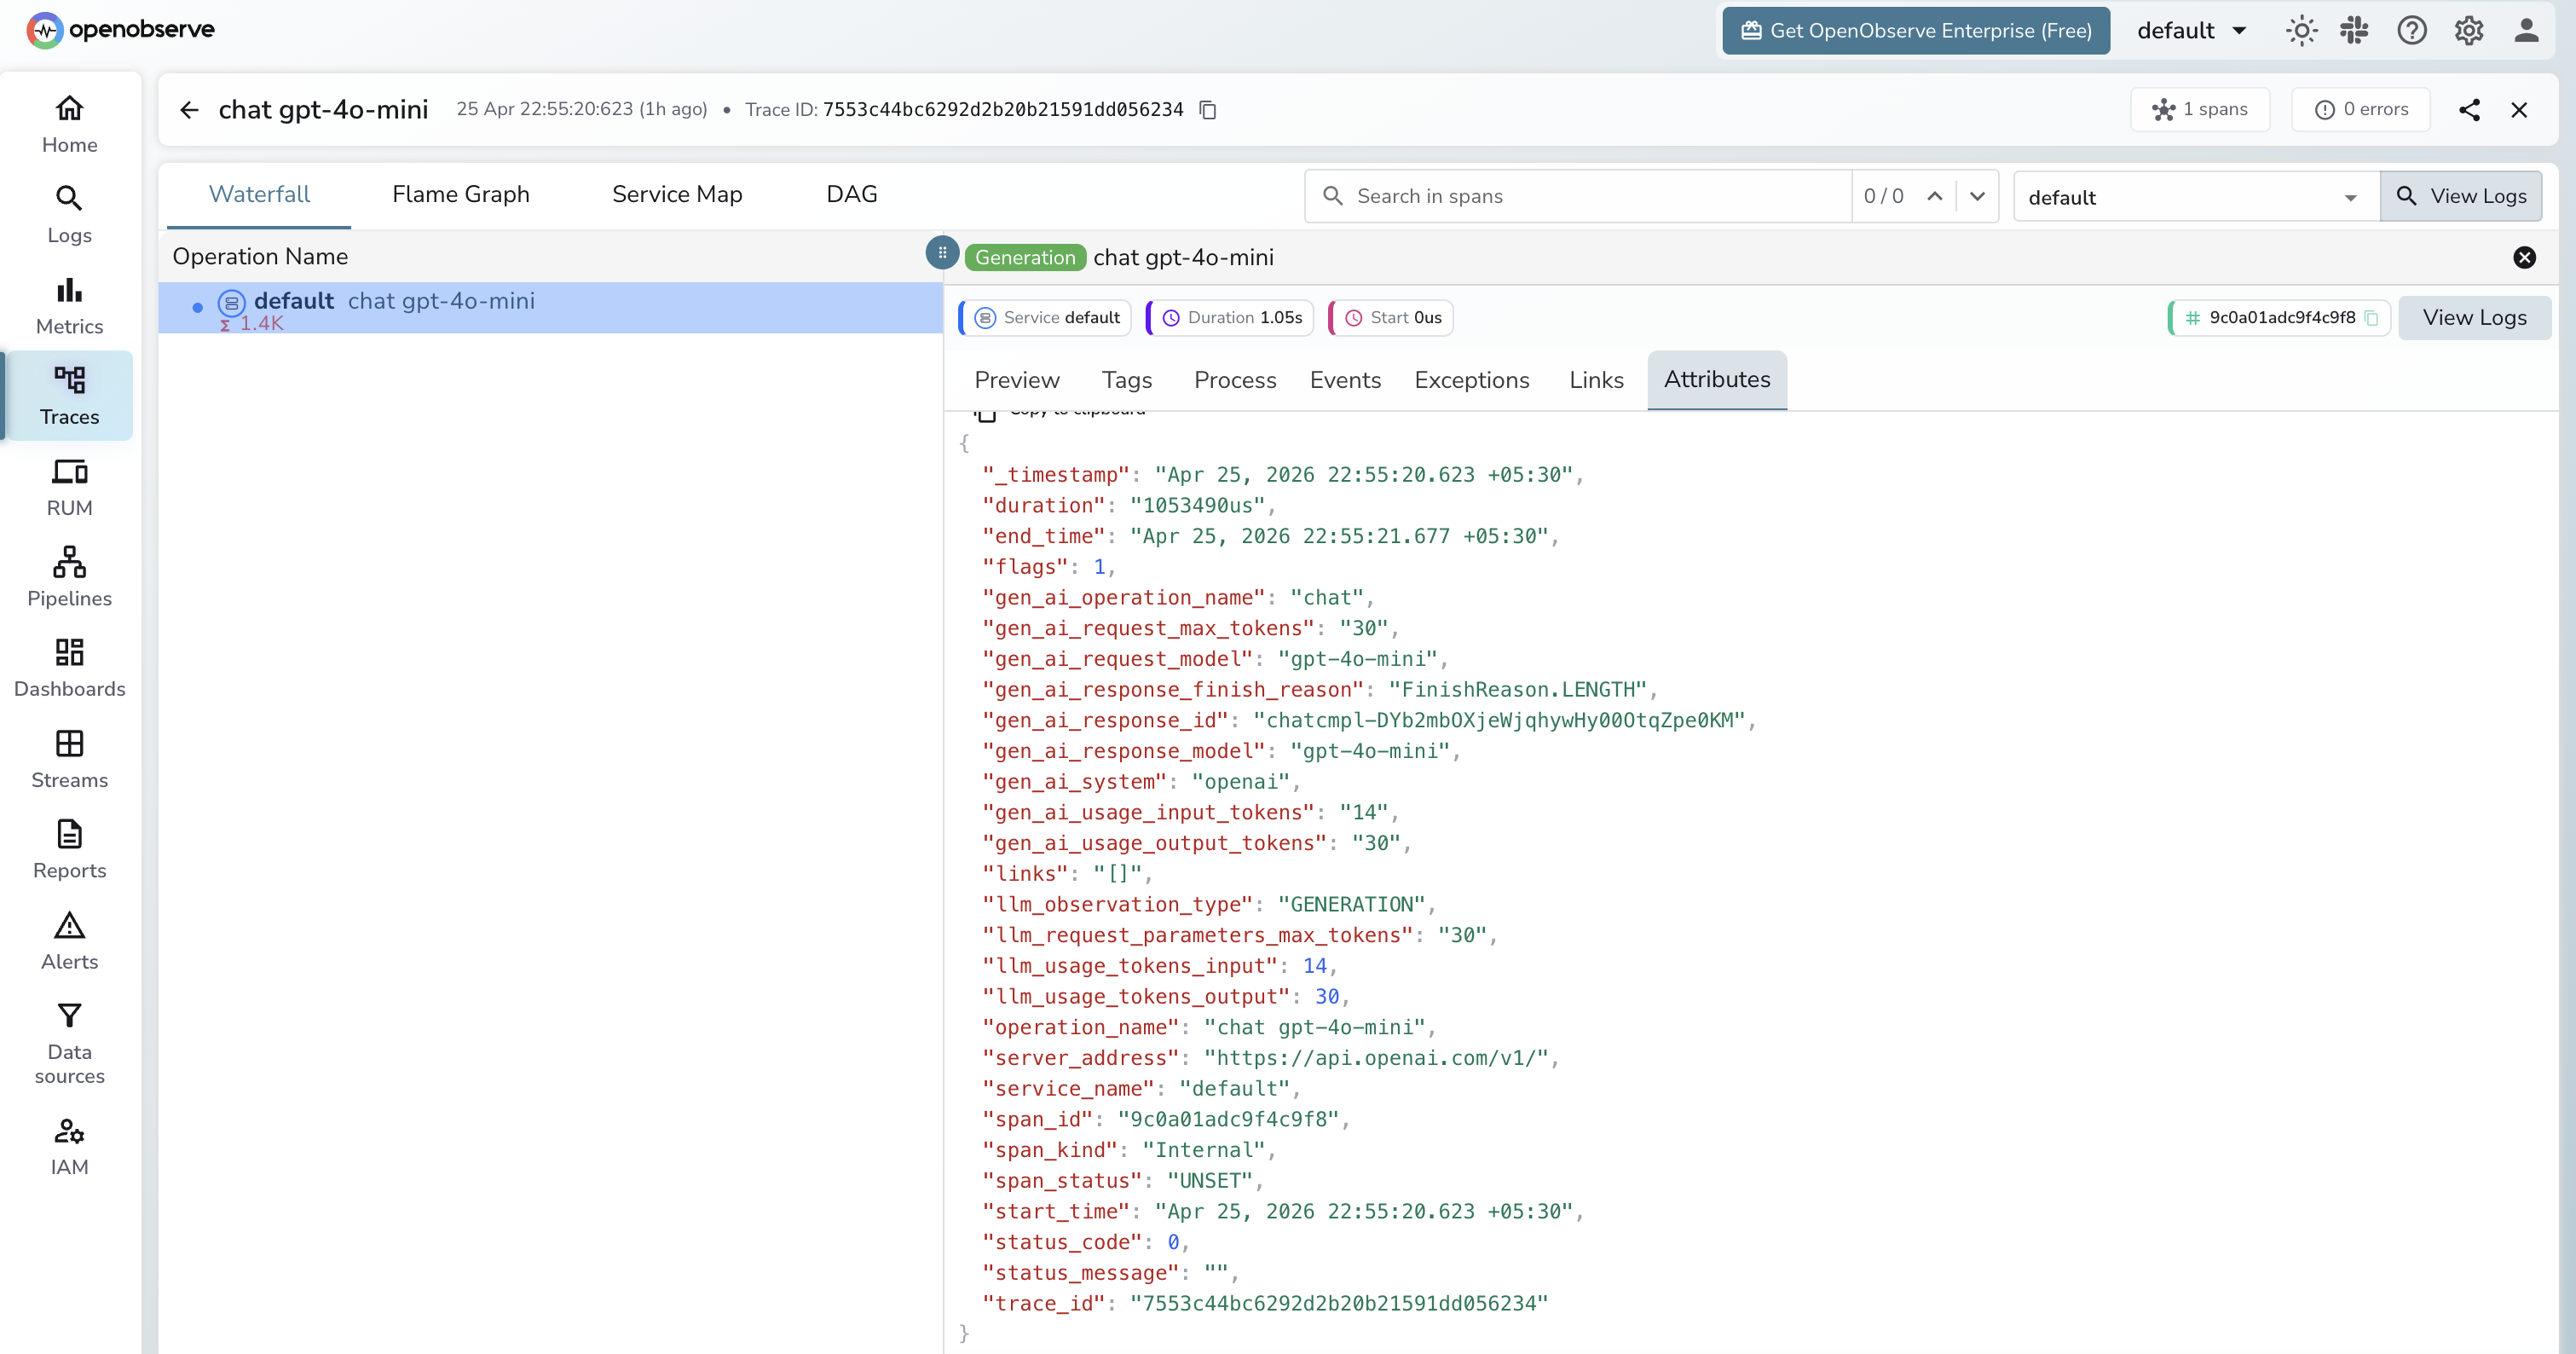
Viewing Traces
- Log in to OpenObserve and navigate to Traces
- Spans appear with the name
chat gpt-4o-mini(format:{operation} {model}) - Click a span to inspect token counts, model, finish reason, and response ID
- Filter by
gen_ai_systemto isolate Semantic Kernel spans from other services
Next Steps
With Semantic Kernel instrumented, every LLM call and function invocation is recorded in OpenObserve. From here you can track token usage, monitor function call latency, and set alerts on error spans.