
Open WebUI → OpenObserve
Capture chat completion spans from your Open WebUI instance. Open WebUI is a self-hosted interface for local and cloud LLMs that exposes an OpenAI-compatible API. Wrap API calls in manual OTel spans to record model, question, and response metadata in OpenObserve.
Prerequisites
- Python 3.8+
- Open WebUI running (Docker recommended)
- An OpenObserve account (cloud or self-hosted)
- Your OpenObserve organisation ID and Base64-encoded auth token
- An Open WebUI API key (from your profile settings)
Installation
pip install openobserve-telemetry-sdk python-dotenv requestsConfiguration
Start Open WebUI with Docker:
docker run -d --name openwebui \
  -p 3001:8080 \
  -e OPENAI_API_KEY=your-openai-key \
  -v openwebui-data:/app/backend/data \
  ghcr.io/open-webui/open-webui:main
Create a .env file in your project root:
OPENOBSERVE_URL=https://api.openobserve.ai/
OPENOBSERVE_ORG=your_org_id
OPENOBSERVE_AUTH_TOKEN=Basic <your_base64_token>
OPENWEBUI_BASE_URL=http://localhost:3001
OPENWEBUI_API_KEY=your-openwebui-api-key
OPENWEBUI_MODEL=gpt-4o-mini
To get your Open WebUI API key, go to your profile > API Keys and generate a new key.
Instrumentation
Call openobserve_init() to set up the tracer provider, then wrap each API call in a manual span.
from dotenv import load_dotenv
load_dotenv()

from openobserve import openobserve_init
openobserve_init()

from opentelemetry import trace
import os
import requests

tracer = trace.get_tracer(__name__)

base_url = os.environ.get("OPENWEBUI_BASE_URL", "http://localhost:3001")
api_key = os.environ["OPENWEBUI_API_KEY"]
model = os.environ.get("OPENWEBUI_MODEL", "gpt-4o-mini")

prompt = "Explain distributed tracing in one sentence."

with tracer.start_as_current_span("openwebui.chat_completion") as span:
    span.set_attribute("openwebui.model", model)
    span.set_attribute("openwebui.question", prompt)
    resp = requests.post(
        f"{base_url}/api/chat/completions",
        headers={"Authorization": f"Bearer {api_key}", "Content-Type": "application/json"},
        json={"model": model, "messages": [{"role": "user", "content": prompt}], "max_tokens": 100},
    )
    resp.raise_for_status()
    content = resp.json()["choices"][0]["message"]["content"]
    span.set_attribute("openwebui.response_length", len(content))

print(content)
What Gets Captured
| Attribute | Description |
|---|---|
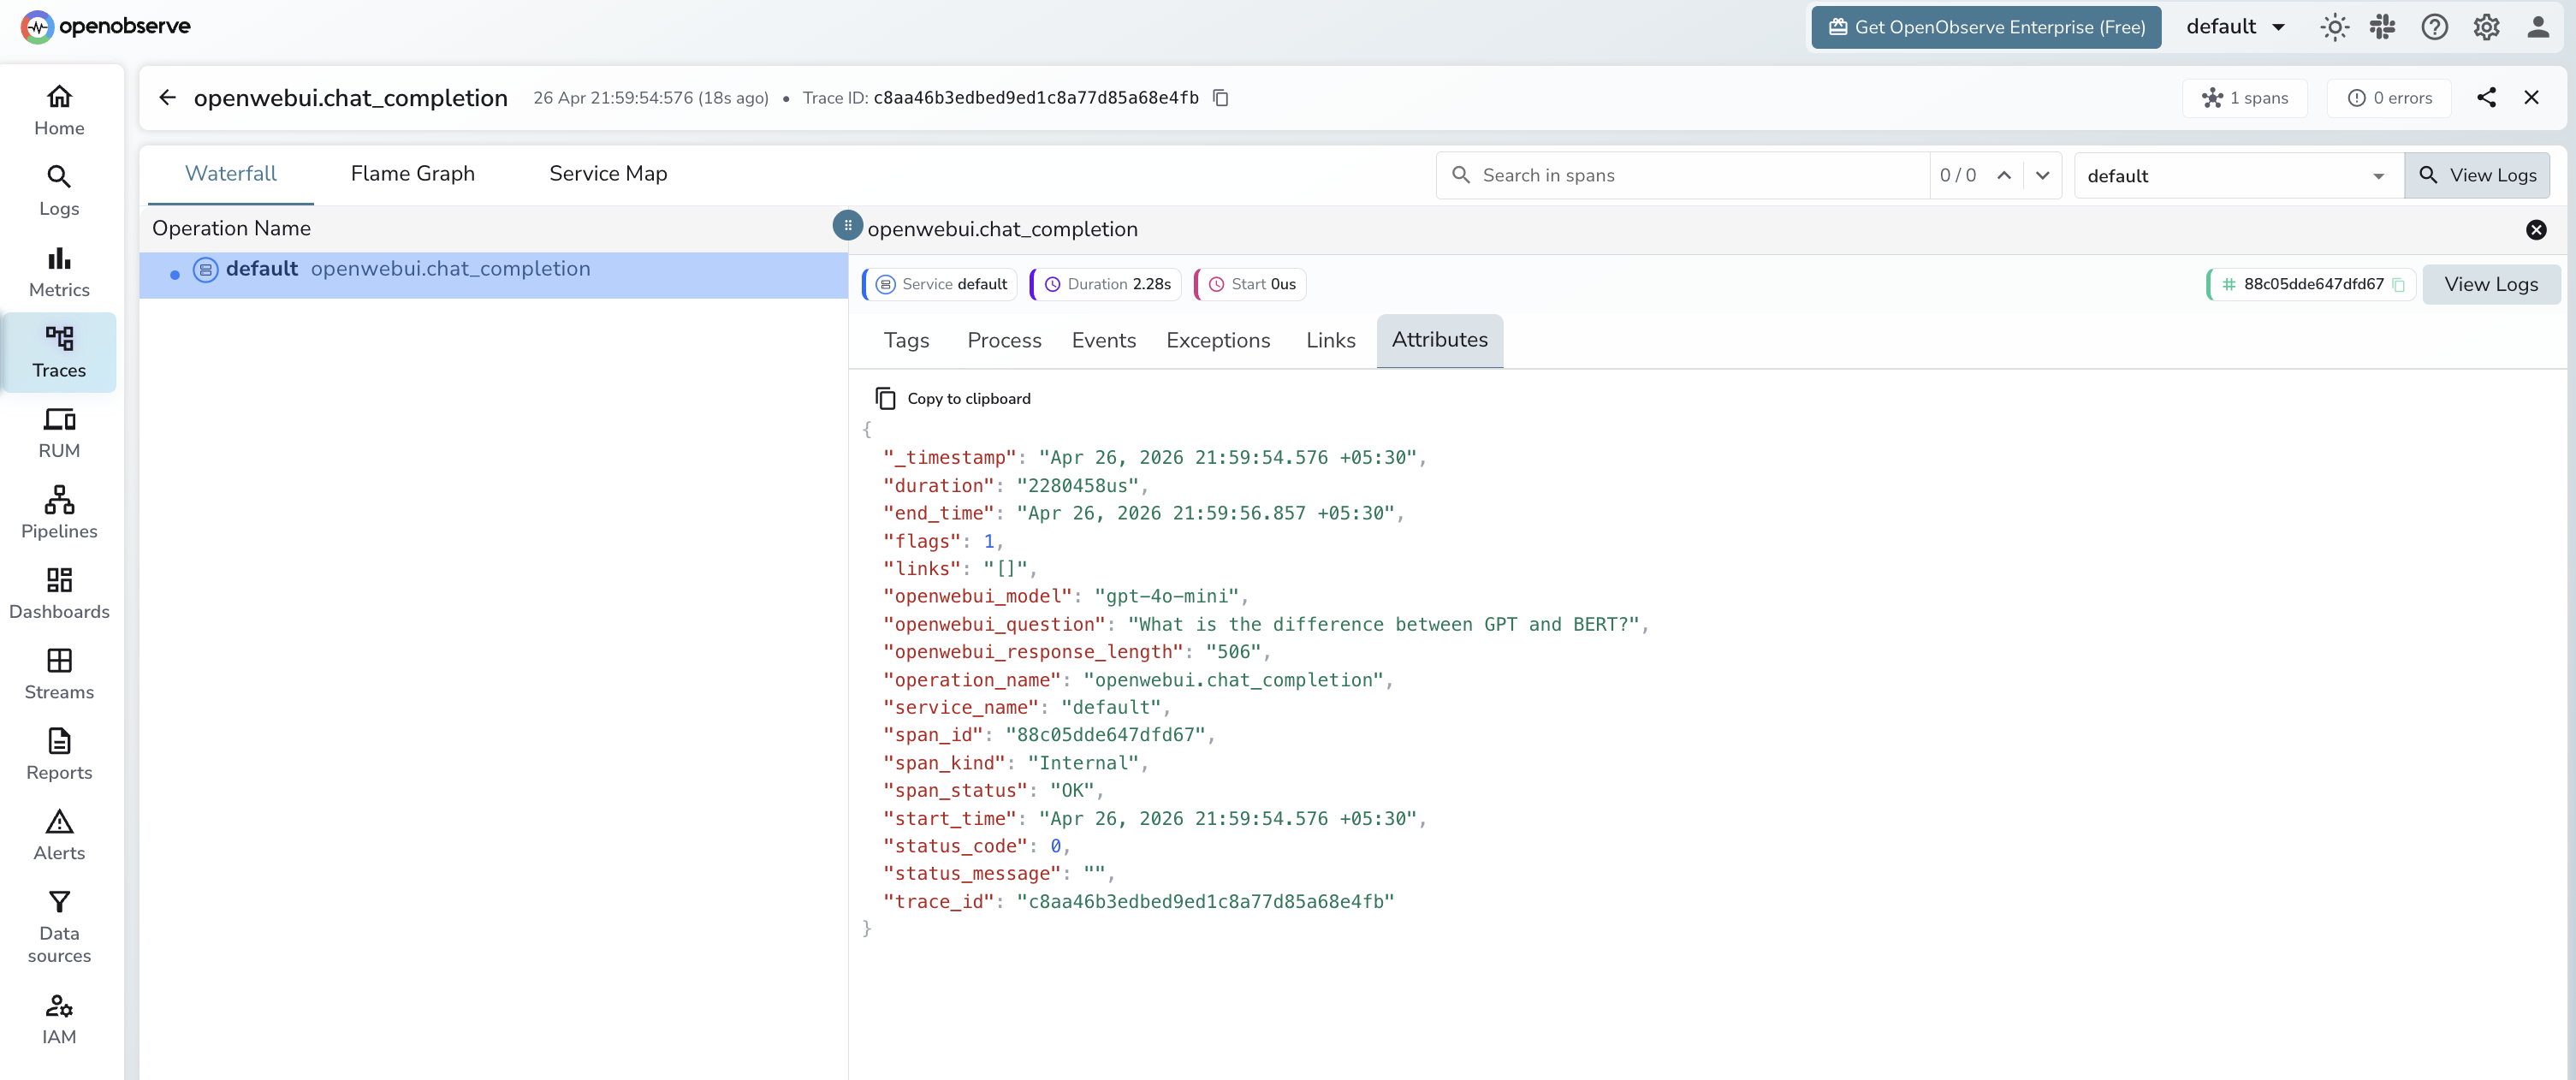
openwebui_model | The model used for the completion (e.g. gpt-4o-mini) |
openwebui_question | The prompt sent to the model |
openwebui_response_length | Character length of the model response |
operation_name | openwebui.chat_completion |
duration | End-to-end request latency |
span_status | OK on success, ERROR on failure |
Viewing Traces
- Log in to OpenObserve and navigate to Traces
- Filter by
operation_name = openwebui.chat_completion - Click any span to inspect the model, prompt, and response length
- Filter by
openwebui_modelto compare latency across models
Next Steps
With Open WebUI traces in OpenObserve, you can monitor chat response latency, track which models are used most, and set alerts on failed requests.
Read More
Last updated on
n8n
Send n8n webhook trigger traces to OpenObserve via OpenTelemetry to capture workflow latency, status codes, and payload metadata on every run.
Tools
Trace AI developer tools with OpenObserve: Promptfoo evaluations, Milvus vector search, Firecrawl scraping, Gradio, LibreChat, and MCP-Use agent calls.